
 ?Mathematical formulae have been encoded as MathML and are displayed in this HTML version using MathJax in order to improve their display. Uncheck the box to turn MathJax off. This feature requires Javascript. Click on a formula to zoom.
Abstract
A large-scale survey was conducted on 173 dairy goat farms in Northern Italy to provide an updated view on farm management practices and to investigate relations among management factors, herd traits and milk yield and quality with particular focus on milk somatic cell count (SCC) and milk fat/protein reversion syndrome. Monthly individual milk analyses (fat, protein and lactose percentages, SCC) and bulk tank milk analyses (fat, protein and lactose percentages, standard plate count (SPC), urea and casein) from 91 farms out of the 173 farms were collected for a year. Farming systems showed wide variability and were characterised by the coexistence of intensive farms adopting advanced technologies and extensive traditional ones. Average milk production was 1.25 kg/milking with high variability, significantly influenced by days in milk, month of kidding, herd size and parity. Out-of-season breeding was predicted to cause a slight reduction of milk production. The reversion syndrome between milk fat and protein contents affected more than half of samples. It worsened after 100 d of lactation and occurred earlier during lactation when kidding was in the late season (April–June) compared to kidding in the first months of the year. The defect was associated with high SCC in milk. The yearly average milk SCC was 5.8 log10 cells/mL; it was higher at the end of lactation and in goats kidding in the late season. A negative relationship between SCC and milk yield was found with an estimated loss of 0.23 kg per milking for each additional point of log10 SCC.
Introduction
In Italy milk is the most important goat product and is almost exclusively used for cheese making. In 2013 the Italian goat population approximately was 976.000 heads (AIA Citation2014), mainly located in the two major Italian islands (Sardinia and Sicily). The Lombardy region has nearly 11% of the Italian goat population (AIA Citation2014) but it is the first Italian region for milk production per head, with an average of 495 ± 214 kg per lactation (AIA Citation2015), and the second region for total goat milk production, approximately 18% of the whole Italian production (ISTAT Citation2014).
Both in Italy and in Lombardy dairy goat farming systems are characterised by high variability: from intensive indoor, mostly with specialised breed, to semi-extensive and extensive outdoor systems, with local breed, according to the economic relevance of the production chain and the specific environment and breed (Todaro et al. Citation2005; Manfredi et al. Citation2010). However, very few reports are available on goat farming systems and their recent evolution in Italy (Crepaldi et al. Citation1999; Todaro et al. Citation2005).
Considering the almost exclusive utilisation of goat milk in Italy for cheese-making, composition and hygienic quality of milk are important issues for their influence on cheese yield, nutritional composition and sensory quality.
In dairy cows, milk somatic cell count (SCC) is used as an indicator for udder health status and hygienic quality of milk (Paape et al. Citation2007) and the European legislation fixes a limit for SCC in bovine milk (Regulation (EC) Citation2004). Conversely, no limit of somatic cells in goat milk has been defined by law and SCC in goat milk has not yet been established as a proven indicator for udder health status (Sturh & Aurich Citation2010). Milk SCC from healthy goats is higher than SCC observed in milk from uninfected cows and ewes (Persson and Olofsson Citation2011; Souza et al. Citation2012). Different threshold levels were proposed for SCC in goat milk, but their predictive value of udder infections is very variable. Most of the studies inferred that, due to the numerous influencing factors, SCC allows only limited conclusions on the udder health status in goats (Moroni et al. Citation2005; Stuhr et al. Citation2013).
Nevertheless, some authors observed a relationship between SCC and the production and composition of goat milk. In particular, a negative relationship between SCC and milk yield was reported in some studies, as summarised by Raynal-Ljutovac et al. (Citation2007) and confirmed by recent research (Koop et al. Citation2010; Barrón-Bravo et al. Citation2013). The relationship between SCC and milk composition is still controversial, especially for milk fat: some authors reported a drop in milk fat with high SCC (Pisoni et al. Citation2004; Barrón-Bravo et al. Citation2013), while another study showed contrasting results (Todaro et al. Citation2005). Concerning milk protein, most of the studies agree in reporting a positive relationship between somatic cells and protein content of goat milk (Ying et al. Citation2002; Barrón-Bravo et al. Citation2013), particularly whey protein (Leitner et al. Citation2004). Chen et al. (Citation2010) found no changes in milk fat and protein contents with the increase of SCC, but significant alterations in cheese characteristics, such as texture and sensory quality. However, according to Raynal-Ljutovac et al. (Citation2007) the results on the effects of high SCC in goat milk on cheese yield and sensory quality are very variable. Somatic cells had a major effect on lipolysis, increasing free fatty acids regardless of whether milk was raw or pasteurised. The effect of somatic cells on proteolysis was specific for caseins and the effects were different if cheeses are made from raw or pasteurised milk Sánchez-Macías et al. (Citation2013).
According to the literature, in the evaluation of SCC in goat milk many influencing animal factors have to be considered other than intramammary infections: breed and genetic traits, stage of lactation, parity, oestrus, season of kidding and dry period length (Paape et al. Citation2007; Raynal-Ljutovac et al. Citation2007; Rupp et al. Citation2011; Barrón-Bravo et al. Citation2013; Stuhr et al. Citation2013).
Among management factors, milking frequency seems to have no effect on milk SCC while it modifies milk yield (Salama et al. Citation2003). Milking routine can influence the risk of mastitis in the herd and possibly milk SCC. In particular, the post-milking teat dip was found as a very effective method to prevent new intramammary infections in goats (Contreras et al. Citation2007). Goat udder halves with damaged teats are infected more frequently than halves with healthy treats (Bergonier et al. Citation2003); proper function of milking machines can have an important role in teat integrity (Alejandro et al. Citation2014) and udder health with likely beneficial effects on SCC. In particular, Marnet and McKusick (Citation2001) recommended a maximum vacuum level of 40 kPa.
A peculiarity of goat milk composition is the reversion syndrome, in which milk fat percentage goes below milk protein percentage with a subsequent decrease in cheese yield, quality and taste (Morand-Fehr et al. Citation2007). The origin of this defect may be genetic, but the most important factor seems to be the diet: low forage/concentrate ratios in the diets or low ether extract in the feeding rations (Sauvant Citation2000; Morand-Fehr et al. Citation2007; Pulina et al. Citation2008) can contribute to the problem.
The issues of high SCC and reversion syndrome in dairy goats and their effects on milk yield and quality are of actual interesting and are debated in many countries, especially in Europe (Morgan et al. Citation2003; Sanz Sampelayo et al. Citation2007; Zucali et al. Citation2007; Capgenes Citation2013).
The aims of the study were: i) to provide an updated view of farm management practices adopted in goat farms in Northern Italy; ii) to investigate the relations among farm management practices, herd traits and milk yield and quality; iii) to focus on factors affecting milk SCC and milk fat/protein reversion syndrome in goats.
Materials and methods
Sample description
A total of 173 farms agreed to participate in the study; through direct interviews to the farmers, information about herd management, breeds, milking machines, milking procedures, milk destination and barn facilities were collected, all data were referred of year 2013.
All farms produced goat milk for direct farm cheese-making or for sale to cheese factories. Two different farming systems were adopted in the sample farms: intensive indoor and semi-extensive with access to pastures during spring and summer seasons.
In 91 out of 173 farms, results of monthly individual milk yield samples and analyses (fat, protein and lactose percentages, SCC), performed by the Lombardy Breeders’ Association (ARAL), and monthly bulk tank milk analyses (fat, protein and lactose percentages, SCC, standard plate count (SPC), casein and urea) were collected for a year. Milk analyses were performed by the Lombardy Regional Breeders Association (ARAL) laboratory with the Milkoscan TM FT 6500 Plus instrument (Foss, Hillerød, Denmark) that employs the Fourier Transform Infrared Spectroscopy (FTIR) measuring principle. For SPC the Bactoscan FC was employed following the indication of IDF (FIL/IDF 100B:1991; 128:1999; Bollettino FIL/IDF 330/1998).
These 91 farms represented nearly 75% of the goat farms associated to the Lombardy Breeders’ Association.
Statistical analyses
First, from the dataset of individual milking controls and milk analyses (91 farms), data of goats bred in-season (month of kidding between January and June; 5559 goats; 36641 controls) were extracted to estimate the effects of month of kidding, stage of lactation, expressed as days in milk (DIM), herd size and parity on milk yield (MY) as kg/milking, reversion syndrome, expressed as milk fat/protein ratio (F/P), and milk SCC, expressed as log10 cells/mL, using the following model (Proc GLM; SAS Citation2012):
where Yijklmn is the ijklmn observation of the variable (MY, F/P and SCC); µ is the overall mean; Ki is the effect of month of kidding (i = 1–4; month of kidding: January, February, March, April–June); Dj is the effect of DIM (j = 1–5; DIM < 50; DIM 50–100; DIM 100–150; DIM 150–200; DIM > 200); Hk is the effect of farm (k = 1–91) as random effect; Pl is the effect of parity (l = 1–3; primiparous, secondiparous and multiparous goats); Mm is the effect of the level of milk production expressed as kg per milking (m = 1–3; <1 kg/milking; 1–2 kg/milking; >2 kg/milking); An is the animal effect, nested in farm effect (n = 1–5559) as random effect, and eijklmno represents the random error associated with each observation. The effect of milk production level and the interaction between milk production level and days of lactation were introduced in the model only when the variables analysed were F/P and SCC. To test the effect of month of kidding it was necessary to limit the dataset to goats bred in-season, because of the scarcity of data from goats bred out-of-season.
A specific covariance model was used to test the regressor effect of continuous DIM variable. Figure show least square means by DIM categories and not the regression curves predicted by the covariance model.
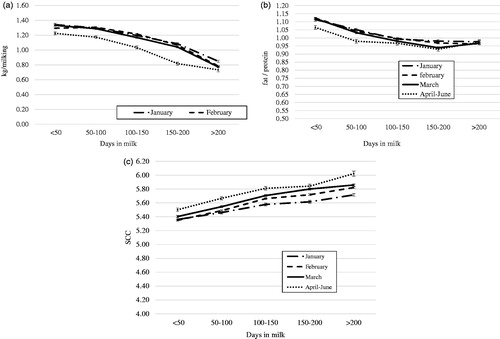
Figure 1(a–c). Change in milk yield, milk fat/protein ratio and milk somatic cell count (as log10 cells/mL) throughout lactation by month of kidding (LS means) for goats which kidded in season (goats = 5559).
Furthermore, starting from the complete dataset of individual milking controls and analyses, including also data of goats bred out-of-season, two multivariate logistic analyses were performed by LOGISTIC procedure; SAS, version 9.4 (SAS Inc., Cary, NC) to identify the main management risk factors associated to: (i) the presence in at least one monthly control of more than 50% of lactating goats in each farm with milk fat and protein reversion (milk fat/protein percentages <1); (ii) the presence in at least one monthly control of more than 50% of lactating goats in each farm with milk SCC > 5.8 log10 cell/mL. The SCC threshold was chosen on the basis of the mean milk SCC in the whole dataset, considering that a legal threshold does not exist. The logistic regression analyses examined all the possible interactions among variables. Variables or combinations of variables (interaction terms) were excluded through a stepwise backward method based on a 10% significance level. The results of the analyses were final models which include the variables (risk factors) that were significantly associated with fat and protein reversion and milk SCC > 5.8 log 10 cell/mL. The final models were described in terms of odds ratios, 95% confidence intervals.
Lastly, starting from the whole dataset of individual controls and analyses, the effects of kidding season, stage of lactation, breed, herd size, parity and SCC on milk yield as kg/milking (MY), milk fat percentage (F%) and milk protein percentage (P%) were estimated using the following model (Proc GLM; SAS Citation2012):
where Yijklmno is the ijklmno observation of the variable measured (MY, F% or P%); µ is the overall mean; Ki is the effect of kidding season (K = 1, 2; 1 kidding season between July and December, 2 kidding season between January and June); Dj is the effect of stage of lactation as DIM (j = 1–3; DIM <100; DIM 100–200; DIM >200); Bk is the effect of breed (k = 1–4; local breeds; Alpine; Saanen; Alpine and Saanen); Hl is the effect of herd size (l = 1–3; lactating goats <45; lactating goats 45–70; lactating goats >70); Pm is the effect of parity (m = 1–3; primiparous, secondiparous and multiparous goats); Gn is the individual effect of each goat (o = 1–6981); b(x) is the effect of SCC as covariate variable and eijklmno represents the random error associated with each observation.
Results and discussion
Table shows the main characteristics of the whole dataset of 173 dairy goat farms involved in the study, which represent approximately 8% of Lombardy goat farms (ISTAT Citation2010).
Table 1. Description of the 173 dairy goat farms: main characteristics (percentage of farms).
Half of the farms had less than 45 lactating goats; the average number of lactating goats per farm was 58 ± 60, from a minimum of 8 heads to a maximum of 380. The average size was higher than the Italian and Lombardy means (38 and 26 goats/farm, respectively; ISTAT Citation2010). This result is similar to data obtained by Arsenos et al. (Citation2014) in Greece where about the 61.7% of flock had less than 40 goats for farms and pared to the minimum value obtained in a following study of Gelasakis et al. (Citation2017).
The most widespread goat breeds in the studied farms were Saanen and Alpine, which are the most productive breeds in Italy, according to the statistics of the Italian Association of Animal Breeders (520 ± 211 and 509 ± 195 kg of milk per lactation, respectively; AIA Citation2015). Approximately 6% of the farms reared local breeds (Bionda dell’Adamello, Frisa, Nera di Verzasca, Orobica). Also in Spain there was a coexistence of two type of breeds and farm systems: in the most confined productive farms the flock includes the most productive breed while in the extensive farms the local breeds were most popular (Castel et al. Citation2010).
The destination of milk in most cases (82%) was farm-made cheese. An opposite condition was registered by Castel et al. (Citation2010) in Spain was the most of milk from intensive and extensive farms was used for industrial scale cheese making. Among the farms that directly produced cheese, the majority (72%) used non-pasteurised raw milk; this practice allows to maintain the traditional flavour of goat cheeses, thanks to the indigenous milk microflora that, with its diversity of species and strains, is mainly responsible for the specific sensory properties of raw milk cheeses (Grappin and Beuvier Citation1997). Conversely, the reported widespread use of starters, generally of commercial origin, in the studied farms could produce a standardisation of the organoleptic characteristics of cheeses.
Most of the dairy goats involved in the study were bred during the decreasing photoperiod (late summer-early autumn), when the natural oestrus occurred. Just 13.3% of the farms involved in the study bred part of their herds (47.4% of their goats, on average) out-of-season by applying oestrus induction treatments. At regional level an average of 23.4% of births was registered out of season, between June and December (AIA Citation2015). Seasonality of sexual activity is a typical characteristic of most goat breeds reared under temperate and subtropical latitudes (Delgadillo et al. Citation1999; Leboeuf et al. Citation2008). Out-of-season breeding of part of the herds allows to obtain milk all year long, with less fluctuations in bulk milk composition and cheese yield. Moreover, sales of milk and dairy products occur in a more favourable period of the year, when availability on the market is lower and prices higher.
In almost 30% of the studied farms, goats had access to pastures during the spring and summer seasons with advantages in terms of reducing purchased feeds and improving milk and cheese quality. A number of studies (Fedele Citation2008; Zervas and Tsiplakou Citation2011) have shown that, in comparison to milk from goats fed conventional diets, milk from grazing goats is higher in medium-chain FA that plays an important role in flavour of goat cheeses.
Regarding milking routine and procedures (Table ), most of the farms milked their goats twice a day (86.1%), while a group of farms reduced milking frequency from two to one per day in specific periods, generally at the end of lactation or during the grazing period. In the vast majority of the farms (91.3%) goats were machine milked, whereas hand milking was still present in a few farms characterised by small herds (29 heads on average). Also, Gelasakis et al. (Citation2017) found that the most of farms milked goats with machine milking. Results from previous researches suggest that hand milking can cause higher SCC than machine milking, but studies have been inconclusive (Boyazoglu and Morand-Fehr Citation2001; Haenlein Citation2002). Approximately half of the farms (48%) milked their goats in a separate milking room, while the others milked animals inside the barn, generally on an elevated platform. The milking machine had a pipeline system in 41.1% of the farms, in the other cases portable milking machines or buckets were used.
Table 2. Description of the 173 dairy goat farms: milking facilities and routine (percentage of farms).
In most farms milking vacuum level was <40 kPa, in agreement with Marnet and McKusick (Citation2001) that recommended a maximum value of 40 kPa. When the vacuum level rises, there is an increased risk of teat cup climbing, which can result in compression of the teat base, increased congestion of teat tissue and decreased milk flow.
Milking equipment was generally quite simple and less automated than that adopted in cattle farms located in the same area of Lombardy (Tangorra and Zanini Citation2014): automatic cluster removal was used in just 5% of the farms; moreover, in more than 50% of the farms milking machines cleaning procedures were manual and performed with warm/cold water (<45 °C).
Milking routine in the selected farms was quite different from the typical milking routine adopted in dairy cattle farms in the same area (Bava et al. Citation2011) where, in particular, teat pre- and post-dipping procedures were performed in more than 70–80% of the farms. In the studied goat farms, forestripping was the most widespread milking procedure; pre-dipping and post-dipping procedures were less frequent, as also found by Contreras et al. (Citation1999). In about 40% of the farms, milkers used to hand squeezing udder halves with milking unit on at the end of the machine milking to completely remove milk.
Considering the farm size in relation to the characteristics of farms, it could be noticed that the smallest farms (<45 lactating goats) were generally more traditional and extensive than the largest ones (>70 lactating goats): they adopted more frequently pasture grazing (39% of the farms vs 13% in the largest farms), the use of out-of-season breeding was very limited (1.1% vs 33%) and the utilisation of milk was almost farm-made cheese (90% vs 63% in the largest farms). Moreover, most of the large farms (67%) were in plain areas (<300 m above the sea level) whereas most of the farms located above 600 m (73%) had less than 45 goats.
Table shows average herd traits, milk production and milk composition of the sample of 91 farms both from individual and bulk tank milk controls.
Table 3. Average herd traits, milk production and quality of the sample of 91 farms (6981 goats; individual and bulk tank milk controls).
Average milk production was 1.25 kg/milking with a high variability (DS = 0.56). Considering only goats kidding in-season, individual milk production per milking was significantly affected (p < .001) by month of kidding, stage of lactation, herd size and parity (Figure ). In particular, goats which kidded in the late season (April–June) produced less milk than goats which kidded in the first months of the year (the least squares means for whole lactation were 1.16; 1.13; 1.12; 0.10 kg/milking for January, February, March, April–June month of kidding, respectively), in agreement with the findings of Crepaldi et al. (Citation1999). The abnormal trend in the last part of the milk yield curve of goats which kidded in April–June was the result of the low number of animals.
Mean milk fat percentage was lower than protein percentage (3.49% vs 3.59%) and more than half of the individual milk samples (51.4%) was characterised by milk fat/protein reversion.
Milk fat/protein ratio was significantly influenced (p < .001) by month of kidding, stage of lactation, herd size, parity and level of milk production. In particular, after the first 100 DIM the phenomenon of milk fat and protein reversion (Figure ) started to be severe; this is consistent with the findings of Morand-Fehr (Citation1996) and Komara et al. (Citation2009). Moreover, goats which kidded in late season (April–June) showed the reversion earlier in comparison with goats which kidded in the first months of the year. Once appeared, the reversion persisted until the end of lactation.
SCC was characterised by high variability and an average value (5.86 log10 cells/mL) higher than the mean values reported by other authors (Moroni et al. Citation2005; Persson and Olofsson Citation2011; Capgenes Citation2013). SCC was significantly (p < .001) affected by month of kidding, stage of lactation, herd size, parity and level of milk production. Considering the effect of month of kidding (Figure ), SCC was constantly higher for goats which kidded in the late season (April–June) than for goats which kidded in the first months of the year (SCC was 5.66; 5.71; 5.78; 5.93 log10 SCC/mL for January, February, March, April–June month of kidding, respectively). For these goats lactation period occurs in the most adverse season when the high temperature and humidity condition limited the milk quality also in term of microbiological count. SCC was significantly higher in milk from low producing goats and lower in milk from high producing ones; this is consistent with findings of Barrón-Bravo et al. (Citation2013) and Leitner et al. (Citation2008) and probably due to a dilution effect of milk.
Milk urea content was higher than the range of 28–32 mg/dL suggested by Brun-Bellut et al. (Citation1984) and was characterised by high variability, as reported also by Rapetti et al. (Citation2014) and by Giaccone et al. (Citation2007). As known, high milk urea concentration could be an indicator of unbalanced feeding and low nitrogen utilisation.
Table shows the results of the multiple correlations from the logistic analysis, among farm management, herd traits and the risk to have more than 50% of the lactating goats presenting the reversion syndrome between fat and protein contents in milk.
Table 4. Logistic analysis of risk factors associated to the presence of more than 50% of lactating goats with milk fat/protein reversion.
The results suggest that milk samples with SCC higher than 5.8 log10 cell/mL were much more likely to exhibit fat/protein reversion. As found by other authors (Barrón-Bravo et al. Citation2013; Sánchez-Macías et al. Citation2013), an increase in SCC promotes high level of protein in milk, in particular immunoactive proteins. Moreover, most of the studies reported a negative relationship between SCC and milk fat (Pisoni et al. Citation2004; Barrón-Bravo et al. Citation2013; Sánchez-Macías et al. Citation2013). It can be argued that high SCC could be another predisposing factor to fat/protein reversion. Small herds (<45 lactating goats) are more likely to be affected by the reversion syndrome in comparison to the largest herds and high producing goats (≥1.4 kg/milking) are more at risk than low producing ones. Among milking procedures, hand squeezing the udder halves at the end of milking with the milking unit on can increase the risk of fat/protein reversion.
The origin of the reversion syndrome is not yet completely clear: there is probably a genetic component but most of the studies agree in attributing a key role to feeding. In particular Morand-Fehr et al. (Citation2007), Pulina et al. (Citation2008) and Sauvant (2000) ascribed the reversion to low Forage/Concentrate ratios in the diets, low levels of intake or ether extract content of feeding rations lower than 2.6% of dry matter in particular in high yielding dairy goats.
The introduction of lipid supplements, for example extruded soya seeds (Schmidely et al. Citation2004), into the diet of lactating goats, can enhance milk fat content and mitigate reversion. The reversion phenomenon could be linked to subacute rumen acidosis conditions. As described by Giger-Reverdin et al. (Citation2014) subacute acidosis is induced by diet with high content of concentrate; the consequences are lower milk fat/protein ratio and increased milk SCC compared to diet with high forage content. The reduction of milk fat, typical of the reversion syndrome, can cause problems in cheese making, with decrease in cheese yield and cheese fat content and modifications in the rheological and sensorial qualities (Morand-Fehr et al. Citation2007). On the other hand, it is important to consider that milk composition in terms of protein has a direct impact on its acidifying properties. As reported by Raynal-Ljutovac et al. (Citation2005) a high percentage of proteins and minerals favour the activity of the lactic acid bacteria and milk with high protein and especially high casein content has high buffering properties.
However, there are only few studies on this issue and more research is required to better understand the genesis of this phenomenon and the possible mitigation strategies. In particular, the effects of factors other than feeding deserve more attention.
Table illustrates the results of the logistic regression performed to detect the risk factors to have more than 50% of lactating goats with milk SCC > 5.8 log10 cell/mL.
Table 5. Logistic analysis of risk factors associated to the presence of more than 50% of lactating goats with SCCTable Footnote* > 5.8 log10 cell/mL.
The highest risk of exhibiting high milk SCC was found in the large (>70 lactating goats) compared to small ones. Medium size farms (45–70 lactating goats) as well were more likely to have more than 50% of lactating goats with high milk SCC in comparison to small size ones. Surprisingly, performing teat post-milking disinfection was identified by the logistic regression as a risk factor for high SCC. The result is probably caused by the effect of confounding factors: in dairy goat farms teat post dipping is generally used only when udder health problems are detected and more often in the larger farms. Thus, despite its statistical significance, post dipping cannot be considered a good predictor of high SCC risk in dairy goats.
The risk of high SCC has connected also with low milk production, high milk protein content, reversion between fat/protein content in milk and high SPC. The relation between high SCC and low milk production is already well-known in goats and dairy cattle (Sandrucci et al. Citation1992; Leitner et al. Citation2008; Barrón-Bravo et al. Citation2013). The relation between high SCC and milk protein was established by Sánchez-Macías et al. (Citation2013). Also, the relation between high SCC and high SPC in milk is quite established as reported by Bagnicka et al. (Citation2011) and Persson and Olofsson (Citation2011).
The risk of high SCC is higher with milking vacuum level <40 kPa than >40 kPa. This is in contrast with the recommendations of Marnet and McKusick (Citation2001) that suggested a maximum value of 40 kPa.
In Table milk production and milk fat and protein contents were estimated on the basis of animal and management factors and milk SCC by a regression model.
Table 6. Regression model for milk yield, milk fat and milk protein percentages.
As expected, milk production was predicted to be higher before 200 DIM and in specialised dairy breeds (Alpine and Saanen in particular) in comparison to minor local breeds. Goats kidding out-of-season produced slightly less milk than in-season ones. A major seasonal effect on lactation curves and milk production was reported by León et al. (Citation2012) in a study on Spanish goat farms. Nevertheless, the comparison of seasonal effects must be taken with caution, as they are highly dependent on the variability among seasons and the degree to which management systems are able to minimise the exposure of goats to the impact of seasonal environmental effects.
Primiparous goats were predicted to produce approximately 10% less milk than multiparous ones; the lower milk production at the first parity is due to the incomplete growth of mammary gland and in agreement with previous results obtained in Mediterranean, North-European and Mexican breeds (Crepaldi et al. Citation1999; Fernández et al. Citation2002; Macciotta et al. Citation2005).
SCC negatively influenced milk production, as found by Barrón-Bravo et al. (Citation2013), Koop et al. (Citation2010) and Leitner et al. (Citation2008) and as reported for dairy cows (Sandrucci et al. Citation1992): each increment of one log-point of SCC corresponds to a reduction of 0.23 kg of milk per milking. Considering an average production per milking of 1.25 kg, estimated milk loss is equivalent to approximately 18% per each increment of one log-point SCC. Barrón-Bravo et al. (Citation2013) reported estimated losses in test day milk yield between 0.2 and 29.2% according to the level of SCC and breed.
Fat content tended to decrease between 100 and 200 DIM in comparison to the early and late lactation periods mainly as a consequence of the dilution effect (Pulina et al. Citation2008) and probably for the influence of season (photoperiod and temperature) for goats which kidded in-season, that were the majority. Milk protein percentage increases in the late lactation period as milk yield decreases.
Milk from Saanen goats was estimated to be lower in fat and protein contents than milk from Alpine goats, as confirmed by the statistics provided by the Italian Association of Animal Breeders (AIA Citation2015). Minor breeds (Bionda dell’Adamello, Orobica and Frisa) had higher milk fat content than Saanen, partially because of their lower milk production; moreover, they are more frequently managed in semi-extensive conditions with high fibre diets. Season of kidding significantly influence fat and protein contents, which were higher in out-of-season lactations. Medium size herds (45–70 lactating goats) were associated with a slightly and significant increase of both milk yield and quality. Primiparous goats were predicted to produce milk richer in fat and protein than multiparous ones. As SCC increases, a slight increase in milk fat and a strong rise of protein content were estimated.
In the regression model of Table , some management factors resulted out of the models, because of no significant, due to the high variability of the farms.
Conclusions
The results of the large-scale survey on goat farms based in Northern Italy (Lombardy) provided an updated picture of farming systems and goat milk production in that area, but interesting many farmers in other areas. Rearing techniques showed considerable variability were characterised by the coexistence of intensive farms and extensive traditional ones. Most of the farms reared high yielding specialised breeds, in particular Saanen and Alpine, but several farms preferred local breeds. Out-of-season breeding was still not widespread and in some cases the practice of manual milking survived. As a consequence of different farming systems and different breeds milk production and quality were very variable within the sample.
The statistic approach applied underlines the great influence of the season of kidding on average milk production, SCC and the expression of the reversion syndrome between milk fat and protein suggesting that the application of oestrus induction treatments could be associated with adequate feed programme in order to sustain production.
Although SCC was not considered a reliable indicator of mastitis in goats, losses of milk associated to the increase in somatic cells suggest the need for greater attention to the problem in particular in the small farms where sometimes is difficult to adopt continuously the correct milking procedure. Concerning the reversion syndrome of milk fat and protein, there is the need to better understand the genesis of this phenomenon and its mitigation strategies. In particular, the effect of factors other than feeding deserves more attention, in particular the influence of high SCC.
Acknowledgements
The authors would like to thank Stefano Milanesi and the other technicians of the Lombardy Association of Animal Breeders (Associazione Regionale Allevatori Lombardia) for their support and valuable suggestions. Many thanks are due also to the farmers for having made available their herd data.
Disclosure statement
No potential conflict of interest was reported by the authors.
References
- AIA. 2014. Relazione annuale. [accessed 2016 July 10] http://www.aia.it.
- AIA. 2015. Bollettino dei controlli della produttività del latte. [accessed 2016 Jul 10]. http://bollettino.aia.it/bollettino/bollettino.htm .
- Alejandro M, Roca A, Romero G, Díaz JR. 2014. Short communication: effects of milk removal on teat tissue and recovery in Murciano-Granadina goats. J Dairy Sci. 97:5012–5016.
- Arsenos G, Gelasakis A, Pinopoulos S, Giannakou R, Amarantidis I. 2014. Description and typology of dairy goat farms in Greece. In: Rahmann, G. and Aksoy, U. editors. Building Organic Bridges. Braunschweig, Germany: Johann Heinrich von Thünen-Institut; vol. 2, Thuenen Report, no. 20, pp. 571–574.
- Bagnicka E, Winnicka A, Jóźwik A, Rzewuska M, Strzałkowska N, Kościuczuk E, Prusaka B, Kabab J, Horbanczuka J, Krzyżewski J. 2011. Relationship between somatic cell count and bacterial pathogens in goat milk. Small Rumin Res. 100:72–77.
- Barrón-Bravo OG, Gutiérrez-Chávez AJ, Ángel-Sahagún CA, Montaldo HH, Shepard L, Valencia-Posadas M. 2013. Losses in milk yield, fat and protein contents according to different levels of somatic cell count in dairy goats. Small Rumin Res. 113:421–431.
- Bava L, Zucali M, Sandrucci A, Brasca M, Vanoni L, Zanini L, Tamburini A. 2011. Effect of cleaning procedure and hygienic condition of milking equipment on bacterial count of bulk tank milk. J Dairy Res. 78:211–219.
- Bergonier D, De Crémoux R, Rupp R, Lagriffoul G, Berthelot X. 2003. Mastitis of dairy small ruminants. Vet Res. 34:689–716.
- Boyazoglu J, Morand-Fehr P. 2001. Mediterranean dairy sheep and goat products and their quality. A critical review. Small Rumin Res. 40:1–11.
- Brun-Bellut J, Laurent F, Vignon B. 1984. Urea content in milk and allantoin content in urine: parameters estimating of nitrogen nutrition in lactating goats. Can J Anim Sci. 64:281–282.
- Capgenes. 2013. Dossier: les cellules en élevage caprin. Le Bulletin Capgenes. [accessed 2017 May 10]. http://www.capgenes.com/IMG/pdf_Web-Bulletin-n10Capgen-nov-2013.pdf.
- Castel JM, Ruiz FA, Mena Y, Sánchez-Rodríguez M. 2010. Present situation and future perspectives for goat production systems in Spain. Small Rum Res. 89:207–210.
- Chen SX, Wang JZ, Van Kessel JS, Ren FZ, Zeng SS. 2010. Effect of somatic cell count in goat milk on yield, sensory quality, and fatty acid profile of semisoft cheese. J Dairy Sci. 93:1345–1354.
- Contreras A, Paape MJ, Miller RH. 1999. Prevalence of subclinical intramammary infection caused by Staphylococcus epidermidis in a commercial dairy goat herd. Small Rumin Res. 31:203–208.
- Contreras A, Sierra D, Sánchez A, Corrales JC, Marco JC, Paape MJ, Gonzalo C. 2007. Mastitis in small ruminants. Small Rumin Res. 68:145–153.
- Crepaldi P, Corti M, Cicogna M. 1999. Factors affecting milk production and prolificacy of Alpine goats in Lombardy (Italy). Small Rumin Res. 32:83–88.
- Delgadillo JA, Canedo GA, Chemineau P, Guillaume D, Malpaux B. 1999. Evidence for an annual reproductive rhythm independent of food availability in male Creole goats in subtropical northern Mexico. Theriogenology. 52:727–737.
- Fedele V. 2008. Aromatic and nutritional quality of goat’s milk. In: Cannas A, Pulina G, editors. Dairy goats feeding and nutrition. Wallingford (UK): CAB International; p. 95–118.
- Fernández C, Sánchez A, Garcés C. 2002. Modeling the lactation curve for test-day milk yield in Murciano-Granadina goats. Small Rumin Res. 46:29–41.
- Gelasakis AI, Rose G, Giannakou R, Valergakis GE, Theodoridis A, Fortomaris P, Arsenos G. 2017. Typology and characteristics of dairy goat production systems in Greece. Livest Sci. 197:22–29.
- Giaccone P, Todaro M, Scatassa ML. 2007. Factors associated with milk urea concentrations in Girgentana goats. Ital J Anim Sci. 6(1):622–624.
- Giger-Reverdin S, Rigalma K, Desnoyers M, Sauvant D, Duvaux-Ponter C. 2014. Effect of concentrate level on feeding behavior and rumen and blood parameters in dairy goats: relationships between behavioral and physiological parameters and effect of between-animal variability. J Dairy Sci. 97:4367–4378.
- Grappin R, Beuvier E. 1997. Possible implications of milk pasteurization on the manufacture and sensory quality of ripened cheese. Int Dairy J. 7:751–761.
- Haenlein GF. 2002. Relationship of somatic cell counts in goat milk to mastitis and productivity. Small Rumin Res. 45:163–178.
- ISTAT. 2010. 6°Censimento Agricoltura. [accessed 2016 Jul 10]. https://censimentoagricoltura.istat.it/index.php?id=73.
- ISTAT. 2014. Annuario statistico italiano. 13-Agricoltura. [accessed 2016 Jul 17]. http://www.istat.it/it/files/2014/11/C13.pdf.
- Komara M, Boutinaud M, Ben Chedly H, Guinard-Flament J, Marnet PG. 2009. Once-daily milking effects in high-yielding Alpine dairy goats. J Dairy Sci. 92:5447–5455.
- Koop G, van Werven T, Schuiling HJ, Nielen M. 2010. The effect of subclinical mastitis on milk yield in dairy goats. J Dairy Sci. 93:5809–5817.
- Leboeuf B, Delgadillo JA, Manfredi E, Piacère A, Clément V, Martin P, Pellicer-Rubio MT, Boué P, de Cremoux R. 2008. Place de la maîtrise de la reproduction dans les schémas de sélection en chèvres laitières. INRA Prod Anim. 21:391–402.
- Leitner G, Merin U, Silanikove N. 2004. Changes in milk composition as affected by subclinical mastitis in goats. J Dairy Sci. 87:1719–1726.
- Leitner G, Silanikove N, Merin U. 2008. Estimate of milk and curd yield loss of sheep and goats with intrammamary infection and its relation to somatic cell count. Small Rumin Res. 74:221–225.
- León JM, Macciotta NPP, Gama LT, Barba C, Delgado JV. 2012. Characterization of the lactation curve in Murciano-Granadina dairy goats. Small Rumin Res. 107:76–84.
- Macciotta NP, Fresi P, Usai G, Cappio-Borlino A. 2005. Lactation curves of Sarda breed goats estimated with test day models. J Dairy Res. 72:470–475.
- Manfredi MT, Di Cerbo AR, Zanzani S, Stradiotto K. 2010. Breeding management in goat farms of Lombardy, northern Italy: risk factors connected to gastrointestinal parasites. Small Rumin Res. 88:113–118.
- Marnet PG, McKusick BC. 2001. Regulation of milk ejection and milkability in small ruminants. Livest Prod Sci. 70:125–133.
- Morand-Fehr P. 1996. Alimentation et qualité du lait de chèvre. Inversion des taux (Nutrition and goat milk quality: inversion of fat and protein percentages). Réussir-La Chèvre. 213:25–30.
- Morand-Fehr P, Fedele V, Decandia M, Le Frileux Y. 2007. Influence of farming and feeding systems on composition and quality of goat and sheep milk. Small Rumin Res. 68:20–34.
- Morgan F, Massouras T, Barbosa M, Roseiro L, Ravasco F, Kandarakis I, Bonnin V, Fistakoris M, Anifantakis E, Jaubert G, et al. 2003. Characteristics of goat milk collected from small and medium enterprises in Greece, Portugal and France. Small Rumin Res. 47:39–49.
- Moroni P, Pisoni G, Ruffo G, Boettcher PJ. 2005. Risk factors for intramammary infections and relationship with somatic-cell counts in Italian dairy goats. Prev Vet Med. 69:163–173.
- Paape MJ, Wiggans GR, Bannerman DD, Thomas DL, Sanders AH, Contreras A, Moroni P, Miller RH. 2007. Monitoring goat and sheep milk somatic cell counts. Small Rumin Res. 68:114–125.
- Persson Y, Olofsson I. 2011. Direct and indirect measurement of somatic cell count as indicator of intramammary infection in dairy goats. Acta Vet Scandin. 53:1–5.
- Pisoni G, Fusi E, Cheli F, Rebucci R, Moroni P, Baldi A. 2004. Mammary gland health status and plasmin–plasminogen system in dairy goat. In: Book of Abstracts of the Eighth International Conference on Goats, South Africa, July 4–9, 90.
- Pulina G, Nudda A, Battacone G, Fancellu S, Francesconi AHD. 2008. Nutrition and quality of Goat’s milk. In: Cannas, A, Pulina, G, editors. Dairy goats feeding and nutrition. Wallingford (UK): CAB International; p. 1–30.
- Rapetti L, Colombini S, Galassi G, Crovetto GM, Malagutti L. 2014. Relationship between milk urea level, protein feeding and urinary nitrogen excretion in high producing dairy goats. Small Rumin Res. 121:96–100.
- Raynal-Ljutovac K, Gaborit P, Lauret A. 2005. The relationship between quality criteria of goat milk, its technological properties and the quality of the final products. Small Rumin Res. 60:167–177.
- Raynal-Ljutovac K, Pirisi A, De Cremoux R, Gonzalo C. 2007. Somatic cells of goat and sheep milk: analytical, sanitary, productive and technological aspects. Small Rumin Res. 68:126–144.
- Regulation (EC). 2004. No 853/2004 of the European Parliament and of the Council of 29 April 2004 laying down specific hygiene rules for on the hygiene of foodstuffs. Off. J. L (2004), p. 139–155. [accessed 2016 Jun 1]. http://eur-lex.europa.eu/.
- Rupp R, Clément V, Piacere A, Robert-Granié C, Manfredi E. 2011. Genetic parameters for milk somatic cell score and relationship with production and udder type traits in dairy Alpine and Saanen primiparous goats. J Dairy Sci. 94:3629–3634.
- Salama AAK, Such X, Caja G, Rovai M, Casals R, Albanell E, Marın MP, Marti A. 2003. Effects of once versus twice daily milking throughout lactation on milk yield and milk composition in dairy goats. J Dairy Sci. 86:1673–1680.
- Sánchez-Macías D, Morales-delaNuez A, Torres A, Hernández-Castellano LE, Castro N, Argüello A. 2013. Effects of addition of somatic cells to caprine milk on cheese quality. Int Dairy J. 29:61–67.
- Sandrucci A, Tamburini A, Rapetti L. 1992. Studio preliminare sull’utilizzo del linear score per la valutazione del contenuto in cellule somatiche del latte. XXVII Simposio internazionale di zootecnia, Milano 3 April 1992, p. 175–190. [accessed 2016 Oct 10]. https://www.researchgate.net/publication/308034273_Studio_preliminare_sull%27utilizzo_del_Linear_Score_per_la_valutazione_del_contenuto_in_cellule_somatiche_del_latte.
- Sanz Sampelayo MR, Chilliard Y, Schmidely PH, Boza J. 2007. Influence of type of diet on the fat constituents of goat and sheep milk. Small Rumin Res. 68:42–63.
- Sauvant D. 2000. Effect of roughage level and source in diets on the risk of reversing fat and protein percentages in goat milk. Options Mediterraneennes. 52:115–118.
- SAS. 2012. SAS 9.4. SAS Institute Inc., Cary NC, USA.
- Schmidely P, Morand-Fehr P, Tessier J, Rouzeau A. 2004. Effect of extruded soya seed on reversion of fat and protein percentage and fatty acid composition of goat milk. In: Ben Salem H., Nefzaoui A, Morand-Fehr P, editors. Nutrition and feeding strategies of sheep and goats under harsh climates. Zaragoza: CIHEAM; p. 91–93.
- Souza FN, Blagitz MG, Penna CFAM, Della Libera AMMP, Heinemann MB, Cerqueira MMOP. 2012. Somatic cell count in small ruminants: friend or foe? Small Rumin Res. 107:65–75.
- Stuhr T, Aulrich K. 2010. Intramammary infections in dairy goats: recent knowledge and indicators for detection of subclinical mastitis. Landbauforschung. 60:267–279.
- Stuhr T, Aulrich K, Barth K, Knappstein K, Larsen T. 2013. Influence of udder infection status on milk enzyme activities and somatic cell count throughout early lactation in goats. Small Rumin Res. 111:139–146.
- Tangorra FM, Zanini L. 2014. I sistemi di mungitura in Lombardia. L’Informatore Agrario. 36:32–33.
- Todaro M, Scatassa ML, Giaccone P. 2005. Multivariate factor analysis of Girgentana goat milk composition. Ital J Anim Sci. 4:403–410.
- Ying C, Wang HT, Hsu JT. 2002. Relationship of somatic cell count, physical, chemical and enzymatic properties to the bacterial standard plate count in dairy goat milk. Livest Prod Sci. 74:63–77.
- Zervas G, Tsiplakou E. 2011. The effect of feeding systems on the characteristics of products from small ruminants. Small Rumin Res. 101:140–149.
- Zucali M, Bava L, Penati C, Rapetti L. 2007. Effect of raw sunflower seeds on goat milk production in different farming systems. Ital J Anim Sci. 6 (1):633–635.