
 ?Mathematical formulae have been encoded as MathML and are displayed in this HTML version using MathJax in order to improve their display. Uncheck the box to turn MathJax off. This feature requires Javascript. Click on a formula to zoom.
Abstract
Genetic parameters of direct and maternal effects for calving ease (CE) in Portuguese dairy cattle were estimated applying a threshold model (TM) and three linear models (LM) using 320,953 CE records. In LM, CE scores were directly used as dependent variables (LM1) or were transformed into values on an underlying continuous liability scale (average and maximum values for LM2 and LM3, respectively). The estimate of heritability for direct effects was lower on linear models (0.04–0.05) than in TM (0.09). Furthermore, direct heritability was higher than maternal heritability, ranging between 0.04–0.09 and 0.01–0.02, respectively. The genetic correlation between direct and maternal effects was negative in all models, ranging between –0.75 and –0.82. We investigated the association between bulls estimated breeding values (EBV) attained by TM and three LM, for 2223 bulls. Results show that all correlations were higher than 0.95 and slightly greater correlations were observed for direct effects than for maternal effects. Particular emphasis was given to individual differences between EBV ranking lists. The average difference between rank positions of TM and the three LM ranged from 64 to 122. Therefore, the selection of breeding animals is influenced by the model’s choice. Even with clear theoretical advantages in analysing categorical data, perhaps due to its more recent implementation, TM has not yet achieved the popularity of LM. The results of this work show that TM ranking list is more in accordance with LM2 than with LM1 or LM3. Therefore, with linear models, CE should be considered as average liability value instead of usual numerical score or maximum liability.
Introduction
Calving is a key event on dairy cattle productive life and successful births are essential to economic success of the farm. Calving affects animal welfare, with dystocia being ranked as one of the most painful conditions of cows (Huxley and Whay Citation2006; Eaglen and Bijma Citation2009). Calving difficulty affects herd profitability because of increased labour and veterinary costs, increased calf mortality, and reduced subsequent fertility and survival of the cow (Hickey et al. Citation2007). Calving problems such as hard pull assistance, caesarean, fetonomy or abortion increase the infections risk. Consequently, calving-related infections also indirectly affect human health as they require increased use of antibiotics, leading potentially to microbial resistance. Besides, animal welfare is compromised by these calving complications and so consumer acceptability of dairy production systems (Mee Citation2008).
Calving trait phenotypes are affected by two separate components, the calf’s contribution (direct effect; e.g. arising from size, hormonal balance, weight) and the dam’s contribution (maternal effect; e.g. arising from pelvic measurements, ability to respond to parturition signalling) (Eaglen et al. Citation2012; Vanderick et al. Citation2014). Calving ease (CE) measures the presence or absence of calving problems and their intensities. This trait is generally scored on a categorical scale by the farmer, what makes it more sensitive to subjectivity (Dekkers Citation1994).
In theory, methods used for analysing continuous data are not suitable for categorical data (Gianola and Foulley Citation1983; Ramirez-Valverde et al. Citation2001; Hansen et al. Citation2004). Gianola and Foulley (Citation1983) developed the threshold model (TM) for genetic evaluation of categorical traits. The TM takes into account the asymmetry and extreme incidence of some categories. However, in several studies, preference was given to the use of linear models (Carnier et al. Citation2000; Eaglen and Bijma Citation2009). The purpose of this research was to estimate variance components and genetic parameters for CE using TM and three linear models (LM) and to compare breeding values ranking lists achieved from the two methodologies.
Materials and methods
Data
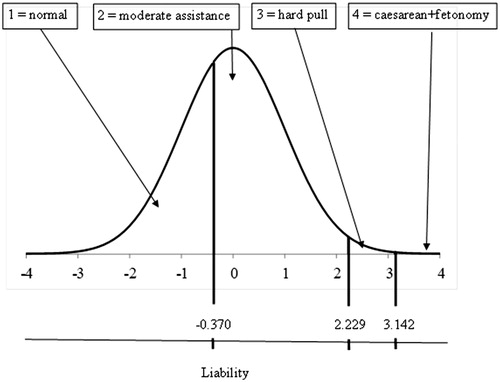
A data set consisting of 990,026 CE records was provided by ANABLE (Associação Nacional para o Melhoramento dos Bovinos Leiteiros). CE data are routinely recorded by farmers and scoring was conducted according to a 6-grade scale: 1 = normal (not assisted), 2 = moderate assistance, 3 = hard pull, 4 = caesarean, 5 = fetonomy, 6 = abortion. Hence, higher scores indicate greater calving difficulty, although the trait usually is referred to as calving ease rather than calving difficulty (Eaglen and Bijma Citation2009). For this study, the number of classes is reduced to 4. This is done by adding score 5 to 4 and discarding score 6. From the original data set, twin calving’s were discarded and both parents must be known. Only records from cows that had calved between 20 and 39 mo., 30 and 59 mo., 43 and 75, 56 and 92 mo., 69 and 108 mo. in the first, second, third, fourth and fifth parities, respectively, were used. Cows outside these ages were relatively few, and those cows may have had an error in their parity record. Farmers CE classification was checked for inconsistencies. A total of 65 herds were excluded because farmers put all scores in the same category. After editing, the data consisted of 320,953 records originating from 1595 herds. Table has the frequencies of each class of calving ease. Pedigree data were extracted from the database used for the official Portuguese genetic evaluations. The final pedigree file included 465,759 animals of three generations.
Table 1. Distribution of 320,953 calving ease records and dependent variable outcome for linear models LM1, LM2 and LM3.
Models
Linear model
Dependent variable of LM (y) was considered in three approaches. CE scores were directly used as dependent variable (LM1) or are transformed into values on an underlying continuous liability scale (LM2, LM3) (Figure ). This transformation does not make CE scores continuous; it merely alters the differences between scores (Eaglen and Bijma Citation2009).
Figure 1. The underlying continuous liability scale and the discrete observed scores of calving ease.
LM1: y equal to CE scores 1, 2, 3 and 4.
LM2: Truncated normal distribution properties allows attaining average liability value inside truncation intervals (Foulley Citation2000). Let and
be the density and cumulative normal distribution with mean 0 and variance 1, respectively. Average liability for two-sided truncation is given by:
Average liability for one-sided truncation (lower tail), since :
And, average liability for one-sided truncation (upper tail), since and
:
CE scores (1, 2, 3 and 4) were converted into the average liability value corresponding to the observed phenotypic category (Table ). Based on the frequency of each category, the transformed values of categories 1 through 4 were −1.048, 0.537, 2.520 and 3.417, respectively.
LM3: CE scores (1, 2, 3 and 4) were converted into the maximum liability value corresponding to the observed phenotypic category. Based on the frequency of each category, the transformed values of categories 1 through 4 were −0.370, 2.229, 3.142 and 3.719 (Table ). By definition, maximum liability value to CE score 4 is infinite, since = 1. Due to calculus convenience, it was assumed
.
The following LM was assumed when estimating the variance components and the fixed effects for CE:
where yijklmn = CE (score or transformed) on animal n, µ = overall mean, parityi = effect of the ith parity class (1, 2, 3, 4, 5), sexj = effect of the jth sex class (male or female), b1 = regression coefficient, agek = age of the dam k at calving, ysl = effect lth birth season and birth year of calve (58 levels), hym= random effect mth herd and birth year of calve (17 110 levels), an = random direct genetic effect of the nth animal, mn = random maternal genetic effect of the nth animal, and εijklmn = random residual effect. Only classes with six or more observations were considered on ys and hy effects, and hy was considered as random effect to avoid convergence problems (Misztal et al. Citation1989; Vanderick et al. Citation2014). In matrix notation the model can be written as
where y is a vector of CE scores or liability values, b is a vector of fixed effects, h is a vector of random hy effects, a is a vector of direct effects, m is a vector of maternal effects and e is a residual vector. X, Zh, Za and Zm are known incidences matrices linking data with respective effects. The a and m were assumed to follow a multivariate normal distribution with mean 0 and covariance matrix G ⊗ A, where ⊗ indicates the Kronecker product of matrices, and A is the relationship matrix. All the others covariances were assumed to be zero and Var(ε) = Iσε2.
The parameters in the model were estimated by restricted maximum likelihood method using the ASREML software (Gilmour et al. Citation2009).
Threshold model
In the TM, the observed outcome (yijklmn) for CE was assumed to be ordered in four categories. An unknown liability (Uijklmn) was assumed with three unknown thresholds (t = {t1,…,t3}), which categorised the observed outcome:
For reasons of identifiability and without loss of generality, it was assumed that t1 = 0 and t2 = 1. In addition, it was assumed that the liabilities conditional on all of the effects were independent and normally distributed:
The model in matrix notation is similar to the previous one, with the vector of liabilities U instead of y. Variance components and genetic parameters as well as solutions for fixed and random effects in threshold animal mixed models were estimated with THRGIBBS1F90 (Misztal et al. Citation2002), which is a Fortran90 programme using a Bayesian approach via the Gibbs sampling algorithm (Lee et al. Citation2002). After 10,000 Gibbs samples were discarded as burn-in, 40,000 samples were used to calculate the posterior means and SE for variance components, correlations and heritabilities (Smith Citation2005).
Other statistics
The Spearman’s rank correlation coefficient (rs) was used to evaluate the association between estimated breeding values (EBV) attained by TM and linear models (LM1, LM2, LM3). In this analysis, it was considered only bulls with progeny higher than 15, born in at least 5 farms. Spearman’s rank correlation considers ranked EBV, rather than the EBV itself. Descriptive statistics based on absolute values of the ranking position differences were also applied in order to quantify individual differences in ranking positions.
Results and discussion
Almost 99% of births were classified on scores 1 or 2 and score 2 has the highest frequency (Table ). Similar CE distribution has been reported by Eaglen and Bijma (Citation2009). However, in other studies, the score with the highest frequency was score 1 (Wiggans et al. Citation2003; Eaglen et al. Citation2013). Differences between authors in CE classes’ definition can contribute to those discrepancies. Also, data quality depends highly on dairy farmers’ own judgement to assign scores for calving ease. It is important to sensitise breeders to correctly classify births. For instead, if a farmer put all scores in the same category, this is an evidence of bad judgement (Vanderick et al. Citation2014).
Variance components and genetic parameter estimates (phenotypic and residual variances, genetic (co)variances and heritability) of CE with TM and LM models are shown in Table . For all models, the additive genetic variance due to direct effects was higher than that due to maternal effects. Furthermore, direct heritability was higher than maternal heritability, ranging between 0.04–0.09 and 0.01–0.02, respectively. Similar outcomes have been reported (Wiggans et al. Citation2003; Eaglen et al. Citation2012; Vanderick et al. Citation2014). The genetic correlation between direct and maternal effects was negative on all models, which is consistent with the literature, but it was superior (in absolute value) to most published results (Hickey et al. Citation2007; Eaglen and Bijma Citation2009). A biological reason for this negative genetic association is that female calves of a small size are likely to be born easily, but as adults they may experience more difficulties in giving birth because of the reduced pelvic opening dimensions (Hickey et al. Citation2007).
Table 2. Genetic parameter estimates of calving ease with linear models (LM1, LM2, LM3) and threshold model (TM).
The estimate of heritability for direct effects was lower in linear models (0.041–0.046) than in TM (0.086). The same tendency was verified with the heritability for maternal effects but with lower scores. As reported by several studies, higher heritabilities are usually expected with threshold models than linear models (Phocas and Laloe Citation2003; Vanderick et al. Citation2014). Accordingly to Vanderick et al. (Citation2014), these heritabilities cannot be directly compared because they were estimated on different scales, on a visible probability scale and on an underlying normal scale for linear and threshold models, respectively. However, since heritability is a variance ratio, the differences in scale are mitigated. Estimated heritabilities obtained in the present study were lower but were within the range of previously published estimates of this trait in dairy cattle, which ranged from 0.03 to 0.17 for direct heritability and from 0.02 to 0.12 for maternal heritability (Weller and Gianola Citation1989; Steinbock et al. Citation2003; Wiggans et al. Citation2003; Lopez de Maturana et al. Citation2007; Eaglen et al. Citation2012).
Breeding values of 2223 bulls with progeny higher than 15, born in at least five farms, were considered for the comparison of genetic ranking lists (Table ). These are the criteria applied in Portugal for publication of genetic evaluations for milk traits. Additionally, with this restriction, only bulls evaluated with higher accuracy were considered. Table shows rs between TM and linear models (LM1, LM2, LM3), for direct and maternal effects. For each one of these comparisons, mean, median, first and third quartile of the absolute values of the rankings’ position differences is also shown. All correlations were higher than 0.95 and slightly greater correlations were observed for direct effects than for maternal effects (Table ). Vanderick et al. (Citation2014) reported Spearman’s rank correlations between sire breeding values from TM and LM of 0.972 and 0.971 for direct and maternal CE breeding values, respectively, indicating a good agreement between ranking of sires attained with both methodologies. Correlations between EBV of TM and LM have been found in other categorical traits such as calf mortality (0.97), stillbirth (0.96 to 0.99) and clinical mastitis (>0.99) (Hagger and Hofer Citation1990; Heringstad et al. Citation2003; Hansen et al. Citation2004). Analyses of individual differences between models in rankings’ positions are useful to understand the influence of model choice in bulls selection. Considering only results for direct effects given in Table , all the presented statistics (mean, median, first and third quartile) are better for LM2 than for LM1 or LM3. For instance, the average difference between rank positions of TM and LM2 is 64 and 50% of the EBV differ in less than 46 positions (median). Worst scores were found for LM3, since the average difference between rank positions of TM and LM3 is 122 and 50% of the EBV differ in less than 83 positions. Also for maternal effects, results of Table show that TM ranking list is more in accordance with LM2 than with LM1 or LM3.
Table 3. Comparison of estimated breeding values ranking lists between threshold model and linear models (LM1, LM2, LM3) for direct and maternal effects (n = 2223).
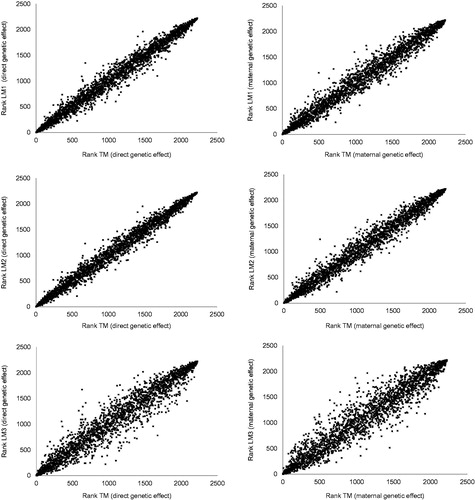
Bivariate plots of bull rankings between TM and linear models (LM1, LM2, LM3) for direct and maternal genetic effects are shown in Figure . This graphical representation sustains that there is a linear relation between EBV ranking lists attained with TM and linear models (LM1, LM2, LM3). Also, plots of direct and maternal genetic effects for LM3 shows higher dot dispersion than plots for linear models LM1 and LM2. Results showed on Table and Figure allow to conclude that the best and the worst agreement of breeding values ranking lists between TM and linear models are attained with LM2 and LM3, respectively.
Figure 2. Bivariate plots of bull rankings between threshold model (TM) and linear models (LM1, LM2, LM3) for direct and maternal genetic effects.
The pedigree file used in this work has 465,759 animals (bulls and cows) but comparisons between EBV ranking lists were made considering only bulls with higher accuracy, reproducers or candidate to be reproducers. Therefore, and from an individual point of view, it must be emphasised that 50% of the bulls occupied positions in the ranking lists for TM and LM2 (best agreement) with differences between 20 and 92. Worst results were attained with LM1 and LM3. Consequently, those individual ranking differences will have practical consequences in the reproducers selection.
Previous research has treated CE as categorical data, with threshold models or as a continuous trait with linear models. When linear models are applied, usually, CE scores are directly used as phenotypes (Carnier et al. Citation2000; Gutie´rrez et al. Citation2007; Cervantes et al. Citation2010). This is possible because CE is conveniently classified on a numerical category scale. To better account for the categorical nature of the CE scores, more recently studies transform the recorded CE scores into the average liability value corresponding to the observed phenotypic category (Eaglen and Bijma Citation2009; Eaglen et al. Citation2012). Additionally, this work considers CE classes as the maximum liability value corresponding to the observed phenotypic category (LM3). There are no previous studies considering simultaneously all these approaches. Considering the categorical nature of the CE, from a theoretical point of view, application of a TM is the correct choice (Gianola Citation1982), whereas, from a practical point of view, LM is a more easily applicable choice (Varona et al. Citation1999; Ramirez-Valverde et al. Citation2001; Phocas and Laloe Citation2003). It should also be taken into account that the use of threshold models significantly increases the computational effort (Gutie´rrez et al. Citation2007). Additionally, use of CE scores or transformed CE scores in LM influences genetic evaluation and could have practical impact in reproducers selection
Advantages of threshold over linear models have been reported with simulated data (Meijering and Gianola Citation1985; Hoeschele Citation1988). However, variable results have been found using field data. Similar performance of threshold and linear models (Weller et al. Citation1988; Matos et al. Citation1997) and advantages of linear over threshold models (Carlen et al. Citation2006) have been reported. Varona et al. (Citation1999), using only data from large herds and the animal model, showed no advantage of univariate threshold over linear models for CE.
Conclusions
LM can be viewed as approximations in comparison to TM for categorical data. Even with clear theoretical advantages in analysing categorical data, perhaps due to its more recent implementation, TM has not yet achieved the popularity of LM. The estimate of heritability for direct effects was lower on linear models (0.04–0.05) than in TM (0.09). Furthermore, use of CE scores or transformed CE scores in LM influences genetic evaluation and could have practical impact in reproducers selection.
The results of this work show that TM ranking list is more in accordance with LM2 than with LM1 or LM3. Therefore, with linear models, CE should be considered as average liability value instead of usual numerical score or maximum liability.
Acknowledgements
The authors thank the Portuguese Breeder Association ANABLE (Associação Nacional para o Melhoramento dos Bovinos Leiteiros) for providing field data and pedigree information.
Disclosure statement
No potential conflict of interest was reported by the authors.
References
- Carlen E, Emanuelson U, Strandberg E. 2006. Genetic evaluation of mastitis in dairy cattle using linear models, threshold models, and survival analysis: a simulation study. J Dairy Sci. 89:4049–4057.
- Carnier P, Albera A, Dal Zotto R, Groen AF, Bona M, Bittante G. 2000. Genetic parameters for direct and maternal calving ability over parities in Piedmontese cattle. J Anim Sci. 78:2532–2539.
- Cervantes I, Gutierrez JP, Fernandez I, Goyache F. 2010. Genetic relationships among calving ease, gestation length, and calf survival to weaning in the Asturiana de los Valles beef cattle breed. J Anim Sci. 88:96–101.
- Dekkers JC. 1994. Optimal breeding strategies for calving ease. J Dairy Sci. 77:3441–3453.
- Eaglen SA, Bijma P. 2009. Genetic parameters of direct and maternal effects for calving ease in Dutch Holstein-Friesian cattle. J Dairy Sci. 92:2229–2237.
- Eaglen SA, Coffey MP, Woolliams JA, Wall E. 2012. Evaluating alternate models to estimate genetic parameters of calving traits in United Kingdom Holstein-Friesian dairy cattle. Genet Select Evol. 44:23.
- Eaglen SA, Coffey MP, Woolliams JA, Wall E. 2013. Direct and maternal genetic relationships between calving ease, gestation length, milk production, fertility, type, and lifespan of Holstein-Friesian primiparous cows. J Dairy Sci. 96:4015–4025.
- Foulley JL. 2000. A completion simulator for the two-sided truncated normal distribution. Genet Select Evol. 32:631–635.
- Gianola D. 1982. Theory and analysis of threshold characters. J Anim Sci. 54:1079–1096.
- Gianola D, Foulley J. 1983. Sire evaluation for ordered categorical data with a threshold model. Genet Sel Evol. 15:201–224.
- Gilmour AR, Gogel BJ, Cullis BR, Thompson R. 2009. ASReml User Guide Release 3.0. VSN International Ltd, Hemel Hempstead, HP1 1ES, UK.
- Gutie´rrez JP, Goyache F, Ferna´ndez I, Alvarez I, Royo LJ. 2007. Genetic relationships among calving ease, calving interval, birth weight, and weaning weight in the Asturiana de los Valles beef cattle breed. J Anim Sci. 85:69–75.
- Hagger C, Hofer A. 1990. Genetic analyses of calving traits in the swiss black and white, braunvieh and simmental breeds by REML and MAPP procedures. Livest Prod Sci. 24:93–107.
- Hansen M, Misztal I, Lund MS, Pedersen J, Christensen LG. 2004. Undesired phenotypic and genetic trend for stillbirth in Danish Holsteins. J Dairy Sci. 87:1477–1486.
- Heringstad B, Rekaya R, Glanola D, Klemetsdal G, Welgel KA. 2003. Genetic change for clinical mastitis in Norwegian cattle: a threshold model analysis. J Dairy Sci. 86:369–375.
- Hickey JM, Keane MG, Kenny DA, Cromie AR, Amer PR, Veerkamp RF. 2007. Heterogeneity of genetic parameters for calving difficulty in Holstein heifers in Ireland. J Dairy Sci. 90:3900–3908.
- Hoeschele J. 1988. Comparison of “Maximum A-Posteriori Estimation” and “Quasi Best Linear Unbiased Prediction” with threshold characters. J Anim Breed Genet. 105:337.
- Huxley JN, Whay HR. 2006. Current attitudes of cattle practitioners to pain and the use of analgesics in cattle. Vet. Rec. 159:662–668.
- Lee D, Misztal I, Bertrand JK, Rekaya R. 2002. National evaluation for calving ease, gestation length and birth weight by linear and threshold model methodologies. J Appl Genet. 43:209–216.
- Lopez de Maturana E, Legarra A, Varona L, Ugarte E. 2007. Analysis of fertility and dystocia in Holsteins using recursive models to handle censored and categorical data. J Dairy Sci. 90:2012–2024.
- Matos CA, Thomas DL, Gianola D, Perez-Enciso M, Young LD. 1997. Genetic analysis of discrete reproductive traits in sheep using linear and nonlinear models: II. Goodness of fit and predictive ability. J Anim Sci. 75:88–94.
- Mee JF. 2008. Prevalence and risk factors for dystocia in dairy cattle: a review. Vet J. 176:93–101.
- Meijering A, Gianola D. 1985. Linear versus nonlinear methods of sire evaluation for categorical traits: a simulation study. Genet Select Evol. 17:115–132.
- Misztal I, Gianola D, Foulley JL. 1989. Computing aspects of a nonlinear method of sire evaluation for categorical data. J Dairy Sci. 72:1557–1568.
- Misztal I, Tsuruta S, Strabel T, Auvray B, Druet T, Lee DH 2002. BLUPF90 and related programs (BGF90). Commun. No. 28–07 in Proc. 7th World Congress on Genetics Applied to Livestock Production, Montpellier, France.
- Phocas F, Laloe D. 2003. Evaluation models and genetic parameters for calving difficulty in beef cattle. J Anim Sci. 81:933–938.
- Ramirez-Valverde R, Misztal I, Bertrand JK. 2001. Comparison of threshold vs linear and animal vs sire models for predicting direct and maternal genetic effects on calving difficulty in beef cattle. J Anim Sci. 79:333–338.
- Smith BJ. 2005. Bayesian output analysis program (BOA). [Accessed 2015 October 24]. Version 1.1.5 http://www.public-health.uiowa.edu/boa.
- Steinbock L, Nasholm A, Berglund B, Johansson K, Philipsson J. 2003. Genetic effects on stillbirth and calving difficulty in Swedish Holsteins at first and second calving. J Dairy Sci. 86:2228–2235.
- Vanderick S, Troch T, Gillon A, Glorieux G, Gengler N. 2014. Genetic parameters for direct and maternal calving ease in Walloon dairy cattle based on linear and threshold models. J. Anim. Breed. Genet. 131:513–521.
- Varona L, Misztal I, Bertrand JK. 1999. Threshold-linear versus linear-linear analysis of birth weight and calving ease using an animal model: II. Comparison of models. J Anim Sci. 77:2003–2007.
- Weller JI, Gianola D. 1989. Models for genetic analysis of dystocia and calf mortality. J Dairy Sci. 72:2633–2643.
- Weller JI, Misztal I, Gianola D. 1988. Genetic analysis of dystocia and calf mortality in Israeli-Holsteins by threshold and linear models. J Dairy Sci. 71:2491–2501.
- Wiggans GR, Misztal I, Van Tassell CP. 2003. Calving ease (Co)variance components for a sire-maternal grandsire threshold model. J Dairy Sci. 86:1845–1848.