
 ?Mathematical formulae have been encoded as MathML and are displayed in this HTML version using MathJax in order to improve their display. Uncheck the box to turn MathJax off. This feature requires Javascript. Click on a formula to zoom.
Abstract
Agri-food waste (AFW) and by-products represent sources of phytochemicals, such as phenols and antioxidant compounds that can be used as functional ingredients in animal feed. In this study, a selection of AFW and by-products were collected and analysed for their nutrient composition. After chemical (with methanol) and physiological (in vitro digestion) extraction, total phenolic content and antioxidant capacity (AOC) were determined in AFW and by-product samples using Folin–Ciocalteu and 2,2′-azinobis(3-ethylbenzothiazoline 6-sulfonic acid)-ABTS methods, respectively. Sample digestibility was also assessed using a multi-step enzymatic technique. After chemical extraction, grape marc showed the highest total phenolic content (4480.5 ± 886.58 mg TAE/100g; p < .05). Fruit and vegetable waste (FVW), orange peel, strawberry, citrus pulp and Camelina sativa cake showed a total phenolic content ranging from 238.0 ± 4.24 to 1583.0 ± 154.35 mg TAE/100g. Grape marc also showed the highest AOC (15440.7 ± 2671.85 mg TE/100g). In all other samples, AOC ranged from 43.3 ± 3.17 to 1703.9 ± 391.07 mg TE/100g. After physiological extraction, total phenolic content values higher than 3000 mg TAE/100g were observed in FVW, grape marc and orange peel. Grape marc, C. sativa cake and orange peel had AOC values of over 5000 mg TE/100g. The digestibility of AFW and by-products ranged from 44.20 to 97.16%. The lowest digestibility value was observed in grape marc (44.2 ± 2.31%). In conclusion, the results obtained in this study indicate that AFW and by-products could be a source of bioaccessible phenols and antioxidant molecules as ingredients for monogastric compound feeds.
Agri-food waste and by-products can be reused in feed industry.
Agri-food waste and by-products are a source of valuable compounds as phenols and antioxidant molecules.
Highlights
Introduction
The global volume of food wastage is estimated at 1.6 billion tons of ‘primary product equivalents’ and its edible part is roughly 1.3 billion tons (Gustafsson et al. Citation2013). Food waste has considerable economic and environmental implications: not only does it represent a wasted investment, but it also has a negative environmental impact, due to the greenhouse gas emissions and inefficient use of water and land, which in turn can lead to diminished natural ecosystems (Lipinski et al. Citation2013).
Food waste is generated throughout the entire food life cycle: from agriculture to industrial manufacturing and pro.cessing, in retail and households (Mirabella et al. Citation2014). Agri-food waste (AFW) and by-products provide a high potential source of bioactive compounds, such as phenols and antioxidants, which could be exploited in the pharmaceutical, cosmetic, and food industries and used as functional ingredients in animal feeds (Fontana et al. Citation2013). The use of AFW or by-products, such as animal feeds, is already traditional practice in animal husbandry (Bampidis and Robinson Citation2006); however, the bioactive potential in feed has not been fully elucidated.
Fruit and vegetable by-products are notably rich in antioxidant phenols (Balasundram et al. Citation2006; Peschel et al. Citation2006), such as anthocyanin and flavonoids (Croft Citation2016). The enrichment of animal diets with phenolic compounds may have beneficial effects on animal gut health, including anti-inflammatory and antimicrobial activity along with their antioxidant capacity (Ignat et al. Citation2011).
Several studies have focussed on the quantification of the total phenolic and antioxidant compounds in fruits and vegetables (Ignat et al. Citation2011; Pastoriza et al. Citation2011) using different extraction methods. Chemical extraction is widely used (Pastoriza et al. Citation2011; Attard Citation2013) which enables the extraction of a high amount of total phenolic and antioxidant compounds. From a physiological point of view, however, the bio-accessibility of phenolic compounds and antioxidants depends on their release from the food and feed matrix during the digestive process.
In this study, AFW and by-product samples were analysed in order to assess the total phenolic content and antioxidant capacity. In particular, chemical (with methanol) and physiological (in vitro digestion) extractions were performed in order to evaluate the potential bioaccessibility of phenols and antioxidant molecules in monogastric compound feed.
Materials and methods
AFW and by-products, including fruit and vegetable waste (FVW), Citrus sinensis L. (orange peel), Fragaria ssp. (strawberries), citrus pulp, Vitis vinifera L. (grape marc), Camelina sativa (L.) Crantz cake (Camelina sativa cake) and whey, were collected three times (n = 21) over a one-year period (2016/2017), according to product seasonality. Camelina sativa cake and whey were provided by commercial suppliers. Oranges, strawberries and grape marc were freshly collected from a local market and a winery, respectively, situated in northern Italy, and subsequently dried and ground (1mm sieve). Citrus pulp and FVW were provided by the University of Messina and their composition is reported in Chiofalo et al. (Citation2014).
The FVW sample contained different types of vegetables and fruits including: tomato (Solanum lycopersicum L.), fennel (Foeniculum vulgare L.), pepper (Capsicum annuum L.), eggplant (Solanum melongena L.), courgettes (Cucurbita pepo L.), potato (Solanum tuberosum L.), onion (Allium cepa L.), lettuce (Lactuca sativa L.), cauliflower (Brassica ssp.), mushroom (Agaricus bisporus, Pleurotus ostreatus), pear (Pyrus communis L.), apple (Malus domestica), banana (Musa spp.), orange (Citrus sinensis L.), strawberry (Fragaria ssp.), kiwi (Actinidia chinensis) and pineapple (Ananas comosus L.). The chemical analysis of the samples was performed following official methods (AOAC Citation2005; European Commission regulation Citation2009) and the fibre fractions were analytically determined according to Van Soest et al. (Citation1991), using heat-stable α-amylase. Gross energy (GE) values were estimated according to Hoffman and Schiemann’s equation (Citation1980).
Each sample was weighed (5 ± 0.5 g), mixed with 30 mL methanol (100%) for 48 hours at room temperature (RT) and subsequently, filtered with filter paper (Whatman 54, Florham Park, NJ). Chemical extracts were tested for total phenolic compounds and antioxidant capacity, as detailed below.
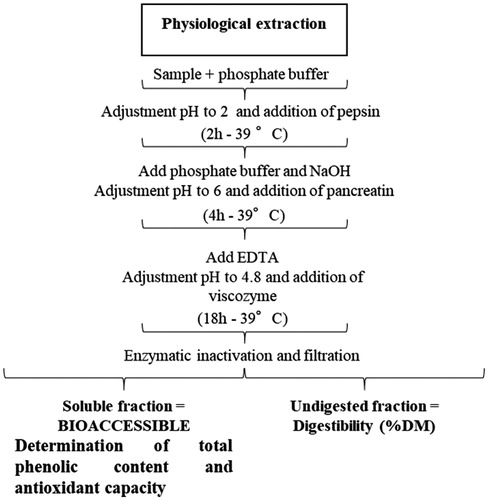
In parallel, the in vitro digestion was performed according to the protocol described by Regmi et al. (Citation2009) with minor adaptations reported by Giromini et al. (Citation2017a) (Figure ). At the end of the in vitro digestion, a soluble fraction and an undigested fraction (UF) were obtained. The soluble fraction was used to quantify the phenol content and the antioxidant capacity (detailed below). The UF was then collected in a filtration unit using a porcelain filtration funnel lined with pre-weighed filter paper (Whatman no. 54). The UF, along with the filter paper, were dried overnight at 65 °C. The UF was used to calculate the in vitro digestibility (EquationEquation 1(1)
(1) ):
(1)
(1)
Figure 1. Graphical representation of physiological extraction.
In addition, total phenolic compounds were assayed according to the Folin–Ciocalteu method (Attard Citation2013). The total phenolic content was expressed as tannic acid equivalents (mg TAE/100g).
The anthocyanin content was measured in triplicate in each chemical extract according to Theuma et al. (Citation2015) and calculated as follows (EquationEquation 2(2)
(2) ):
(2)
(2)
The antioxidant capacity (AOC) was measured following Re et al. (Citation1999). AOC results are expressed as mg Trolox equivalent (TE)/100g sample.
All samples were prepared and analysed in triplicate. The data from total phenolic content and AOC were analysed through one-way analysis of variance (ANOVA) using GLM procedure of SAS (SAS, 9.3 version, Cary, NC). Results are expressed as mean ± standard deviation. Data were analysed using Shapiro–Wilk test to evaluate the normality of sample distribution. The Pearson correlation coefficient (r) and probability-value (p) were used to show correlation and their significance by using SPSS software, Version 24. Chicago, IL: SPSS Inc; 2002. A probability value of p < .05 was considered statistically significant.
Results and discussion
The total phenolic content and AOC of the various AFW and by-product matrixes were analysed in order to assess their use in the animal feed sector. Exploiting AFW and by-products plays an important role in the production of high value functional feed ingredients along with socio-economic and environmental sustainability, according to the circular economy strategy (Mirabella et al. Citation2014) and according to the ‘biorefinery’ approach where value-added molecules are recovered from waste biomass (Di Donato et al. Citation2017; Rodríguez‐González et al. Citation2018). The nutrient composition and gross energy content of AFW and by-products are reported in Table .
Table 1. Chemical composition of AFW and by-products (% w/w on DM basis).
Our results confirm that C. sativa cake and whey represent valuable protein sources. As for the lipid content, grape marc and C. sativa cake had the highest values in terms of ether extract (EE) compared to the other samples. Overall, our results confirm notable amounts of nutrients in the AFW and by-products with a high potential for feeding animals.
Table shows the total phenolic content, AOC and anthocyanin content of AFW and by-products after chemical extraction. In particular, the highest total phenolic content was found in grape marc (4480.5 ± 886.58 mg TAE/100g; p < .05). The total phenolic content of FVW, orange peel, strawberry, citrus pulp and C. sativa cake ranged from 238.0 ± 4.24 (C. sativa cake) to 1583.0 ± 154.35 mg TAE/100g (orange peel). Grape marc showed the highest AOC value (15440.7 ± 2671.85 mg TE/100g; p < .05) and a notable amount of anthocyanin compared to all other samples. In all other samples, AOC ranged from 427.2 ± 109.91 (citrus pulp) to 1703.9 ± 391.07 mg TE/100g (orange peel). In the whey sample, the total phenolic content, AOC and anthocyanin content were the lowest detected. The high content of phenols and anthocyanin in grape marc samples are in accordance with those reported by Larrauri et al. (Citation1997). The AOC of grape marc was higher in our study than in data reported by Heng et al. (Citation2017). The total phenolic content of orange peel and citrus pulp was similar to values reported for orange peel extract by Attard (Citation2013) and Tzanakis et al. (Citation2006). Strawberry AOC was at least two-fold higher (1163.8 ± 276.90 mg TE equivalent/100g) than values reported by Özşen and Erge (Citation2013) (568–642 mg TE equivalent/100g) and Gössinger et al. (Citation2009) (530–805 mg TE/100g). The total phenolic content, AOC and anthocyanin content obtained after chemical extraction show a large variability among different studies due to the lack of assay standardisation (Pellegrini et al. Citation2003). As demonstrated by Thomas et al. (Citation2018), the variations in the total phenol content might be due to several factors such as genetic variability, environmental pressure, cultivation techniques, age and maturity of the plants and postharvest treatments.
Table 2. Total phenolic content, antioxidant capacity (AOC) and anthocyanin content of chemical extracts (n = 3) (methanol extraction) from AFW and by-products (mean ± standard deviation).
A positive correlation (r = 0.95, p = .01) was observed between the total phenolic content and AOC in the chemical extracted samples. The anthocyanin content was correlated with the total phenolic content (r = 0.87, p = .01) and with AOC (r = 0.80, p = .01). The positive linear relationships between the total phenolic content and AOC values are in accordance with the results of other authors (Ehlenfeldt and Prior Citation2001; Connor et al. Citation2002) confirming that total phenolic compounds largely contribute to the AOC of AFW and by-products (Dudonné et al. Citation2009).
In vitro digestion (physiological extraction) was performed to evaluate the bioaccessibility of total phenolic and antioxidant compounds in AFW and by-products. The soluble fraction of the digestion was used to measure the phenol content and AOC, and the results are reported in Table . We found that the total phenolic content was significantly high (3000 mg TAE/100g; p < .05) in FVW, grape marc and orange peel, compared with the other samples. The AOC was higher than 5000 mg TE/100g in grape marc, C. sativa cake and orange peel. A high AOC value was also observed in the whey sample (3258.3 ± 215.44 mg TE/100g), compared with the value obtained after chemical extraction, thus suggesting the liberation of antioxidant compounds encrypted in whey proteins. Thus, the AOC of whey mainly depends on the high biological value of bioactive peptides (Giromini et al. Citation2017b) and on the high oligosaccharides and B-vitamin content.
Table 3. Total phenolic content, antioxidant capacity (AOC) and anthocyanin content of physiological extracts (n = 3) (in vitro digestion) from AFW and by-products (mean ± standard deviation).
In addition, the undigested fraction obtained from the physiological extraction (Figure ) was used to calculate the in vitro digestibility. Notably, the digestibility of AFW and by-products showed a mean value of 77.33%. The highest digestibility was observed in whey (97.2 ± 1.60% DM), while the lowest (44.2 ± 2.30% DM) was reported for grape marc (Table ).
The in vitro digestion protocol exploited in the present study had previously been used to test the monogastric digestibility of feeds, showing a great correlation with the in vivo digestibility values (Regmi et al. Citation2009). The feed bioaccessibility corresponds to the feed portion effectively released from the matrix and available for intestinal absorption. The application of in vitro digestion to AFW and by-products enables the physiological bio-accessible phenols and antioxidant compounds to be studied in more depth in soluble fractions. However, the UF obtained may still contain bioactive components (Chen et al. Citation2014) which may play an essential role at the gut level (e.g. intestinal epithelial cells, microbiota).
In our study, total phenolic content and AOC values were higher in the physiological than in the chemical extracts. This suggests that digestion can enhance their bioaccessibility, except for grape marc in which the phenols and antioxidant molecules were lower in the physiological than the chemical extracts. The latter aspect is related to the low digestibility observed in grape marc (44% DM, Table ) which may have negatively affected the liberation of phenols and the AOC, although no overall correlation was observed (p > .05). This aspect, however, needs further investigation, using an improved protocol to simulate the in vitro digestion and assess the digestibility of the grape marc, also taking into consideration the relatively high lipid content of the sample. From an application point of view, dietary supplementation with enzyme-based additives could be a valid technique to improve the bioaccessibility of phenols and antioxidant molecules of AFW and by-products and to implement their use in animal nutrition (Chamorro et al. Citation2015).
Other aspects related to data application in animal nutrition should also be considered, i.e. palatability, stability, storage conditions and food safety issues such as the risk of mycotoxin contamination in AFW and by-products.
Conclusions
This study contributes to the current knowledge on the functional role of agri-food waste and by-products in the diet of monogastric animals. The results indicate that agri-food waste and by-products are a good source of phenols and antioxidant molecules. Further issues, however, need to be considered when using agri-food waste and by-products in feed formulations. The highly variable chemical composition, along with the storage and processing conditions need to be correctly addressed in order to guarantee the stability of the bioactive components in agri-food waste and by-products.
Overall, the reuse of agri-food waste and by-products as functional ingredients in animal feed is crucial, not only because it reduces the costs of disposal costs and the amount of food waste, but also because of the promising potential as functional feed ingredients.
Acknowledgements
The authors would like to thank Professor Vincenzo Chiofalo, University of Messina (Italy).
Disclosure statement
No potential conflict of interest was reported by the authors.
Additional information
Funding
References
- AOAC. 2005. Official methods of analysis. 18th edition. Gaithersburg, MD, USA: AOAC Int.
- Attard E. 2013. A rapid microtitre plate Folin-Ciocalteu method for the assessment of polyphenols. Open Life Sci. 8:48–53.
- Balasundram N, Sundram K, Samman S. 2006. Phenolic compounds in plants and agri-industrial by-products: antioxidant activity, occurrence, and potential uses. Food Chem. 99:191–203.
- Bampidis PH, Robinson PH. 2006. Citrus by-products as ruminant feeds: a review. Anim Feed Sci. 128:175–217.
- Chamorro S, Viveros A, Rebolé A, Rica BD, Arija I, Brenes A. 2015. Influence of dietary enzyme addition on polyphenol utilization and meat lipid oxidation of chicks fed grape pomace. Food Res Int. 73:197–203.
- Chen GL, Chen SG, Zhao YY, Luo CX, Li J, Gao YQ. 2014. Total phenolic contents of 33 fruits and their antioxidant capacities before and after in vitro digestion. Ind Crops Prod. 57:150–157.
- Chiofalo V, Carcione G, D’Agata A, D’Angelo G, Fiumanò R, Magazzù G, Margiotta A, Pagliaro M, Spanò G. 2014. Fruit and vegetable waste: physico-chemical and nutritional characterization for utilization in animal feeding. Food Tech Congress, Novi Sad, Serbia. XVI International Symposium Feed Technology. Abstract Book. p. 50.
- Connor AM, Luby JJ, Tong CBS, Finn CE, Hancock JF. 2002. Genotypic and environmental variation in antioxidant activity, total phenolic contents, and anthocyanin content among blueberry cultivars. J Am Soc Hort Sci. 127:89–97.
- Croft KD. 2016. Dietary polyphenols: antioxidants or not? Arch Biochem Biophys. 595:120–124.
- Di Donato P, Taurisano V, Tommonaro G, Pasquale V, Jiménez JMS, De Pascual-Teresa S, Nicolaus B. 2018. Biological properties of polyphenols extracts from agro industry’s wastes. Waste Biomass Valor. 9:1567–1578.
- Dudonné S, Vitrac X, Coutiere P, Woillez M, Mérillon JM. 2009. Comparative study of antioxidant properties and total phenolic content of 30 plant extracts of industrial interest using DPPH, ABTS, FRAP, SOD, and ORAC assays. J Agric Food Chem. 57:1768–1774.
- Ehlenfeldt MK, Prior RL. 2001. Oxygen radical absorbance capacity (ORAC) and phenolic and anthocyanin concentrations in fruit and leaf tissues of highbush blueberry. J Agric Food Chem. 49:2222–2227.
- European Commission, Commission Regulation (EC). 2009. No 152/2009 of 27 January 2009 laying down the methods of sampling and analysis for the official control of feed establishes the sampling method and the methods of analysis of feed for control purposes. European Union. Off J Eur Union. 2009, L54, 1–130.
- Fontana AR, Antoniolli A, Bottini R. 2013. Grape pomace as a sustainable source of bioactive compounds: extraction, characterization, and biotechnological applications of phenolics. J Agric Food Chem. 61:8987–9003.
- Giromini C, Fekete ÁA, Givens DI, Baldi A, Lovegrove JA. 2017. Short-communication: a comparison of the in vitro angiotensin-1-converting enzyme inhibitory capacity of dairy and plant protein supplements. Nutrients. 9:1352.
- Giromini C, Ottoboni M, Tretola M, Marchis D, Gottardo D, Caprarulo V, Baldi A, Pinotti L. 2017a. Nutritional evaluation of former food products (ex-food) intended for pig nutrition. Food Addit Contam: Part A. 34:1436–1445.
- Gössinger M, Moritz S, Hermes M, Wendelin S, Scherbichler H, Halbwirth H, Stich K, Berghofer E. 2009. Effects of processing parameters on colour stability of strawberry nectar from puree. J Food Eng. 90:171–178.
- Gustafsson J, Cederberg C, Sonesson U, Emanuelsson A. 2013. The methodology of the FAO study: global food losses and food waste-extent, causes and prevention”-FAO, 2011. SIK The Swedish Institute for Food and Biotechnology, SIK report No. 857.
- Heng MY, Katayama S, Mitani T, Ong ES, Nakamura S. 2017. Solventless extraction methods for immature fruits: evaluation of their antioxidant and cytoprotective activities. Food Chem. 221:1388–1393.
- Hoffman H, Schiemann R. 1980. Von der Kalorie zum Joule: Neue Größenbeziehungen bei Messungen des Energieumsatzes und bei der Berechnung von Kennzahlen der energetischen Futterbewertung. Archiv Animal Nutr. 30:733–742.
- Ignat I, Volf I, Popa VI. 2011. A critical review of methods for characterisation of polyphenolic compounds in fruits and vegetables. Food Chem. 126:1821–1835.
- Larrauri JA, Rupérez P, Saura-Calixto F. 1997. Effect of drying temperature on the stability of polyphenols and antioxidant activity of red grape pomace peels. J Agric Food Chem. 45:1390–1393.
- Lipinski B, Hanson C, Lomax J, Kitinoja L, Waite R, Searchinger T. 2013. “Reducing Food Loss and Waste.” Working Paper, Installment 2 of Creating a Sustainable Food Future. Washington, DC: World Resources Institute. Available online at http://www.worldresourcesreport.org.
- Mirabella N, Castellani V, Sala S. 2014. Current options for the valorization of food manufacturing waste: a review. J Clean Prod. 65:28–41.
- Özşen D, Erge HS. 2013. Degradation kinetics of bioactive compounds and change in the antioxidant activity of wild strawberry (Fragaria vesca) pulp during heating. Food Bioprocess Tech. 6:2261–2267.
- Pastoriza S, Delgado-Andrade C, Haro A, Rufián-Henares JA. 2011. A physiologic approach to test the global antioxidant response of foods. The GAR method. Food Chem. 129:1926–1932.
- Pellegrini N, Serafini M, Colombi B, Del Rio D, Salvatore S, Bianchi M, Brighenti F. 2003. Total antioxidant capacity of plant foods, beverages and oils consumed in Italy assessed by three different in vitro assays. J Nutr. 133:2812–2819.
- Peschel W, Sánchez-Rabaneda F, Diekmann W, Plescher A, Gartzía I, Jiménez D, Lamuela-Raventós R, Buxaderas S, Codina C. 2006. An industrial approach in the search of natural antioxidants from vegetable and fruit wastes. Food Chem. 97:137–150.
- Re R, Pellegrini N, Proteggente A, Pannala A, Yang M, Rice-Evans C. 1999. Antioxidant activity applying an improved ABTS radical cation decolorization assay. Free Radic Biol Med. 26:1231–1237.
- Regmi PR, Ferguson NS, Zijlstra RT. 2009. In vitro digestibility techniques to predict apparent total tract energy digestibility of wheat in grower pigs. J Anim Sci. 87:3620–3629.
- Rodríguez‐González S, Pérez‐Ramírez IF, Castaño‐Tostado E, Amaya‐Llano S, Rodríguez‐García ME, ReynosoCamacho R. 2018. Improvement of physico‐chemical properties and phenolic compounds bioavailability by concentrating dietary fiber of peach (Prunus persica) juice by‐product. J Sci Food Agr. 98:3109–3118.
- Theuma M, Gambin C, Attard E. 2015. Physicochemical characteristics of the maltese grapevine varieties–gellewza and girgentina. J Agric Sci. 7:61.
- Thomas M, Badr A, Desjardins Y, Gosselin A, Angers P. 2018. Characterization of industrial broccoli discards (Brassica oleracea var. italica) for their glucosinolate, polyphenol and flavonoid contents using UPLC MS/MS and spectrophotometric methods. Food Chem. 245:1204–1211.
- Tzanakis E, Kalogeropoulos TH, Tzimas ST, Chatzilazarou A, Katsoyannos E. 2006. Phenols and antioxidant activity of apple, quince, pomegranate, bitter orange and almond-leaved pear methanolic extracts. e-JST. 1:16–28.
- Van Soest PJ, Robertson JB, Lewis BA. 1991. Methods for dietary fiber, neutral detergent fiber, and nonstarch polysaccharides in relation to animal nutrition. J Dairy Sci. 74:3583–3597.