
Abstract
This study examines the relationship between efficiency, energy balance and related traits like milk yield, feed intake (DMI), body weight and body condition score (BCS). Data was derived in the project ‘Efficient Cow’ to develop efficiency traits for Austrian cattle breeding (6105 cows, 161 farms, one-year data collection). The following efficiency traits were considered: body weight efficiency as ratio between energy corrected milk (ECM) to metabolic body weight, feed efficiency (kg ECM per kg DMI) and energy efficiency expressed as ratio between energy in milk to energy intake. The higher the proportion of Red Holstein (RH) in Fleckvieh (FV), the more (efficiently) milk was produced, but also at the expenses of body fat reserves. The negative energy state of Holstein Friesian (HF) and the FV groups with highest RH proportion lasted approximately twice as long as of the least efficient Brown Swiss. All genotypes regained lost body tissue during whole lactation. The high yielding groups required a higher concentrate proportion in late lactation to regain body condition. In early lactation, high efficiency was accompanied by the loss of body weight and BCS. Body condition stagnated longer on the lowest level and was more conform to energy balance than body weight. In conclusion, high efficiency required an increasing partitioning of nutrients to milk yield inclusive mobilisation. Breeding for higher efficiency would exacerbate catabolic state including problems with health and fertility. This highlights the necessity of a broader definition of efficiency in cattle breeding involving parameters like BCS, health and fertility traits.
HIGHLIGHTS
In early lactation, high efficiency co-occurs with loss of body weight and body condition score
Breeding for higher efficiency exacerbates body tissue mobilisation and negative energy balance
A broader definition of efficiency involving parameters like body condition score, health and fertility traits is necessary in cattle breeding
Introduction
In Austria, average milk yield per lactation steadily increased to 7281 kg in 2015. It has thus more than doubled since 1950 when the lactation yield was 2998 kg (ZAR Citation2016). The main breed for dairy production is Fleckvieh (FV, dual-purpose Simmental) with 73.3% of performance recorded cows, followed by Brown Swiss (BS) and Holstein Friesian (HF) with 12.0 and 11.7% (ZAR Citation2016). Over the last few decades, dairy production has become more specialised and intensive along with high genetic gain and higher concentrate proportions in diets (Knaus Citation2016; ZuchtData Citation2016). Due to the high economic impact of feed costs (de Haas et al. Citation2014), efficiency and efficiency related traits (e.g. milk production, feed intake, body condition score, body weight or reproduction traits) have recently gained in importance in the dairy industry (e.g. Veerkamp and Emmans Citation1995; Pryce et al. Citation2001). Veerkamp and Emmans (Citation1995) identified feed intake capacity, milk yield, the extent of body tissue mobilisation and energy partitioning between milk and body as main sources of genetic variation in energy efficiency. The increase in milk yield, as it occurred in many countries, would therefore automatically lead to higher efficiency, except cows would become larger and heavier as reported by Hansen (Citation2000). But, breeding for efficiency may also prefer light cows with high mobilisation (e.g. Vallimont et al. Citation2011). Furthermore, high yielding dairy cows tend to produce milk more efficiently because they partition more energy to milk performance instead of their body reserves (Veerkamp and Emmans Citation1995; Yan et al. Citation2006). Energy partitioning via somatotropic axis for maintaining the homeorhetic state of milk production was reported by Bauman and Currie (Citation1980) and proved by Lucy et al. (Citation2009). The higher the milk production potential, the longer the counter-regulation of the catabolic growth hormone was interrupted. Despite increasing energy density in diet, milk performance and catabolic processes were supported during early lactation instead of regaining body tissue. Priority of milk production originally guaranteed the survival of offspring. Extending this priority resulted in an increased energy deficit and therefore tissue mobilisation especially in early lactation (Martens Citation2013). The extent, to which negative energy balance cannot be reduced by feeding a higher energy diet, is defined as genetically driven (Friggens et al. Citation2007). Negative energy balance and depletion of body stores had been associated with problems in health and fertility (e.g. Spicer et al. Citation1990; Lucy Citation2001; Pryce et al. Citation2001). Non-esterified fatty acids, pro-inflammatory cytokines and reactive oxygen species added to the negative energy balance in the peripartal period may lead to stress in the endoplasmic reticulum in the liver (ER stress). This is considered to predispose high yielding dairy cows to develop diseases like ketosis and fatty liver. Furthermore, cows seemed to show differing capabilities to cope with negative energy balance. The activation of hepatic stress response pathways to reduce damages of tissue may be different between dairy cows. Finally, ER stress can promote insulin resistance and lead to hepatic inflammatory processes (Ringseis et al. Citation2015). A high level of cytokines due to a subclinical inflammation ante partum reduces feed intake. This exacerbates the negative energy state in early lactation and ending up in a downward spiral (Menn Citation2015).
The Federal Association of Austrian Cattle Breeders (ZAR) initiated the project ‘Efficient Cow’ in 2012 for improving efficiency in Austrian dairy cattle, and for evaluating how this would affect greenhouse gas emissions. The aim of this study was to evaluate the influence of genotype, parity and lactation stage on different efficiency parameters in dairy production, energy balance, and related traits. Within genotype, several groups of FV cows with increasing average Red Holstein (RH) proportion were compared to monitor the impact of RH genetics within the dual-purpose breed FV.
Materials and methods
Data recording and calculation
Data were recorded in 2014 from 3634 FV, 1034 HF and 1437 BS cows kept on 161 dairy farms in Austria. Free-stall barns and milking twice a day in a milking parlour system were common. The Austrian milk recording organisations collected additional traits like body weight, body condition score (BCS), heart girth, belly girth and information on diet as well as diet quality at each routine performance recording day. Body weight was recorded as single measurement using mobile scales of the milk recording organisations. Cows were gathered and entered the scale separately. Data were stored in the Austrian central cattle database. The average herd size of participating farms (32.7 cows) was twice as high as the Austrian average of 16.5 dairy cows (ZAR Citation2016). It reflected the wide range of herd size in Austria (project farms: 3.2 to 79.9 cows). Milk recording was done 9 to 11 times a year with on average 9.8 performance recordings per farm. Farms were situated between 300 and 1460 m above sea level in mountainous, flat and hilly areas. Detailed information about herds, farms and performance recording methods is given in Ledinek et al. (Citation2018).
Handling of forage analyses (VDLUFA Citation1976–2012), nutrient content of concentrate (DLG Citation1997), and calculation of energy content of forage (GfE Citation2001) was described in the previous article by Ledinek et al. (Citation2018). Due to the lack of ability to comprehensively measure feed intake on-farm, dry matter intake (DMI) was estimated using the prediction model of Gruber et al. (Citation2004). This given situation was used for developing novel strategies for recording information on diet composition on-farm. Diet composition and feeding systems were additionally considered in the feed intake prediction model. The used prediction model was found to be the most accurate and valid one of five evaluated up-to-date models (Jensen et al. Citation2015). The validation set included 12 Scandinavian experiments involving 917 dairy cows and 94 treatments. The breeds were Danish/Swedish Red, varying in lactation stages and parity. The use of feed intake prediction showed a possible approach for gaining information under insufficient conditions for measuring. Further details about recording diet composition, feed intake estimation and chemical diet composition can be found in Ledinek et al. (Citation2016), and Ledinek et al. (Citation2018). Energy-corrected milk yield (ECM) and energy requirement were calculated using the guidelines of GfE (2001). Daily energy requirements included requirements for maintenance, milk production and pregnancy. Daily energy balance was calculated by subtracting energy requirements from energy intake, expressed in MJ of net energy for lactation (NEL) per day (GfE 2001). Edmonson et al. (Citation1989) defined the applied 5-point system for BCS recording.
The calculation of efficiency parameters was based on the description by Berry and Pryce (Citation2014). As feed intake had to be estimated, residual feed intake could not be considered. In this study, efficiency was defined as ratio between output and input and named after the input parameter. Therefore kg ECM per kg metabolic body weight (BW0.75) was defined as body weight efficiency, kg ECM per kg DMI as feed efficiency and energy in milk (LE) per energy intake, both expressed in MJ of NEL, as energy efficiency. Energy efficiency additionally considers diet quality and, therefore, concentrates proportion. A holistic comparison of dual-purpose and specialised dairy types requires additional information about fattening potential etc., but this would extend the scope of the current study.
Statistical analysis
The dataset was based on 38,070 performance recordings of 6105 cows on 161 farms. As described in detail in Ledinek et al. (Citation2018), the groups FV, HF and BS included only cows with 100% ancestry of the respective breed. Further, genotypes of FV × RH were defined according to the RH gene proportion. Classes with an average of 6.25% RH genes (FV × RH6.25, 963 cows), 12.5% RH genes (FV × RH12.5, 342 cows), 25% RH genes (FV × RH25, 404 cows), and 68% RH genes (FV × RH5075, 349 cows, combination of the groups FV × RH50 and FV × RH75) were established. This spectrum of FV × RH groups between the two pure genotypes FV (1576 cows) and HF allowed illustrating the influence of the dairy breed RH on the dual-purpose breed FV. It characterises the specialisation on dairy performance (potential for milk production). Lactation stage included finally twelve 28-day stages (lactation months) and days in milk (DIM) from 1 to 336.
The final model included genotype, parity (1, 2, 3 + 4, ≥5), lactation stage and their interactions as fixed effects. The effect of diet was considered via the fixed effect forage type (1–18) and the management via the fixed effect of farm (1–161). The effect of cow (1–6105) was assumed to be random and nested within genotype and farm. Parameters were analysed using PROC MIXED of SAS 9.4 (SAS Citation2015), the method REML and the method of Kenward-Roger for the approximation of the denominator degrees of freedom. The chosen default covariance structure VC had the smallest Akaike information criterion. The multiple comparisons were applied using the specification ADJUST = TUKEY with p < .05 for significant differences. The effect of forage type on efficiency and its related traits was included only as correction factor but is not topic of this study. Therefore, it is not discussed further.
Results and discussion
Effect of genotype and genotype × lactation stage
contains efficiency traits, energy balance and related traits like predicted feed intake, predicted energy intake, milk production, body weight and BCS. Genotype differed in all traits (p < .001). As feed intake is estimated, energy balance, energy and feed efficiency are partly based on predicted values. Results of predicted and measured traits correspond to each other and are consistent with findings in literature. As in Ledinek et al. (Citation2018) discussed in detail, average body weight and especially BCS declined with specialisation on milk production from FV to HF with increasing RH genes. Production traits like ECM, milk yield, predicted DMI and energy intake increased. The FV groups, especially up to an average of 12.5% RH genes, were biologically similar. BS was located in the range of FV to FV × RH25 except they were slightly lighter than HF and had a BCS approximately midway between FV and HF. Crude protein, neutral detergent fibre (NDF) and energy density were 155 g, 389 g and 6.53 MJ NEL per kg dry matter (DM) of total diet. Dietary nutrient level and concentrate proportion increased with higher potential for milk production according to the findings of e.g. Dillon et al. (Citation2003). As forage type was kept constantly forage had approximately 132 g crude protein, 446 g NDF and 6.00 MJ NEL per kg DM (Ledinek et al. Citation2018).
Table 1. Effect of genotype and parity on body weight, body condition score, milk production data, predicted dry matter intake, energy balance and efficiency parameters (least squares means).
The milk protein content of BS corresponded to the breeding on high protein content in Austrian BS. The decrease of milk protein content from the FV up to an average 25% RH genes to HF was hardly surprising (ZAR Citation2016). For milk fat, no special trend related to RH gene proportion was found, but the two groups HF and BS had the lowest fat content. In earlier studies, HF cows had lower milk solid contents compared to breeds with lower potential for milk production (Dillon et al. Citation2003) and lower fat and protein contents than New Zealand HF (Roche et al. Citation2006; Piccand et al. Citation2013). The effect occurs within a breed between cows of lower and higher genetic merit for dairy traits, too (Kennedy et al. Citation2003). It is based on the higher ratio of growth hormone to insulin and the higher level of growth hormone in blood of high yielding cows during lactation (Hart et al. Citation1978; Citation1979).
All efficiency parameters () showed an increasing trend from FV to HF with rising RH genes. Although body weight did not decline until 25% RH genes in Fleckvieh, body weight efficiency increased due to rising ECM. The group BS was located approximately in the midway of FV and the most efficient groups HF and FV × RH5075. Body weight was lower than of HF, but milk performance was similar to FV. We found that body weight efficiency nearly mirrored BCS. The lower the average BCS, the more efficient the genotypes were. In contrast to this, feed and energy efficiency of BS were similar to FV, because of comparable milk production and feed intake. High yielding cows or breeds do not only have a higher performance and feed intake. They partition more nutrients to milk production than to body reserves (Yan et al. Citation2006). Feed efficiency ranged between 1.319 kg ECM/kg DMI for BS and 1.381 and 1.383 kg ECM/kg DMI for HF and FV × RH5075, respectively. Thus, HF of the current study was more efficient than HF in commercial Danish dairy herds, but did not reach feed efficiency of the smaller Danish Jerseys (Kristensen et al. Citation2015). In contrast to this, the Danish HF cows produced more ECM per body weight than all genotypes of the current examination due to their lower body weight (HF: Danish HF 602 vs. Austrian HF 662 kg). In a Swiss breed comparison, New Zealand HF and Swiss HF were most efficient (Piccand et al. Citation2013). In contrast to the current study, Swiss BS had the same body weight efficiency as Swiss FV. However, Swiss FV is more comparable with FV × RH5075 due to a similar RH proportion. Overall, the cows in the Swiss study produced milk less efficiently than in our and the above mentioned Danish results due to their lower milk production. This shows the difference between high-input and a pasture-based low input system. Pasture-based low input systems aim at high productivity per ha pasture and not per cow (Dillon et al. Citation1995). Milk performance, the dietary nutrient level as well as the rare use of pure forage diets and pasture confirmed that the project farms belonged to the current upper end of the structural change of Alpine dairy farming (Ledinek et al. Citation2018). In the last 50 years larger, indoor-feeding, non-seasonal and more specialised dairy production more and more replaced the forage-based and small-scaled one (Knaus Citation2016). Furthermore, an increasing amount of concentrate reduces the efficiency of converting human-inedible feedstuffs into human-edible products. The area of grassland utilised per ton of milk is positively correlated with efficiency of human-edible feed conversion (Ertl et al. Citation2015).
Figure 1. Effect of genotype on the efficiency parameters of Brown Swiss (BS), Fleckvieh (FV), the FV groups with increasing Red Holstein (RH) genes and Holstein Friesian (HF) as well as the interaction of selected genotypes and lactation stage for body weight, body condition score and energy balance (ECM: energy corrected milk; BW0.75: metabolic body weight; DMI: predicted dry matter intake; LE: energy in milk; NEL: net energy for lactation; BCS: body condition score (Ledinek et al. Citation2018)). As DMI was estimated, energy intake, energy balance, feed and energy efficiency are partly based on predicted values.
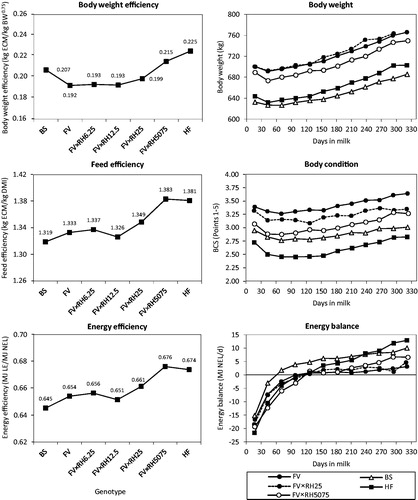
Average energy balance ranged between –1.57 (FV × RH12.5) and 3.78 MJ NEL/d (BS). Along with fully recovering from the BCS loss after calving, this result indicates that the Austrian project farms paid attention to feeding diets according to energy requirements. Coffey et al. (Citation2004) and Yan et al. (Citation2006) demonstrated that high yielding cows required energy-dense diets to regain fat stores. The high yielding groups HF and FV × RH5075 seemed to regain their loss of body reserves (BCS; ) mainly in late lactation. However, they then had more energy-dense diets due to a higher concentrate proportion but relatively low milk production compared to the other groups. The group HF lost BCS the most. It stagnated longest at its lowest level until DIM 154. The FV groups mobilised less body tissue and regenerated earlier (Ledinek et al. Citation2018). The group BS, having the lowest feed and energy efficiency, reached positive energy balance on DIM 62. The low feed and energy efficiency of BS was due to a relatively high energy density compared to the milk performance. FV followed on DIM 100. Energy balance of FV × RH25, HF and FV × RH5075 became positive later (between DIM 110 and 120). The strong exploitation of body reserves with increasing milk production or specialisation on dairy traits was confirmed earlier by several other studies (e.g. Coffey et al. Citation2004; Yan et al. Citation2006; Friggens et al. Citation2007).
Effect of parity and genotype × parity
Parity affected all traits significantly (p < .001; ). The interaction between parity and genotype was significant for most traits (data not shown). However, the order of genotypes within parity mostly remains the same. In cases when it did not, differences were numerically small and not significant. As described by Ledinek et al. (Citation2018), most traits increased in a degressive way until parity 3 + 4 determined due to growth and maturing of the cows with progressing age. In parity ≥5 traits were slightly lower than in parity 3 + 4 except for increasing body weight.
Due to our findings that higher milk performance and efficiency were based on a higher degree of mobilisation, we assumed to find similar patterns in all parities. In fact, BCS and energy balance mirrored performance and efficiency parameters over parities. The decreasing efficiency of the older cows in parity ≥5 can be explained by the declining performance. In parity 1 cows partitioned nutrients additionally into growth and maturation as increasing body weight showed. In parity ≥5 nutrients were additionally partitioned into body fat tissue, partly visualised by a higher BCS within genotypes. Rising BCS was mainly found in the FV groups. The breeds HF and BS constantly lost BCS from parity 1 to ≥5 (data not shown). This observation was confirmed by the conclusions of Coffey et al. (Citation2004): primarily breeding for high milk performance had forced cows to exploit their energy reserves to a higher extent in early lactation than they could regain in their remaining productive life.
In contrast to the other fixed effects, parity revealed a difference in development between body weight efficiency vs. feed and energy efficiency. Body weight efficiency followed the degressive development of ECM, body weight and feed intake (Ledinek et al. Citation2018). Only FV × RH6.25 and HF were most efficient in parity 2. The group FV × RH6.25 failed to exhibit the typical peak of ECM in parity 3 + 4 and had a constant ECM from parity 2 to ≥5. Daily ECM of HF-increased strongly between parity 1 and 2 relatively to body weight. Feed and energy efficiency showed that cows of parity 2 and ≥5 were more similar to cows of parity 1. Cows of parity 3 + 4 had a higher performance than those of parity 2, although predicted DMI per body weight was slightly lower. Their additional energy requirements were only partially met by increasing DMI. In HF cows the strong increase of ECM caused a degressive increase of efficiency up to parity 3 + 4. Their energy balance developed in the opposite direction and BCS declined even up to parity ≥5. Contrary to this, efficiency, as well as BCS of FV × RH6.25, were nearly constant due to the before mentioned low ECM in parity 3 + 4. Although milk yield is known as important driver of DMI ( Kennedy et al. Citation2003, Gruber et al. Citation2004) feed intake capacity did not develop sufficiently during production life. Differing heritabilities of DMI (0.16 to 0.49) and of milk performance (0.44 to 0.95) reflect the general relationship (Veerkamp and Koenen Citation1999).
Effect of lactation stage
shows the parameters changing over lactation (p < .001). Highest estimated nutrient and feed intake (21.49 kg DM/d; 161.8 g/kg BW0.75) were observed at DIM 71 together with highest concentrate proportion (33.1%, 6.64 MJ NEL/kg DM) and highest nutrient density of total diet. The NDF content of total diet mirrored the concentrate proportion and ranged between 378 and 406 g/kg DM. Forage intake increased until DIM 321 with 14.99 kg DM/d (Ledinek et al. Citation2018). Efficiency parameters declined with progressing lactation mainly due to decreasing milk production while body weight increased. Lowest milk protein and fat content were reached on DIM 43 and 71 during the negative energy state. The lactose content developed similar to milk yield. Highest efficiency coincided with highest milk yield and lower feed and energy intake in early lactation. This observed low feed intake during early lactation (Ingvartsen and Andersen Citation2000) led to a negative energy balance approximately until DIM 110. The cows produced milk partly independently from nutrient supply by depleting their body reserves. This was described as ‘genetically driven body energy change’ (Friggens et al. Citation2007). It ensures the nourishment of calves independent from the situation of the dam (Bauman and Currie Citation1980; Martens Citation2013). Bauman and Currie (Citation1980) divided the lactation into thirds: in the first part, energy balance was negative due to priority of milk production. The second part showed a balanced situation. The surplus of energy in the third part was used for regaining body reserves and requirements for pregnancy. Yan et al. (Citation2006) quantified the increasing efficiency of partitioning energy intake to body tissue with progressing lactation. This results in an increase of BCS together with energy retention. Martens (Citation2013) pointed out that extent and duration of negative energy balance in dairy cows became larger in the last decades by breeding for higher (initial) milk yield. In contrast to this, beef cows did not undergo any body weight change (Hart et al. Citation1975). The long negative state agreed with our findings that cows had an above-average production level compared to the Austrian average (ZAR Citation2016). The high dietary nutrient level did not prevent loss of body reserves. However, feeding a more energy-dense diet to specialised dairy breeds resulted in a higher proportion of additional energy intake, which was partitioned to milk production instead to body tissue (Yan et al. Citation2006). Furthermore, high milk performance and negative energy balance or its visible signs like loss of BCS or body weight are connected with decreasing fertility and health (e.g. Lucy Citation2001; Pryce et al. Citation2001; Martens Citation2013). Newer studies discussed the occurrence of an inflammatory state of liver and stress of endoplasmic reticulum during the periparturient period. It is seen as another point within the interrelationships of milk performance, BCS, homeorethic regulation, lipid metabolism and inflammatory diseases (e.g. Bertoni et al. Citation2008; Bradford et al. Citation2015; Gessner et al. Citation2015). The negative energy balance plays a key role herein (Martens Citation2013). The high efficiency of the cows in the current study, especially in the first third of lactation, was mainly based on depletion of body fat stores.
Table 2. Effect of lactation stage on body weight, body condition score, milk production data, predicted dry matter intake, energy balance and efficiency parameters (least squares means).
Besides the effects of energy balance on milk performance, health and fertility, the relationship to body weight and BCS in different stages of lactation were examined (Dillon et al. Citation2003; Berry et al. Citation2006). In the current study, BCS reached its nadir on DIM 71 and stagnated until DIM 155. Body weight started to increase earlier at DIM 43 and continuously rose afterwards. This agreed with results of Andrew et al. (Citation1994), who reported lowest body energy content on DIM 77 in HF cows. Similar disagreements between the development of BCS and body weight were observed by e.g. Dillon et al. (Citation2003). The development of both BCS and body weight varied with feeding level (Berry et al. Citation2006; Yan et al. Citation2006). In accordance with earlier studies (Andrew et al. Citation1994; Ledinek and Gruber Citation2015), body weight may have been influenced by feed intake and water repletion during fat mobilisation.
Conclusions
Among all discussed effects one observation was at common: High efficiency required nutrient partitioning inclusive mobilisation towards milk performance. The higher the potential for milk production, the more efficiently milk was produced, albeit at the expenses of body reserves. High milk performance and therefore high efficiency in the first third of lactation were mainly based on the depletion of body fat stores. It pictured the well-known incidence of a negative energy balance. Therefore breeding for higher efficiency would lead to a longer and more intense negative energy balance including problems with health and fertility. Hence, when designing an efficiency index for cattle breeding, several further traits such as body condition, health, fertility, or fattening potential need to be considered.
The production level of the project farms was notably above the Austrian average, which resulted in energy-dense diets. High milk yield driving efficiency was accompanied by energy-dense diets. Further research is needed to clarify how efficiency on an animal level, if it is driven by milk yield and based on energy-dense diets, interacts with a sustainable dairy production and the use of human-edible feedstuffs.
Ethical approval statement
No work carried out for this research was subject to the approval of an ethics committee.
Acknowledgements
The authors want to express their gratitude to Helga Bahar (Agricultural Research and Education Centre Raumberg-Gumpenstein, Irdning) for graphical editing, and Karl Moder (Institute of Applied Statistics and Computing, BOKU, Vienna) for statistical advice.
Disclosure statement
No potential conflict of interest was reported by the authors.
Additional information
Funding
Related Research Data
References
- Andrew SM, Waldo DR, Erdman RA. 1994. Direct analysis of body composition of dairy cows at three physiological stages. J Dairy Sci. 77:3022–3033.
- Bauman DE, Currie WB. 1980. Partitioning of nutrients during pregnancy and lactation: A review of mechanisms involving homeostasis and homeorhesis. J Dairy Sci. 63:1514–1529.
- Berry DP, Pryce JE. 2014. Feed efficiency in growing and mature animals. Proceedings of the 10th Word Congress of Genetics Applied to Livestock Production; Vancouver 2014, Canada.
- Berry DP, Veerkamp RF, Dillon P. 2006. Phenotypic profiles for body weight, body condition score, energy intake, and energy balance across different parities and concentrate feeding levels. Livest Prod Sci. 104:1–12.
- Bertoni G, Trevisi E, Han X, Bionaz M. 2008. Effects of inflammatory conditions on liver activity in puerperium period and consequences for performance in dairy cows. J Dairy Sci. 91:3300–3310.
- Bradford BJ, Yuan K, Farney JK, Mamedova LK, Carpenter AJ. 2015. Invited review: inflammation during the transition to lactation: New adventures with an old flame. J Dairy Sci. 98:6631–6650.
- Coffey MP, Simm G, Oldham JD, Hill WG, Brotherstone S. 2004. Genotype and diet effects on energy balance in the first three lactations of dairy cows. J Dairy Sci. 87:3218–4326.
- de Haas Y, Pryce JE, Berry DP, Veerkamp RF. 2014. Genetic and genomic solutions to improve feed efficiency and reduce environmental impact of dairy cattle. Proceedings of the 10th Word Congress of Genetics Applied to Livestock Production; Vancouver, Canada. p. 1–5.
- Dillon P, Buckley F, O’Connor P, Hegarty D, Rath M. 2003. A comparison of different dairy cow breeds on a seasonal grass-based system of milk production. 1. Milk production, body weight, body condition score and DM intake. Livest Prod Sci. 83:21–33.
- Dillon P, Crosse S, Stakelum G, Flynn F. 1995. The effect of calving date and stocking rate on the performance of springcalving dairy cows. Grass Forage Sci. 50:286–299.
- [DLG] German Agricultural Society. 1997. DLG-Futterwerttabellen Wiederkäuer [Feed value table ruminants]. Frankfurt am Main: DLG-Verlag.
- Edmonson AJ, Lean IJ, Weaver LD, Farver T, Webster G. 1989. A body condition scoring chart for Holstein dairy cows. J Dairy Sci. 72:68–78.
- Ertl P, Klocker H, Hörtenhuber S, Knaus W, Zollitsch W. 2015. The net contribution of dairy production to human food supply: the case of Austrian dairy farms. Agric Systems. 137:119–125.
- Friggens NC, Berg P, Theilgaard P, Korsgaard IR, Ingvartsen KL, Løvendahl P, Jensen J. 2007. Breed and parity effects on energy balance profiles throughout lactation: evidence of genetically driven body energy change. J Dairy Sci. 90:5291–5305.
- Gessner DK, Koch C, Romberg F-J, Winkler A, Dusel G, Herzog E, Most E, Eder K. 2015. The effect of grape seed and grape marc meal extract on milk performance and the expression of genes of endoplasmic reticulum stress and inflammation in the liver of dairy cows in early lactation. J Dairy Sci. 98:8856–8868.
- [GfE] Society of Nutrition Physiology. 2001. Energie- und Nährstoffbedarf landwirtschaftlicher Nutztiere, Nr. 8: Empfehlungen zur Energie- und Nährstoffversorgung der Milchkühe und Aufzuchtrinder [Energy and nutrient requirements of livestock, No. 8: Recommendations for energy and nutrient supply of dairy cows and breeding cattle]. Frankfurt am Main: DLG-Verlag.
- Gruber L, Schwarz FJ, Erdin D, Fischer B, Spiekers H, Steingass H, Meyer U, Chassot A, Jilg T, Obermaier A, Guggenberger T. 2004. Vorhersage der Futteraufnahme von Milchkühen – Datenbasis von 10 Forschungs- und Universitätsinstituten Deutschlands, Österreichs und der Schweiz [Feed intake prediction in dairy cows based on the data of ten German, Austrian and Swiss research institutes and universities]. Proceedings of the 116th VDLUFA-Kongress; Sept 13–17; Rostock, Germany. p. 484–504.
- Hansen LB. 2000. Consequences of selection for milk yield from a geneticist’s viewpoint. J Dairy Sci. 83:1145–1151.
- Hart IC, Bines JA, Balch CC, Cowie AT. 1975. Hormone and metabolite differences between lactating beef and dairy cows. Life Sci. 16:1285–1292.
- Hart IC, Bines JA, Morant SV. 1979. Endocrine control of energy metabolism in the cow: Correlations of hormones and metabolites in high and low yielding cows for stages of lactation. J Dairy Sci. 62:270–277.
- Hart IC, Bines JA, Morant SV, Ridley JL. 1978. Endocrine control of energy metabolism in the cow: Comparison of the levels of hormones (prolactin, growth hormone, insulin and thyroxine) and metabolites in the plasma of high- and low-yielding cattle at various stages of lactation. J Endocrinology. 77:333–345.
- Ingvartsen KL, Andersen JB. 2000. Symposium: dry matter intake of lactating dairy cattle. Integration of metabolism and intake regulation: d review focusing on periparturient animals. J Dairy Sci. 83:1573–1597.
- Jensen LM, Nielsen NI, Nadeau E, Markussen B, Nørgaard P. 2015. Evaluation of five models predicting feed intake by dairy cows fed total mixed rations. Livest Sci. 176:91–103.
- Kennedy J, Dillon P, Delaby L, Faverdin P, Stakelum G, Rath M. 2003. Effect of genetic merit and concentrate supplementation on grass intake and milk production with Holstein Friesian dairy cows. J Dairy Sci. 86:610–621.
- Knaus W. 2016. Perspectives on pasture versus indoor feeding of dairy cows. J Sci Food Agr. 96:9–17.
- Kristensen T, Jensen C, Østergaard S, Weisbjerg MR, Aaes O, Nielsen NI. 2015. Feeding, production, and efficiency of Holstein-Friesian, Jersey and mixed-breed lactating dairy cows in commercial Danish herds. J Dairy Sci. 98:263–274.
- Ledinek M, Gruber L. 2015. Körpermaße und BCS im Laufe der Laktation und ihre Beziehungen zu Lebendmasse und Energiebilanz [Body measurements and BCS during lactation and connection to body weight and energy balance]. Züchtungskunde. 87:181–200.
- Ledinek M, Gruber L, Steininger F, Zottl K, Royer M, Krimberger K, Mayerhofer M, Egger-Danner C, Fuerst-Waltl B. 2018. Analysis of lactating cows in commercial Austrian dairy farms: Diet composition, and influence of genotype, parity and stage of lactation on nutrient intake, body weight and body condition score. Italian J Anim Sci. [accessed 2018 Nov 05]:[14 p.]. https://doi.org/10.1080/1828051X.2018.1504632.
- Ledinek M, Gruber L, Steininger F, Fürst-Waltl B, Zottl K, Royer M, Krimberger K, Mayerhofer M, Egger-Danner C. 2016. Efficient Cow – Estimation of feed intake for efficiency traits using on-farm recorded data. 24th International Symposium Animal Science Days; Ptuj. Acta Agric Slovenica. Suppl 5:71–75.
- Lucy MC. 2001. ADSA Foundation Scholar Award. Reproductive loss on high-producing dairy cattle: where will it end? J Dairy Sci. 84:1277–1293.
- Lucy MC, Verkerk GA, Whyte BE, McDonald KA, Burton L, Cursons RT, Roche JR, Holmes CW. 2009. Somatotropic axis and nutrient partitioning in genetically diverse dairy cows managed under different feed allowances in a pasture system. J Dairy Sci. 92:526–539.
- Martens H. 2013. Erkrankungen von Milchkühen in der frühen Laktationsphase - Risikofaktor negative Energiebilanz und Hyperketonämie [Diseases in dairy cows in early lactation – risk of negative energy balance and hyperketonemia]. Tierärztl Umschau. 68, 463–476.
- Menn F. 2015. Transitphase – Energiestoffwechsel – Entzündungen – Futteraufnahme: Wie hängt das zusammen? Hypothetische Rolle des Enzyms AMPK [Transition phase – energy metabolism – inflammation – feed intake: How are they linked? The hypothetical role of the enzyme AMPK]. In: Proceedings 15th internationale Tierärztetagung der Agrar- und Veterinär-Akademie, AVA, Göttingen, pp. 86–90.
- Piccand V, Cutullic E, Meier S, Schori F, Kunz RL, Roche JR, Thomet P. 2013. Production and reproduction of Fleckvieh, Brown Swiss, and 2 strains of Holstein-Friesian cows in a pasture-based, seasonal-calving dairy system. J Dairy Sci. 96:5352–5363.
- Pryce JE, Coffey MP, Simm G. 2001. The relationship between body condition score and reproductive performance. J Dairy Sci. 84:1508–1515.
- Ringseis R, Gessner DK, Eder K. 2015. Molecular insights into the mechanisms of liver-associated diseases in early-lactation dairy cows; hypothetical role of endoplasmic reticulum stress. J Anim Phys Anim Nutr. 99:626–645.
- Roche JR, Berry DP, Kolver ES. 2006. Holstein-Friesian strain and feed effects on milk production, body weight, and body condition score profiles in grazing dairy cows. J Dairy Sci. 89:3532–3543.
- SAS [Statistical Analysis System]. 2015. SAS/STAT 9.4 User’s Guide. Cary (NC): SAS Institute Inc.
- Spicer LJ, Tucker WB, Adams GD. 1990. Insulin-like growth factor-I in dairy cows: Relationship among energy balance, body condition, ovarian activity, and estrous behaviour. J Dairy Sci. 73:929–937.
- Vallimont JE, Dechow CD, Daubert JM, Dekleva MW, Blum JW, Barlieb CM, Liu W, Varga GA, Heinrichs AJ, Baumrucker CR. 2011. Short communication: heratibility of gross feed efficiency and associations with yield, intake, residual intake, body weight, and body condition score in 11 commercial Pennsylvania tie stalls. J Dairy Sci. 94:2108–2113.
- [VDLUFA] Association of German Agricultural Analytic and Research Institutes. 1976. incl. suppl. 1983, 1988, 1993, 1997, 2004, 2006, 2007, 2012. Methodenbuch Bd. III: Die chemische Untersuchung von Futtermitteln [Manual of agricultural methods of testing and analysis (VDLUFA methods book, Volume III – Feed analysis]. Darmstadt: VDLUFA-Verlag.
- Veerkamp RF, Emmans GC. 1995. Sources of genetic variation in energetic efficiency of dairy cows. Livest Prod Sci. 44:87–97.
- Veerkamp RF, Koenen EPC. 1999. Metabolic stress in dairy cows. Br Soc Anim Sci. 24:63–73.
- Yan T, Mayne CS, Keady TWJ, Agnew RE. 2006. Effects of dairy cow genotype with two planes of nutrition on energy partitioning between milk and body tissue. J Dairy Sci. 89:1031–1041.
- [ZAR] Federal Association of Austrian Cattle Breeders. 2016. Jahresbericht 2015 [Annual report 2015]. Vienna: ZAR.
- ZuchtData. 2016. Jahresbericht 2015 [Annual report 2015]. Vienna: ZuchtData-EDV-Dienstleistungen GmbH.