
Abstract
This study was conducted in 2018 in order to determine the effects of an electric fence system on honeybee colonies housed in hives made from different materials. The experiment was carried out with honeybee colonies of 36 Caucasian races (Apis mellifera Caucasica) in full-size Langstroth hive. In terms of mean values of the aggressive behaviour of honeybee colonies were found to be the highest (13.57 number/colony) application group where the conductor wires of electric fence system are within a 1 m distance from hives and the lowest (2.39 number/colony) were obtained from control application group. The highest mean values adult bee development (23.76 ± 12.34 number/colony), development of brood area (5421.25 ± 1432.75 cm2/colony), nectar flow period weight gain (46.42 ± 3.61 kg/colony), flight activity (107.38 ± 11.74 number/colony) and honey yield (21.55 ± 1.54 kg/colony) were determined in control groups. When the average values of honeybees robbing behaviour were examined, the highest value (3.33 ± 0.32 number/colony) was determined in the control groups. This experiment shows that the electromagnetic and electric fields produced by the electric fence system have negative effects on honeybees. In order to minimise the negative effects of the electric fence system on the bees, hives should be covered with a metal screen or should be placed long distance (minimum 2 m) from the electric fences.
The electric fence system is the most effective method of keeping honeybee colonies.
At the same time, the electric fence system disturbs the honeybees.
All negativity can be completely eliminated by simple measures.
Highlights
Introduction
In addition to producing bee products such as honeybees, honey, pollen, royal jelly and bee venom, it provides a valuable service for agriculture and humanity by pollinating crops (Morse and Calderone Citation2000; Abrol Citation2009).
The honeybee colonies are housed in the hive, in areas called the apiary. Apiaries are often found in protected areas near water sources where flowering plants are abundant throughout the year. These areas are also ideal habitats for bears, one of the bee enemy. Bears are heavily fed in the autumn to increase the oil reserves required for hibernation. Besides the consumption of many food items such as fruits and vegetables, honeybee larvae and honey stored in hives are a very valuable food for bears, so bears often attack unprotected apiary and cause heavy damage (Meadows et al. Citation1998; Caron and Bowman Citation2004; Masterson Citation2006) in addition, it causes a problem during the pollination season (Clark et al. Citation2005). When a bear discovers a rich nutrient, he often visits this area (Hygnstrom and Craven Citation1996; Masterson Citation2006), therefore, it is very important to take the necessary measures before the bears attack the apiary. In order to protect against the pest of bear, some methods have been developed, such as barbed wire fence, electric fence, elevated platform, repellent chemicals and trapping remove. Techniques other except for electric fence system are generally ineffective and costly. In addition, the permanent fencing system is not a suitable option for the mobile beekeeping and commercial bee industry (Burgett et al. Citation2010). As a result of studies on many techniques, electric fences have been identified as the most effective way to keep bears away from hives (Meadows et al. Citation1998; Caron and Bowman Citation2004; Clark et al. Citation2005).
The electric fence is also used to protect agricultural products, pastures, sheep, cattle, poultry and honeybees from damage to wild animals. The electric fence is an environmentally friendly system that can be used without damaging the nature and wild animals. This system applies a high voltage, a low current shock to animals for a very short period of time. It was first used in the late 1970s as a way to protect domestic sheep from attack by coyotes (Dorrance and Bourne Citation1980). The field and laboratory studies were carried out by Collins et al. (Collins & Rothenbuhler Citation1978; Collins Citation1979; Collins et al. Citation1984; Collins and Rinderer Citation1985). Studies to date have focussed on the impact of the electric fence system to protect the domestic animals against carnivorous animals or to protect hives against bear attacks. However, the response of honeybees to the electromagnetic field (EMF) and the electric field (EF) produced by the electric fence system has never been investigated. Whereas, the beekeepers claim that honeybees in the apiary, which are generally protected by an electric fence system, become highly aggressive and difficult to work with.
This study was carried out to determine the effects of electric fence system on the behavior characteristics and activities of honeybees.
Materials and methods
This study was conducted in 2018 at the Bayburt University Demirözü Vocational High School, Beekeeping Application, and Research Station (at 40°10′ 09″ N latitude, 39°50′ 53 26″ E longitude and 1663 m altitude). The study continued from 4 June to 30 August.
The experiments were performed in 36 full-size Langstroth-type hives, containing the same number of combs covered with bees (each contains nine frames), and approximately the same quantity of brood and food area. Because behaviours in honeybees vary strongly as a function of colony size and demographic distribution (Giray et al. Citation2000; Hunt et al. Citation2003). The queen bees of the colonies to be experiment were changed at the beginning of the spring with same age naturally mated Caucasian honeybee queens (Apis mellifera Caucasica).
In order to control other environmental conditions that could affect the behaviour, the apiary conditions were made equal for each colony on 5 June 2018.
Four separate experimental groups consisting of nine bee colonies were formed (). The bee colonies in the group were determined by draw. Three types of hive wood (W), wood covered with an insect screen (WCS) and insulated (I) (These hives are made of the composite material produced by gluing 30 mm thick polystyrene foam between two wooden sheets of 4 mm thickness.) were used in each trial group. Three of the hives in each group were covered with insect screen and grounded with a copper rod in order to eliminate the EMF to be formed by the electric fence. The insect screen used for covering hives is 18 × 18 mm mesh size and is made of 1 mm thick galvanised wire.
Table 1. Experimental groups.
The distance of electric fences to honeybee hives is 1 m in the first group (E1), 1.5 m in the second group (E2) and 2 m in the third group (E3). There is no electric fence around the fourth group (E4) (control group).
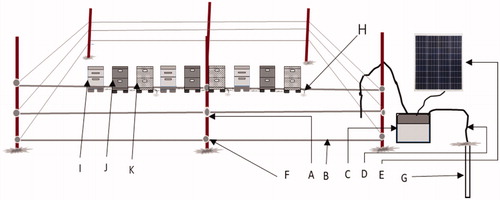
The electric fence system was designed in detail around the bee hives used in the test (). Wooden fence posts (length 230 cm, 5 × 5 in size), 2.5 Joule fence energiser (Çoban 5000) working with portable battery; 1.2 m long, 1.3 cm diameter galvanised grounding rod and 1.3 cm diameter brass grounding rod clamps; and 20,000 V double insulated electrical wires are used to connect the power supply to the fences and ground bars. We used a 12 V gel battery and to power the fence energiser.
Figure 1. Electric fence system designed around experimental hives. Fence materials include wood post (A), fence wire (1.5 mm in diameter) (B), fence energiser (C), double insulated wire (D) solar panel (E), insulator (F), grounding rod with clamp (G), grounding rod for hive covered with insect screen (H), wooden hive (I), insulated hive (J) and wooden hive covered with insect screen (K).
After running electric fences, we determined the EF and EMF strength values around the wires and in the hives belonging to the experimental groups.
The EMF produced by the electric fence was measured in μT with the help of TES Magnetic Field Metre 1393. When the EMF is generated, the EF also occurs. Both have an impact on living things. The strength of the electromagnetic radiation generated by the electric fence was measured in mV/m with the help of the TES electrosmog measuring device brand 593.
In order to determine the development of adult bees, on 5 June 2018, all the experimental colonies were equalised to be nine frames covered with honeybees. Five of these frames was covered with the brood area. From the equalised of colonies (5 June) to honey harvesting (30 August), the bee-covered frames of the colonies were determined at 30-day intervals. The data obtained were evaluated as a measure of mature bee development (Fresnaye and Lensky Citation1961).
Black suede-covered tennis balls were used to determine the aggressiveness tendency of honeybees. Black suede covered tennis balls (5 cm in diameter) was prepared separately for each colony. The suede-coated tennis balls were shaken in front of the colony entrance each hive for 60 s like a pendulum and the honeybees have attacked this ball. This experiment was repeated seven times with a 1-week interval in the same colonies, at the same time and with a different ball. The number of stings that the bees of different applications left on the ball was used as an indicator of the aggressiveness tendency (Stort Citation1974; Akyol and Kaftanoğlu Citation2001; Gösterit et al. Citation2012). We assayed the aggression of bees, between 14:00 and 16:00 at the afternoons. All hives in the experiment were tested one after another (in random order).
Because aggressive behaviours and flight activity are changing together (Giray et al. Citation2000; Wray et al. Citation2011), we measured flight activity to determine the impact of the electric fence. For this experiment, one hive from each trial group was selected depending on the chance. Between the hours of 10–11 in the morning, the bees flying from the hive for 60 s were counted. This procedure was repeated seven times 10-day interval (Pekel and Doğaroğlu Citation1987).
Robbing in honeybees occurs during the daylight hours, usually during periods when nectar decreases. Old forager bees attack the weaker hives, where they can steal nectar and honey resources, which is called robbery of hives.
During the period between the nectar flow period and honey harvestings for the determination of the robbery tendencies of the honeybee colonies, the apiary was closely monitored.
In the case of robbing, flour was sprinkled on the predator bees on the front of the hive. The bees that are floured are determined which hive they enter. This process was applied 10 times during the robbing period. The number of hives obtained was recorded as indicators of robbing tendencies of the groups (Doğaroğlu et al. Citation1992). In order to determine the nectar flow period weight gain of the honeybee colonies in the experimental groups, the hives were weighed at the beginning of the nectar flow period and before the harvest (Genç et al. Citation1999). At the end of the season (1st September) honey harvesting was done. Honey harvest is made only from the honey supers. The number of the hive was written over each frame taken during the harvest. Before and after the extraction, frames were weighed and recorded as honey yields of experimental bee colonies (Genç and Aksoy Citation1993; Carbonari et al. Citation2016).
In order to determine the amount of the brood area, the amount of brood area of the frames belonging to the colonies in the experimental groups from 5 June to 30 August was measured at a 21-day interval. The data obtained were calculated in cm2 using PUCHTA method. According to this, considering the elliptical shape of the brood area, the dimensions of the ellipse were measured and calculated with the formula S = p (A/2) × (a/2) (a long axis, a short axis) (Fresnaye and Lensky Citation1961; Kandemir et al. Citation2000).
All data were analysed using ANOVA (IBM SPSS 22 Statistics software). The significance level was taken as p < .05 in all analyses. Tukey’s HSD post hoc test was used to compare the means.
Results and discussion
After running electric fences, we determined the EF and EMF strength values in the hives belonging to the experimental groups ().
Table 2. The values of the electric field and electromagnetic radiation measured in experimental hives.
The average value of the EMF and EF measured in wooden hives ‘covered with insect screen and copper rod grounded’ was 0.074 μT and 2.23 mV/m. There was no significant difference between the W hive and I hive. The EMF generated by the electric fence was next to the fence wires was measured at 251.7 mV/m. The intensity of the EMF produced by the electric fence was 1.59 μT at the next to the fence wire. In this study, it was found that the EF and the EMF in the hive increased as the hives approached the wires of the electric fence system. However, if the hives are covered with metal plates or fly screen and grounded well, honeybees in the hive can be protected from the effect of the EMF. It is more convenient to use the tightly woven insect screen instead of a metal plate to protect the hives from summer heat and to improve ventilation.
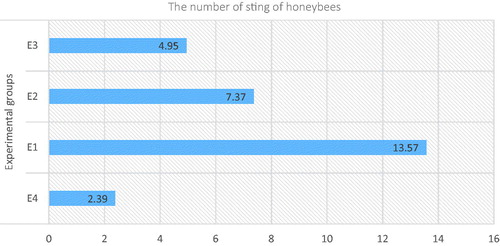
In , the results of the analysis for the stings number of the hive types are presented. According to the results of analysis of variance in mean data, wooden hive (9.86 ± 0.45b) and WCS hive (9.2 ± 0.34b) in the same group, while I hive (2.15 ± 0.13a) was in different groups (p < .05). The results of the analysis for the number of stings of the experimental groups are presented in . The average number sting of honeybees in E1, E2, E3 and E4 experimental groups were found as 13.57 ± 0.79d, 7.37 ± 0.29c, 4.95 ± 0.27b and 2.39 ± 0.19a number/colony, respectively. According to these results, although the electric fence system increases the aggressiveness of the honeybees as it approaches the beehives. indicates that insulated hives (I) had less aggressiveness (2.15) than hives covered with insect screen (WCS) (9.2). The difference between W and WCS was not significant. According to Duncan’s multiple comparison tests, each of the experimental groups was in different groups (p < .05).
Figure 2. Mean sting number of the hive types (number/colony). W: wood; WCS: wood covered with an insect screen; I: insulated.
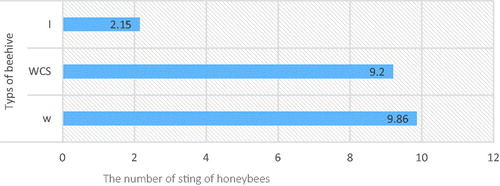
Figure 3. Mean sting number of the experimental groups (number/colony).
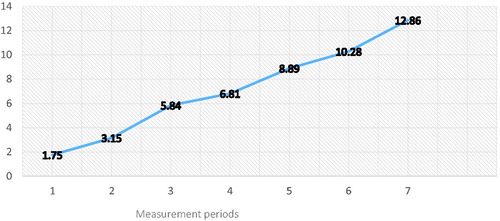
shows the results of the analysis of the mean sting numbers according to the measurement times. According to these results, after the installation of the electric fence system, there is an ever-increasing aggressiveness at honeybees. According to the results of analysis of variance applied to the numbers of sting obtained from the measurement periods, the first and second measurement periods are (a), the third, fourth, fifth and sixth measurement periods are (b), and the sixth and seventh measurement periods are in group (c) (p < .05). Looking at the measurement periods, the number of stings at the beginning of the experiment increased gradually in each period. This shows that honeybees are more aggressive as the exposure time to EMF or EF produced by electric fences increases.
Figure 4. Mean number of sting according to measurement periods (number/colony).
The average number of flying honeybees of W, WCS and I hives were found as 83.61 ± 12.73a, 105.46 ± 10.81c, 91.32 ± 13.62b, number/colony, respectively. When the experimental groups were compared with each other, the highest average was found in E4 (107.38 ± 11.74d number/colony) and the lowest average was determined in E1 (79.43 ± 13.48a number/colony). Mean values of flight activity of hive types and experimental groups were statistically different from each other (p < .05) ().
Table 3. Mean data on the number of robber and flying honeybees with the number of frames covered with the honeybee.
According to the results of this study, the flight activities of honeybees increase as the hives move away from the electric fences or the hives are covered with insect screen.
The average number of robber honeybees of experimental groups was given in . When these average values are considered, it is determined that the most robber honeybees are housed in the W hive (2.50 ± 0.21b). The lowest number of robber honeybees was determined with WCS hive (1.67 ± 0.19b). The highest group with the tendency to plunder was E1 (3.33 ± 0.32b), and the lowest was E4 (1.56 ± 0.14a). According to the results of the variance analysis applied to the average data, E2, E3 and E4 were in the same group and E1 was in different groups. (p < .05) (). Thus, the EF produced in the form of impulses by the electric fence system shows that increases the robber tendency of honeybees. Experimental groups showed a continuous increase in the adult bee population and the reached its highest level towards the end of the nectar flow period. Best results in terms of adult bee development were obtained from WCS hives.
The average adult bee population in W, WCS and in I hives were found as 17.54 ± 6.52a, 20.11 ± 8.92c and 19.20 ± 8.24b number/colony, respectively (). According to the results of variance analysis, three hive types were in different groups (p < .05). The highest mean value (23.76 ± 12.34d number/colony) for adult bee development was found in E4 experimental group and the lowest mean value (15.32 ± 10.81a number/colony) was determined in E1 experimental group. Accordingly, the electric fence system has been found to have a negative effect on adult bee development.
In the nectar flow period, the average weight gain obtained from W, WCS and I hives were found to be 37.14 ± 4.32a, 43.74 ± 1.49b and 46.35 ± 4.29c kg/colony, respectively (). The highest mean value (46.42 ± 3.61c kg/colony) in the weight gain of the nectar flow period was obtained from the E4 experimental group, and the lowest mean value (39.02 ± 4.86a kg/colony) was obtained from the E1 experimental group. The data obtained from the experimental groups were significantly different from each other in four groups (p < .05). These values are lower than in other studies.
Table 4. The results of weight gain during the nectar flow period, brood area and honey yield of experimental honeybee colonies.
The average honey yield of W, WCS and I hive were found as 15.13 ± 2.16a, 18.40 ± 1.14b, 19.26 ± 2.01b kg/colony respectively. The highest honey yield was obtained from the E4 (21.55 ± 1.54d kg/colony) and the lowest was obtained from E1 (14.05 ± 1.14a kg/colony) experimental groups (). The group means for honey production were found statistically different from each other (p < .05). It is thought that the electric fence system causes honey yield to decrease because they irritate the honeybees and reduce their activities.
The mean values for the brood area were presented in . The amount of brood area is one of the most important criteria in determining colony development (Genç et al. Citation1999). The brood area was higher in the I hives (4492.31 ± 1314.764 cm2/colony) than the other hives. According to the results, the highest average value in terms of brood area was determined in E4 (5421.25 ± 1432.75c cm2/colony) and the lowest value in E1 (3974.58 ± 782.13a cm2/colony) experimental group. The average of the groups for the development of the brood area was statistically different from each other (p < .05).
Conclusions
Consequently, there are little researches about, the effect of electric fence systems on honeybees.
The electric fence system is the most effective, the most environmentally friendly and the most widely used method of protecting the apiary against pests.
This system protects the bee colonies against pests but also causes some negativity on honeybees.
These negativities are to decrease flight activity, adult bee development, nectar flow period weight gain, honey yield and the amount of brood area.
In addition, the electric fence system increases aggression and robbery in honeybees.
According to the results of this study, the placement of bee colonies away from the electric fence (minimum 2 m) or the complete covering of the hives with the metal braided screen and grounded with copper rod minimises or completely eliminates these adverse effects.
Disclosure statement
No potential conflict of interest was expected by the author.
References
- Abrol DP. 2009. Plant pollinator interactors in the context of climate change – an endangered mutualism. J Palynol. 45:1–25.
- Akyol E, Kaftanoğlu O. 2001. Colony characteristics and the performance of Caucasian (Apis mellifera caucasica) and Mugla (Apis mellifera anatoliaca) bees and their reciprocal crosses. J Apic Res. 40:11–15.
- Burgett M, Daberkow S, Rucker R, Thurman W. 2010. U.S. pollination markets: recent changes and historical perspective. Am Bee J. 150:35–41.
- Carbonari V, Malaspina O, Junior VVA, Polatto LP. 2016. Variation in honey yield per hive of Africanized bees depending on the introducing time of young queens. Cienc Rural. 46:895–900.
- Caron DM, Bowman JL. 2004. Bears and bees. MAAREC Publication 4.10, MidAtlantic Apicultural Research & Extension Consortium. Newark: University of Delaware.
- Clark JD, Dobey S, Masters DV, Scheick BK, Pelton MR, Sunquist ME. 2005. American black bears and bee yard depredation at Okefenokee Swamp, Georgia. Ursus. 16:234–244.2.0.CO;2
- Collins AM. 1979. Genetics of the response of the honeybee to an alarm chemical, isopentyl acetate. J Apic Res. 18:285–291.
- Collins AM, Rinderer TE. 1985. Effect of empty comb on defensive behavior of honeybees. J Chem Ecol. 11:333–338.
- Collins AM, Rothenbuhler WC. 1978. Laboratory test of the response to an alarm chemical, isopentyl acetate, by Apis mellifera. Ann Entomol Soc Amer. 71:906–909.
- Collins AM, Rinderer TE, Harbo JR, Brown MA. 1984. Heritabilities and correlations for several characteristics in the honey bee. J Heredity. 75:135–140.
- Doğaroğlu M, Özdemir M, Polat C. 1992. Comparison to performances of some important honey bees (A. mellifera L.) genotypes and ecotypes of Turkey under Thrace region conditions. Turk J Vet Anim Sci. 16:403–414.
- Dorrance MJ, Bourne J. 1980. An evaluation of anti-coyote electric fencing. J Range Manage. 33:385–387.
- Fresnaye J, Lensky Y. 1961. Methodes d’appréciation des surfaces de vain dans les colonies d’abeilles. Ann Abeille. 4:369–376.
- Genç F, Aksoy A. 1993. Some of the correlations between the colony development and honey production on the honeybee (Apis mellifera L.) colonies. Apiacta. 28:33–41.
- Genç F, Dulger C, Kutluca S, Dodologlu A. 1999. Comparison of behavior features of Caucasian, Middle Anatolia and Erzurum Honeybee (Apis mellifera L.) genotypes in Erzurum conditions. Turk I Vet Anim Sci. 23:651–656.
- Giray T, Guzman NE, Aron CW, Zelinsky B, Fahrbach SE, Robinson GE. 2000. Genetic variation in worker temporal polyethism and colony defensiveness in the honey bee, Apis mellifera. Behav Ecol. 11:44–55.
- Gösterit A, Çıkılı Y, Kekeçoğlu M. 2012. Comparison of swarming tendency and defensive behavior of Yığılca local and other commonly used honeybee genotypes in Turkey. Kafkas Üniv Vet Fak Derg. 18:595–598.
- Hunt GJ, Guzmán-Novoa E, Uribe-Rubio JL, Prieto-Merlos D. 2003. Genotype–environment interactions in honeybee guarding behaviour. Anim Behav. 66:459–467.
- Hygnstrom S, Craven S. 1996. Bear damage and abatement in Wisconsin. Madison: University of Wisconsin–Extension, R-10-96-2M-.75.
- Kandemir İ, Kence M, Kenc A. 2000. Genetic and morphological variation in honeybee (Apis mellifera L.) population in Turkey. Apidologie. 31:343–356.
- Masterson L. 2006. Living with bears: a practical guide to bear country. Masonville (CO): PixyJack Press.
- Meadows LE, Andelt WF, Beck TI. 1998. Managing bear damage to bee hives. Colorado State University Cooperative Extension Report No. 6.5619. Fort Collins (CO): Colorado State University.
- Morse RA, Calderone NW. 2000. The value of honey bees as pollinators of U.S. crops in 2000. Bee Cult. 128:1–15.
- Pekel E, Doğaroğlu M. 1987. Beekeeping efficiency studies. Turkey Beekeeping Congress I. 22–24 January 1980, KOTB Teş. Des. Gn. Md., Pub. No: 154, TEDGEM 14, 65–70.
- Stort AC. 1974. Genetic study of aggressiveness in two subspecies of Apis mellifera in Brazil. J Apic Res. 13:33–38.
- Wray MK, Mattila HR, Seeley TD. 2011. Collective personalities in honeybee colonies are linked to colony fitness. Anim Behav. 81:559–568.