
Abstract
The aim was to determine the absence of gluten in pet food samples marked as ‘grain-free’ and ‘gluten-free’ diets, to assess the reliability of manufacturer labelling of such products. A total of 15 diets labelled as grain- or gluten-free and 2 commercial diets containing wheat were sampled. An analytical procedure using high-pressure liquid chromatography coupled with mass spectrometry with high power of resolution was developed and applied to determine specific markers of wheat gluten. The results are expressed as mg of wheat flour type ‘00’ present in 1 g of feed. The quantification limit (LOQ) obtained in the flour for ion m/z 894.5043, z = 2, is 4 mg of flour per gram. In 14 out of the 15 samples from a grain- or gluten-free diet the quantifier ion signal was < LOQ, while in 1 out of the 15 samples 10 mg of flour/g feed were measured.
Adverse reaction to gluten in dogs have been documented in certain breeds
Gluten is tricky to detect and measure in pet food
Contamination of gluten in pet food samples marked as ‘grain-free’ and ‘gluten-free’ diets
An analytical procedure was developed using HPLC coupled with HRMS
Highlights
Keywords:
Introduction
Anthropomorphism of companion animals has virtually turned them into family members (Boni Citation2008). Pet food manufacturers have responded to this family addition with trendy diets that align questionably with animal health and physiology. One of the best known and advertised is the grain-free diet that the industry claims as high protein ‘ancestral diets’ purportedly healthier than their grain-inclusive counterparts, mainly containing gluten (Conway and Saker Citation2018). Gluten is a protein fraction of cereal grains such as wheat, barley, and rye. Wheat gluten is composed of gliadins, monomeric low-molecular-weight proteins, and glutenins, high-molecular-weight polymeric proteins. These proteins combine to forge a network that imparts extensibility and elasticity to any food matrix containing it. Such technological properties are interesting especially for bread making.
Wheat gluten can produce symptoms of food allergy, including coeliac disease or non-coeliac gluten sensitivity, in humans (Roncoroni et al. Citation2019). The only possible treatment is total exclusion of gluten from the diet. In humans, exclusion treatment is relatively easy with the option of gluten-free foods. Many domestic carnivores, however, consume complex, industrially produced foods that contain myriad ingredients and by-products of often uncertain composition. Reliable analytical techniques are therefore needed that can detect traces of gluten in food matrices as complex and processed as pet kibbles.
Gluten is tricky to detect and measure in pet food owing to difficulties in quantifying proteins and sampling problems (USDA Threshold Working Group Citation2008). The detection of gluten in products containing partially hydrolysed gluten (Tanner et al. Citation2013) and in heated or extruded products (Mena et al. Citation2012) is particularly challenging. The recommended commercial assay (Codex Committee of Methods of Analysis and Sampling Citation2015) using enzyme-linked immunosorbent assays (ELISA) (Valdés et al. Citation2003) is subject to cross-reactivity with complex matrices like pet food; in addition, the assay does not distinguish between the gluten from wheat and that from other cereals. For this reason, analytical methods based on HPLC-HRMS result more reliable (Scherf and Poms Citation2016).
There is continuing debate about the threshold of gluten contamination in food. The Codex Alimentarius regulates the maximum gluten content in food products labelled ‘gluten-free’ (CODEX STAN 118-1979 Citation2008). The U.S. Food and Drug Administration (USDA Threshold Working Group Citation2008) set the maximum acceptable gluten level at 20 mg/kg. This threshold has also been adopted in EU legislation (European Commission Citation2009; Ludvigsson et al. Citation2013). Currently, there is no law that regulates gluten levels in pet food labelled ‘grain-free’, however.
The production of the ‘grain free’ pet-food is not related only to the gluten-sensitive enterophaty. For example there is an interest of dog and cat owners in reducing cereals in the diet as demonstrated by the increasing use of ‘bones and raw food’ diets. Some of these diets are also considered low-glycemic-index diets able to reduce the post-prandial glycemic response (Musco et al. Citation2017). In any case, the gluten seems to be the best marker to determine the inclusion or contamination with cereals of a grain- or gluten-free diet.
To date, confirmed reports of gluten-sensitive enteropathy (GSE), a rare food hypersensitivity caused by an adverse reaction to gluten in dogs, have been documented only in certain breeds (Davies Citation2016): certain lines of Irish Setter (Batt et al. Citation1984). An extremely uncommon diagnosis in clinical practice, its pathogenesis has been better defined in recent years, although it remains unclear whether GSE involves an aberrant immune response to gluten and/or a direct toxic effect of the gluten itself (Elwood et al. Citation1996; Citation1997). Clinically, it shares similarities with human coeliac disease but its pathogenesis is different. Diagnosis can be formulated as in other food hypersensitivities. Treatment involves adoption of a gluten-free diet (avoiding wheat, rye, barley, oats, and triticale, which is a hybrid of wheat and rye). We are unaware of the extent to which gluten is a potential allergen in other breeds. The literature describes two other expressions of gluten intolerance: epileptiform syndrome in the Border Terrier (Black et al. Citation2014; Lowrie et al. Citation2015) and the familiar protein-losing enteropathy of the Soft-Coated Wheaten Terriers (Vaden et al. Citation2000).
This complex scenario is further complicated by the fact that establishing a direct cause and effect relationship between the intake of a dietary component in companion animals and a disease is challenging because pet food is a complex mixture of nutrients that interact with each other and because of potential cross-contamination of proteins from origins not mentioned on the product label (Ricci et al. Citation2018). To address these problems, the aim of the present study was to assess by a specific HPLC-HRMS method the gluten contamination of canned and dry grain-free commercial food for cats and dogs.
Materials and methods
Chemicals
Reagents and HPLC grade solvents were purchased from Sigma Aldrich (Milan, Italy) and used as received. The HPLC grade water was from MilliQ System Academic (Millipore, Vimodrone, Italy). The HPLC grade acetonitrile was from VWR (Milan, Italy). Wheat flour ‘00’ was purchased in a local market and used as reference standard.
Diet formulation
In are reported the composition of the 2 commercial diets containing wheat and of the 15 diets labelled as grain- or gluten-free. The ingredients of the 17 studied diets are listed below:
Table 1. Pet food samples and their composition.
Cereals, chicken meat and derivatives, oils and fats, dried beetroot pulp, hydrolysed animal proteins, natural chestnut extract, mineral substances, additives.
Cereals, beef and derivatives, oils and fats, dried beetroot pulp, hydrolysed animal proteins, natural chestnut extract, mineral substances, additives.
Fresh turkey meat, dehydrated deer meat, peas, potatoes, chicken fat and turkey, field beans, dehydrated chicken meat, dehydrated fish meal, flax seed, dried beetroot pulp, brewer's yeast, algae flour marine, yeast, Yucca schidigera, Silybum marianum, Rosa canina, Rosa pendulina, additives.
Fresh fish, dehydrated chicken meat, peas, potatoes, chicken fat, field beans, flax seed, dried beetroot pulp, brewer's yeast, seaweed flour, dried chicory pulp, yeast, Yucca schidigera, Silybum marianum, Ananas sativus, Punica granatum, Rosa canina, Rosa pendulina, Rubus ideaus, glucosamine sulphate, chondroitin sulphate, additives.
Fresh mackerel, buffalo dehydrated meat, peas, potatoes, chicken fat, dehydrated pork meat, field beans, flax seed, dried beetroot pulp, brewer's yeast, seaweed meal, fructooligosaccharides, yeast, Yucca schidigera, Taraxacum officinale, Ananas sativus, Punica granatum, additives.
Fresh tuna, dehydrated lamb meat, peas, potatoes, chicken fat, dehydrated pork meat, field beans, flax seed, dried beetroot pulp, brewer's yeast, seaweed meal, fructooligosaccharides, yeast, Yucca schidigera, Taraxacum officinale, Ananas sativus, Punica granatum, additives.
Fresh rabbit meat, processed rabbit proteins, dried potatoes, animal fat, rabbit hydrolysed animal protein, potato protein, dried beet pulp, lignocellulose, dried carob flour, brewer's yeast, calcium carbonate, polyphosphate sodium, chicory inulin, dried citrus gris, Yucca schidigera, additives.
Fresh chicken meat, dehydrated chicken, dried potatoes, hydrolysed chicken liver, animal fat, dried carob flour, lignocellulose, potato protein, brewer's yeast, dried beet pulp, fish oil, whole eggs, polyphosphate sodium, chicory inulin, dried citrus, Yucca schidigera, additives.
Fresh salmon, dehydrated salmon, dried potatoes, hydrolysed salmon protein, animal fat, lignocellulose, potato protein, micronized dried carob flour, brewer's yeast, dried beetroot pulp, sodium polyphosphate, chicory inulin, dried citrus fruit, Yucca schidigera, additives.
Beef, vegetable gelatine, sodium chloride, potassium chloride, calcium carbonate, xylose, brewer's yeast, additives.
Lamb meat, vegetable gelatine, sodium chloride, potassium chloride, calcium carbonate, xylose, brewer's yeast, Salvia officinalis, Rosmarinus officinalis, additives.
Salmon, potatoes, vegetable gelatine, sodium chloride, potassium chloride, calcium carbonate, xylose, brewer's yeast, Salvia officinalis, Rosmarinus officinalis, additives.
Pork, peas, vegetable gelatine, sodium chloride, potassium chloride, calcium carbonate, xylose, brewer's yeast, additives.
Chicken meat, minerals, vegetable gelatine, xylose, additives.
Salmon, minerals, vegetable gelatine, xylose, additives.
White fish, minerals, vegetable gelatine, xylose, additives.
Beef, minerals, vegetable gelatine, xylose, additives.
Sample preparation
A total of 0.5 g of each sample was placed in a 50 mL Falcon tube; 5.0 mL of extracting buffer (50% ethanol, 50% of a solution of TRIS 0.2 M pH and 2 M urea) were added; the samples were vigorously stirred and subjected to extraction in an ultrasonic bath for 1 hour at 60 °C, then cooled to room temperature and centrifuged (17000 × g). 500 μL of supernatant was reduced with dithiothreitol, alkylated with iodoacetamide; 1350 μL of a 100 mM ammonium bicarbonate solution were added until pH 8 was reached; the supernatants were digested with trypsin for 2 hours at 40 °C. Digestion was stopped with formic acid and the samples were analysed by HPLC-HRMS.
HPLC-HRMS
Analysis of the feed samples for wheat gluten search was performed on a high-pressure liquid chromatography (HPLC) instrument coupled via electro spray ionisation to a hybrid high-resolution mass spectrometry (HRMS) Orbitrap Fusion.
The characteristics of the instruments are:
HPLC system: Ultimate 3000 (Thermo Scientific, Milan, Italy).
Chromatographic column: Luna C18(2), 100 Å, 150 × 2.1 mm, 3 μm particle size (Phenomenex Srl, Bologna, Italy). Column temperature 40 °C. Eluents: A = 0.1% formic acid in water, B = formic acid 0.1% in acetonitrile/water 8/2. Flow 200 μL/min. Separation gradient 0–60 min 5–95% B, maintained for 3 min then followed by reconditioning for 20 min. Injected volume 20 μL.
HRMS tool: Orbitrap Fusion (Thermo Scientific).
Full-mass range 350–2000 m/z. Full mass resolution 60000. MS/MS parameters: type of HCD fragmentation (high energy collision dissociation), CE (collision energy) 35. Table reports the amino acid sequence and m/z ratio of the selected peptides. Spray voltage positive ion mode 4000 V. Sheath gas 35 arbitrary units. Auxiliary gas 20 arbitrary units. Ion transfer temperature 325 °C. Vaporisation temperature 250 °C.
Table 2. Peptides selected for quantitative determination of wheat gluten in pet food samples (the letters denote the following amino acids: A: alanine; I: isoleucine; Y: tyrosine; S: serine; V: valine; L: leucine; Q: glutamine; E: glutamic acid; R: arginine; C: cysteine; G: glycine; M: methionine; K: lysine; H: histidine; T: treonin; F: phenylalanine; P: proline).
Set-up of the analytical method
The analytical method was developed using wheat flour type ‘00’ as the reference standard. A calibration curve was prepared by varying the weight of the wheat flour: 0.5, 0.4, 0.3, and 0.1 g, respectively. The calibration curve was repeated three times, verifying that the difference between the slope of each curve was minor than 20% and the repeatability (intra day) and reproducibility (inter day) were checked by repeating standard addition of a clean matrix at 0.1 g and 0.5 g of wheat flour as quality controls (QCs). The wheat flour was then processed as the sample (see section Sample Preparation). The calibration line was made using the area under the curve of the total ion current signal of the MS/MS event on the ion m/z 894.5043, z = 2, ion described in Table as the quantifier. Figure shows the obtained calibration line, its equation, and the correlation coefficient R2; Table lists the m/z ratios and the type of fragment ions derived from the MS/MS of the quantifier ion.
Figure 1. Calibration curve using grams of wheat flour type ‘00’ as the reference standard.
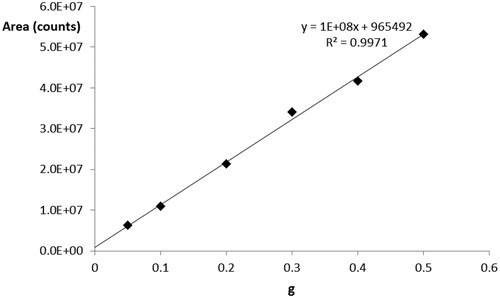
Table 3. m/z and type of fragment ions derived from the MS/MS of the quantifier ion m/z = 894.5043, z = 2. The MS/MS spectrum is shown in Figure .
Results and discussion
Little research has been published describing the quantification of gluten residues in food. Mamone et al. (Citation2000) used HPLC–MS based methods for a qualitative and quantitative analysis of wheat gluten proteins. They suggested that in order to detect traces of wheat in gluten-free food preparations for coeliac patients, the high level and the molecular mass of two components (γ2- and γ3-gliadin), which make up about half of the gliadin fraction, should be used as markers. Wieser et al. (Citation1998) developed a procedure for the routine quantitation of all protein types in wheat flour in relative and absolute quantities, including the optimisation of protein extraction and of quantitative analysis by RP-HPLC. Wieser (Citation2000) compared gluten proteins (gliadins and glutenin subunits) from different wheat species. DuPont et al. (Citation2005) performed sequential extraction of small samples of wheat flour and quantitative recovery of gliadins, glutenins, and other proteins.
HPLC–MS analysis of the cereal proteome has been used for the identification of cereal allergens (Fasoli et al. Citation2009), the investigation of genetically modified varieties (Lopez et al. Citation2009), and the characterisation of prolamin fraction for cereal traceability (Muccilli et al. Citation2011). The prolamins, which are the major determinant of gluten properties and the main factor that triggers coeliac disease (Mamone et al. Citation2011; Colgrave et al. Citation2012), have amino acid sequences with a long repeating motif and few tryptic cleavage sites, leading to a pool of peptides with unfavourable MS/MS characteristics (Qian et al. Citation2008; Muccilli et al. Citation2010).
In the present study, the limit of quantitation (LOQ) obtained in the wheat flour for the ion m/z 894.5043, z = 2, was 4 mg of wheat flour per gram of feed. Taking into account the calibration line and the LOQ obtained, the samples were prepared and analysed using the HPLC-HRMS method. Table presents the results obtained with the control samples (code 1, with chicken for dog, and code 2, with beef for dog) are expressed as mg of wheat flour type ‘00’ present in 1 g of feed. For example, in the code 1 feed with chicken for dog, there were 50.3 mg of wheat flour, and then wheat for each gram of feed. In the second column of the results, they are expressed as mg of proteins for each g of feed, given that the wheat flour contains 9% of gluten proteins (gliadins and glutenins).
Table 4. Analysis of pet food samples expressed as mg (±standard deviation) of wheat flour type ‘00’ present in 1 g of food, first column, or as mg of protein per g of food (ND, not detectable, <LOQ).
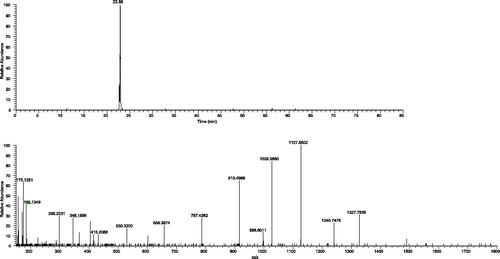
Figures and show the chromatograms and the MS/MS spectrum of the m/z ion 894.5043, z = 2, of a standard type 00 wheat flour (0.3 g) and sample code 1, with chicken for dog. Table shows that, in sample code 8, chicken with potatoes for cat (grain-free sample), we were able to quantify the presence of gluten in wheat: 10.0 mg of type 00 wheat flour in 1 g of feed, corresponding to 0.9 mg of gluten protein per gram of feed. Figure shows the chromatographic signal and the MS/MS spectrum of the quantifier ion in the sample code 8. In all the remaining samples, the quantifier ion signal was below the quantification limit ([ND], not detectable). In these cases, the presence of wheat within the detection limit of 0.4% expressed as wheat flour can, therefore, be excluded.
Figure 2. Chromatogram and MS/MS spectrum of ion m/z 894.5043, z = 2, in standard of wheat flour type 00, weight 0.3 grams.
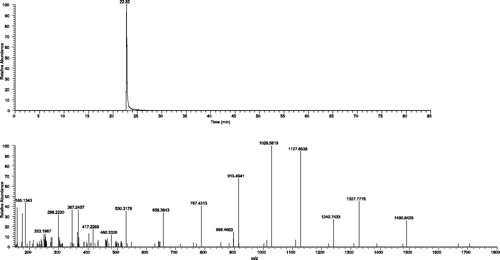
Figure 3. Chromatogram and MS/MS spectrum of ion m/z 894.5043, z = 2, in sample feed code 1 (feed based on chicken for dog).
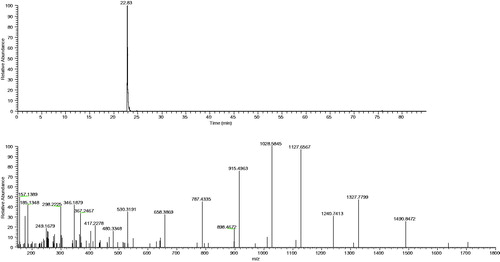
Figure 4. Chromatogram and MS/MS spectrum of ion m/z 894.5043, z = 2, in sample feed code 8 (feed based on chicken with potatoes for cat).
Our data show that the method is sensitive and reliable in quantifying gluten levels even in a complex matrix such as pet food.The lack of confirmation of gluten in most of the foods analysed indicates that the pet food product was ‘grain-free’ as reported on the label.
The reason for the high levels detected in sample code 8 remains to be clarified. We believe they probably result from accidental addition of an ingredient containing gluten during production or from contamination of the production line. Alternatively, it is also possible that flours containing gluten were used in the preparation of the premix. In both cases, the only way to clarify this doubt would be to analyse all the raw materials, including the vitamin-mineral premix, and to verify the critical points in the production line.
To our knowledge this study is the first to determine the absence of gluten residues in pet food samples labelled as grain-free. Investigations on gluten content in canned and dry grain-free commercial food for pets are scarce. Allred and Park (Citation2012) used a rapid immunochromatographic screening method (EZ Gluten kit) for the qualitative detection of gluten in dog food (canned chicken and rice) as gluten-free matrixes and in dry dog food (with tested gluten content of 434 ppm by quantitative ELISA).
Several small studies on the determination of gluten in gluten-free products intended for coeliac patients have reported that contamination does occur (Koerner et al. Citation2011, Citation2013). The level of contamination was low in most cases and probably not harmful. Larger amounts of gluten in such products have been reported in a few cases, however.
Valdés et al. (Citation2003) tested more than 3000 products using a novel sandwich ELISA protocol for low-level gluten determination and found that one-third of gluten-free foods in Europe contained more than 20 ppm of gluten. Gélinas et al. (Citation2008) estimated gluten contamination of 148 cereal-based foods available in Canada, of which about half the samples were labelled as gluten-free. They found that 23 cereal-based foods (16 regular and 7 gluten-free foods) contained more than 20 mg/kg of gluten and that the least contaminated were the gluten-free foods (<50 mg/kg of gluten), whereas the most contaminated were regular food samples made from oats or buckwheat.
Gluten contamination of commercial oat products with barley, rye or wheat during harvesting, transporting, milling, and processing constitutes a major concern for coeliac disease sufferers in the United States (Thompson Citation2004) and Sweden (Størstud et al. Citation2003). Thompson (Citation2004) determined the gluten content in four different lots of three brands of oats and found that none of them could be relied on to be gluten-free. The risk of gluten contamination in non-gluten cereals and in oat products was also evaluated by Størstud et al. (Citation2003). Using a commercially available ELISA, they determined the degree of gluten contamination in 88 oat products and 22 naturally gluten-free products (based on maize, rice, millet or buckwheat). They found that the level of contamination was low in most cases and that products resulting free from contamination were all oat products claiming ‘100% pure’, 78% of the rolled oats, 21% of the other oat products, 71% of the rice samples, and 80% of the millet samples. Nonetheless, they found higher levels of contamination (<200 mg/kg gluten) in 7.5% of the rolled oats, 18% of the other oat products, 50% of the maize, and 17% of the buckwheat samples. Altogether, 14% of the naturally gluten-free products and 13% of the ordinary oat products were strongly contaminated.
Collin et al. (Citation2004) analysed by ELISA the gluten content of 24 starch-based and gluten-free wheat and 59 naturally gluten-free products and found trace amounts of gluten (<10 mg/kg) in 2 of the 24 starch-derived wheat flours and in 42 of the 59 naturally gluten-free products, respectively. Two starch-based wheat flours and 5 naturally gluten-free products contained more than 100 mg/kg of gluten.
Conclusions
The present study demonstrated that HPLC-HRMS is a reliable method for the identification of gluten residues or contamination in pet food and provides preliminary evidence for the potential use of ‘grain-free’ labelled diets in a dietary elimination trial for the diagnosis of GSE in dogs. However, 1 out of the 15 samples (6.7%) tested turned out to contain a significant quantity of gluten, with levels suggesting more than an accidental contamination, perhaps via the premix ingredients. The pet food industry ought to be aware of this risk. Further studies on a larger number of samples and on a selection of the most common premixes are warranted to test this hypothesis.
Acknowledgments
The authors would like to thank Kenneth Britsch for linguistic revision of the manuscript and Chiara Bianchi for her technical support. Pet foods were kindly offered by Arcaplanet.
Disclosure statement
The authors report no conflicts of interest. The authors alone are responsible for the content and writing of this article.
References
- Allred LK, Park ES. 2012. EZ Gluten for the qualitative detection of gluten in foods, beverages, and environmental surfaces. J AOAC Int. 95(4):1106–1117.
- Batt RM, Carter MW, McLean L. 1984. Morphological and biochemical studies of a naturally occurring enteropathy in the Irish setter dog: a comparison with celiac disease in man. Res Vet Sci. 37(3):339–346.
- Black V, Garosi L, Lowrie M, Harvey RJ, Gale J. 2014. Phenotypic characterisation of canine epileptoid cramping syndrome in the Border terrier. J Small Anim Pract. 55(2):102–107.
- Boni SE. 2008. Anthropomorphism: how it affects the human–canine bond. J Appl Companion Anim Behav. 2:16–21.
- Codex Committee of Methods of Analysis and Sampling. 2015. MAS/36 CRD/15. Report on the 36th session in Budapest, Hungary, on 23-27 February 2015.
- CODEX STAN 118-1979. 2008. Standard for foods for special dietary use for persons intolerant to gluten. Codex Alimentarius, International Food Standards; [Accessed 2010 July 02]. http://www.codexalimentarius.net.
- Colgrave ML, Goswami H, Howitt CA, Tanner GJ. 2012. What is in a beer? Proteomic characterization and relative quantification of hordein (gluten) in beer. J Proteome Res. 11(1):386–396.
- Collin P, Thorell L, Kaukinen K, Mäki M. 2004. The safe threshold for gluten contamination in gluten-free products. Can trace amounts be accepted in the treatment of celiac disease? Aliment Pharmacol Ther. 19(12):1277–1283.
- Conway DM, Saker KE. 2018. Consumer attitude toward the environmental sustainability of grain-free pet foods. Front Vet Sci. 5:170
- Davies M. 2016. Gluten exposure and multisystem disease in dogs. Vet Rec. 179(22):570–571.
- DuPont FM, Chan R, Lopez R, Vensel WH. 2005. Sequential extraction and quantitative recovery of gliadins, glutenins, and other proteins from small samples of wheat flour. J Agric Food Chem. 53(5):1575–1584.
- Elwood CM, Garden OA, Hamblin AS, Batt RM. 1997. Gluten challenge in Irish Setters with gluten sensitive enteropathy (GSE): Peripheral leucocyte responses. In: Proceedings of the European Society for Veterinary Internal Medicine Congress, Lyon, France, pp.157.
- Elwood CM, Garden OA, Manners HK, Hamblin AS, Batt RM. 1996. Altered populations of T-lymphocytes in the jejunal mucosa of Irish Setter dogs with gluten sensitive enteropathy. Gastroenterology. 110:A903.
- European Commission. 2009. Commission Regulation (EC) No 41/2009 of 20 January 2009 concerning the composition and labelling of foodstuffs suitable for people intolerant to gluten. Off J Eur Union. 16:3–5.
- Fasoli E, Pastorello EA, Farioli L, Scibilia J, Aldini G, Carini M, Marocco A, Boschetti E, Righetti PG. 2009. Searching for allergens in maize kernels via proteomic tools. J Proteomic. 72(3):501–510.
- Gélinas P, McKinnon CM, Mena MC, Méndez E. 2008. Gluten contamination of cereal foods in Canada. Int J Food Sci Tech. 43(7):1245–1252.
- Koerner TB, Cléroux C, Poirier C, Cantin I, Alimkulov A, Elamparo H. 2011. Gluten contamination in the Canadian commercial oat supply. Food Addit Contam Part A. 28(6):705–710.
- Koerner TB, Cléroux C, Poirier C, Cantin I, La Vieille S, Hayward S, Dubois S. 2013. Gluten contamination of naturally gluten-free flours and starches used by Canadians with celiac disease. Food Addit Contam Part A. 30(12):2017–2021.
- Lopez MCG, Garcia-Cañas V, Alegre M. 2009. Reversed-phase high-performance liquid chromatography–electrospray mass spectrometry profiling of transgenic and non-transgenic maize for cultivar characterization. J Chromatogr A. 1216:7222–7228.
- Lowrie M, Garden OA, Hadjivassiliou M, Harvey RJ, Sanders DS, Powell R, Garosi L. 2015. The clinical and serological effect of a gluten‐free diet in border terriers with epileptoid cramping syndrome. J Vet Intern Med. 29(6):1564–1568.
- Ludvigsson JF, Leffler DA, Bai JC, Biagi F, Fasano A, Green PH, Hadjivassiliou M, Kaukinen K, Kelly CP, Leonard JN, et al. 2013. The Oslo definitions for coeliac disease and related terms. Gut. 62(1):43–52.
- Mamone G, Ferranti P, Chianese L, Scafuri L, Addeo F. 2000. Qualitative and quantitative analysis of wheat gluten proteins by liquid chromatography and electrospray mass spectrometry. Rapid Commun Mass Spectrom. 14(10):897–904.
- Mamone G, Picariello G, Addeo F, Ferranti P. 2011. Proteomic analysis in allergy and intolerance to wheat products. Expert Rev Proteomic. 8(1):95–115.
- Mena MC, Lombardía M, Hernando A, Méndez E, Albar JP. 2012. Comprehensive analysis of gluten in processed foods using a new extraction method and a competitive ELISA based on the R5 antibody. Talanta. 91:33–40.
- Muccilli V, Cunsolo V, Saletti R, Foti S, Margiotta B, Scossa F, Masci S, Lafiandra D. 2010. Characterisation of a specific class of typical low molecular weight glutenin subunits of durum wheat by a proteomic approach. J Agric Food Chem. 51:134–139.
- Muccilli V, Lo Bianco M, Cunsolo V, Saletti R, Gallo G, Foti S. 2011. High molecular weight glutenin subunits in some durum wheat cultivars investigated by means of mass spectrometric techniques. J Agric Food Chem. 59(22):12226–12237.
- Musco N, Calabro S, Tudisco R, Muhammad G, Grossi M, Addi L, Moniello G, Lombardi P, Cutrignelli MI. 2017. Diet effect on short- and long-term glycaemic response in adult healthy cats. Vet Ital. 53(2):141–145.
- Qian YW, Preston K, Krokhin O, Mellish J, Ens W. 2008. Characterization of wheat gluten proteins by HPLC and MALDI TOF mass spectrometry. J Am Soc Mass Spectrom. 19(10):1542–1550.
- Ricci R, Conficoni D, Morelli G, Losasso C, Alberghini L, Giaccone V, Ricci A, Andrighetto I. 2018. Undeclared animal species in dry and wet novel and hydrolyzed protein diets for dogs and cats detected by microarray analysis. BMC Vet Res. 14(1):209.
- Roncoroni L, Bascuñán KA, Vecchi M, Doneda L, Bardella MT, Lombardo V, Scricciolo A, Branchi F, Elli L. 2019. Exposure to different amounts of dietary gluten in patients with non-celiac gluten sensitivity (NCGS): An exploratory study. Nutrients. 11(1):136.
- Scherf KA, Poms RE. 2016. Recent developments in analytical methods for tracing gluten. J Cereal Sci. 67:112–122.
- Størstud S, Malmheden I, Lenner RA. 2003. Gluten contamination in oat products and products naturally free from gluten. Eur Food Res Technol. 217:481–485.
- Tanner GJ, Colgrave ML, Blundell MJ, Goswami HP, Howitt CA. 2013. Measuring hordein (gluten) in beer e a comparison of ELISA and mass spectrometry. PlosOne. 8(2):e56452.
- Thompson T. 2004. Gluten contamination of commercial oat products in the United States. N Engl J Med. 351(19):2021–2022.
- USDA Threshold Working Group. 2008. Approaches to establish thresholds for major food allergens and for gluten in food. J Food Prot. 71:1043–1088.
- Vaden SL, Sellon RK, Melgarejo LT, Williams DA, Trogdon MM, Van Camp SD, Argenzio RA. 2000. Evaluation of intestinal permeability and gluten sensitivity in Soft-Coated Wheaten Terriers with familial protein-losing enteropathy, protein-losing nephropathy, or both. Am J Vet Res. 61(5):518–524.
- Valdés I, García E, Llorente M, Méndez E. 2003. Innovative approach to low-level gluten determination in foods using a novel sandwich enzyme-linked immunoabsorbent assay protocol. Eur J Gastroenterol Hepatol. 15(5):465–474.
- Wieser H. 2000. Comparative investigations of gluten proteins from different wheat species. I. Qualitative and quantitative composition of gluten protein types. Eur Food Res Technol. 211(4):262–268.
- Wieser H, Antes S, Seilmeier W. 1998. Quantitative determination of gluten protein types in wheat flour by reversed‐phase high‐performance liquid chromatography. Cer Chem. 75(5):644–650.