
 ?Mathematical formulae have been encoded as MathML and are displayed in this HTML version using MathJax in order to improve their display. Uncheck the box to turn MathJax off. This feature requires Javascript. Click on a formula to zoom.
Abstract
Native goat breeds play an important role both in the safeguarding of biodiversity and the development of local economy. This study aimed to evaluate milk coagulation properties (MCP) of local (Garganica, Girgentana, Maltese, Mediterranean Red) and cosmopolitan (Saanen) goat breeds. From May to August 2018, 46 goats were sampled monthly in an experimental farm; milk samples were analysed for fat, protein and lactose percentages, pH, SCC and MCP. Data were evaluated through a mixed linear model with repeated measures, including breed, month of lactation and parity as fixed effects. Month of lactation affected all studied traits, and breed affected MCP, protein percentage, lactose percentage and pH. Milk composition and coagulation properties were better in local breeds than Saanen. In particular, milk of local breeds was richer in protein percentage, and coagulated and reached 20 mm of curd firmness on average 3.14 and 2.56 min earlier than Saanen, respectively. Moreover, the firmest curd was observed in Girgentana (31.44 mm) and the weakest in Garganica (21.72 mm). Rennet coagulation time and curd firmness decreased towards the end of lactation, differing significantly between May (10.62 min and 31.69 mm, respectively) and August (8.33 min and 20.69 mm, respectively), whereas curd-firming time only differed between May and June–July. In conclusion, milk of local breeds showed better milk coagulation ability than the cosmopolitan breed.
Breed and month of lactation were important sources of variation of goat MCP.
Local goat breeds showed better MCP than Saanen.
Valorisation of the milk from the local breeds might be a tool to preserve native genetic resources.
Highlights
Introduction
European goat milk production is mostly transformed into goat cheese (de Asís Ruiz Morales et al. Citation2019) and in the last decade the Italian goat cheese production has increased by 32% (FAOSTAT Citation2019). The interest in goat milk products is increasing due to their functional properties, high nutritional value, therapeutic value and dietary characteristics (de Asís Ruiz Morales et al. Citation2019; Miller and Lu Citation2019; Sepe and Argüello Citation2019). Moreover, goat cheese in southerner Europe is considered part of its gastronomic, ethnological and cultural heritage (de Asís Ruiz Morales et al. Citation2019) and dairy goat products demand is rising in traditional and new markets (Miller and Lu Citation2019).
The efficiency of milk manufacturing into cheese is generally related to many intrinsic milk characteristics and cheese-making technologies; one of the crucial points is the coagulation process which is related to the interaction between milk and rennet. This process is well described by the milk coagulation properties (MCP), namely rennet coagulation time (RCT, min), curd-firming time (k20, min) and curd firmness 30 min after rennet addition to milk (a30, mm; McMahon and Brown Citation1982). In general, milk with shorter RCT and k20 and greater a30 is desirable to produce cheese ( Ikonen et al., Citation2004). In small ruminants, published papers dealing with MCP in sheep and goats are scarcer (56 and 69 documents for sheep and goats, respectively) than in cows (256 documents; Pazzola Citation2019). Management is the main factor influencing MCP in goat milk (37% and 69% of the total variability for RCT and a30, respectively; Pazzola Citation2019). Moreover, the greater milk fat content, the better MCP; the greater milk protein content, more delayed RCT; and the greater milk casein content, higher a30 (Pazzola Citation2019).
There are very few studies that compare MCP of autochthonous and cosmopolitan goat breeds. Recently, Vacca et al. (Citation2018) observed better MCP for the Mediterranean (Murciano-Granadina, Maltese, Sarda and Sarda Primitiva) than Alpines (Saanen and Camosciata delle Alpi) goats. A study that we have recently published reported differences in goat milk composition between Italian local breeds (Girgentana, Garganica, Jonica, Maltese and Mediterranean Red) and Saanen (Currò et al. Citation2019a, Citation2019b) which might result in differences for MCP. Moreover, the characterisation of technological milk traits may contribute to valorise native breeds and mitigate the loss of genetic variability. Therefore, the aim of the present study was to compare MCP of Italian local goat breeds (Garganica, Girgentana, Maltese and Mediterranean Red) with the cosmopolitan Saanen reared under the same farm conditions.
Materials and methods
Animals and management conditions
The study was conducted from May to August 2018 in the experimental farm of the Council for Agricultural Research and Economics, Research Unit for the Extensive Animal Husbandry (CREA-ZOE, Potenza, Italy). A general description of the breeds considered in the present study is reported in Currò et al. (Citation2019b). Experimental procedures and animal care conditions followed the recommendations of European Union directive 86/609/EEC and were approved by the Institutional Animal Care and Use Committee of the Department of Veterinary Medicine of University of Naples Federico II.
A total of 46 dairy goats of 5 breeds (Garganica, GA, n = 10; Girgentana, GI, n = 9; Maltese, MA, n = 10; Mediterranean Red, MR, n = 8 and Saanen, SA, n = 9) classified as primiparous (first parity) or multiparous (second to five parity) were enrolled in the study. All does, under the same managerial conditions, had single birthing in February and each kid was kept with the mother until 40 days of age.
Does grazed together in a natural pasture 8 h/day and were supplemented with hay ad libitum in the shelter, composed by 60–65% of grasses (mainly Avena sativa L.) and 35–40% of legumes (mainly Vicia sativa L.). Goats also received a commercial concentrate in the milking parlour composed of maize, wheat bran and flour, maize flour, sunflower germ flour, sugar beet molasses, soybean meal (48% crude protein), calcium carbonate, sodium chloride, sodium bicarbonate, I (5 mg/kg), Mn (50 mg/kg) and Zn (125 mg/kg). The commercial concentrate amount administered ranged from 0.6 to 0.7 kg/day for local breeds and from 0.9 to 1.2 kg/day for Saanen breed, being the greatest amount at the beginning and the lowest at the end of the trial according to NRC (2007) recommendations. Hay and concentrate chemical composition and nutritional value are reported in Table . Does body weight, body condition score and concentrate administration during the study was comparable with those reported by Currò et al. (Citation2019b).
Table 1. Hay and concentrate chemical composition and energy content fed to the goats during the trial.
Milking and sample collection
Does were milked twice a day (morning and evening) in a double 24-stall herringbone low-line milk pipeline milking parlour (Alfa Laval Agri; Monza, Italy) equipped with recording jars and electronic pulsators at a vacuum of 38 kPa, 90 pulses/min and 60% pulsation ratio. The pre-milking phase consisted of forestripping without any preparation of udder and teats. None of the goats was affected by mastitis throughout the study according to their somatic cell score (SCS). Individual milk samples (50 mL) were collected monthly during the morning milking from May to August. In July, two milk samples were lost (1 SA and 1 GA), and, in August, six does (2 does per GA, MR and SA breeds) entered in the dry period. Thus the total number of milk samples collected was 176.
Milk chemical analysis and MCP determination
Milk samples were stored at 4 °C, transferred to the milk laboratory of the Breeders Association of Veneto Region (Padova, Italy) and analysed within 24 h from sampling. Fat, protein and lactose percentages were determined using MilkoScan FT6000 (Foss Electric, Hillerød, Denmark), and pH was measured by a digital pH metre (Crison pH-Burette 24, Crison Instruments SA, Barcelona, Spain). Somatic cell count (SCC, cells/mL) was determined using Fossomatic FC (Foss Electric, Hillerod, Denmark) and transformed to SCS through the formula of Wiggans and Shook (Citation1987): SCS = 3 + log2(SCC/100,000).
MCP were assessed using Formagraph (Foss Electric A/S, Hillerød, Denmark). As reported by Salari et al. (Citation2016), milk samples were put in a water bath to reach 35 °C and then 200 μL of calf rennet (215 IMCU/mL; with 80 ± 5% chymosin and 20 ± 5% pepsin; Hansen Naturen HA-LA-215; Pacovis Amrein AG, Bern, Switzerland) diluted to 1.2% (wt/wt) in distilled water was added to 10 mL of each milk sample. The analysis lasted 30 min from the addition of rennet solution to milk. MCP recorded were: RCT, the time interval between the addition of rennet to milk and the beginning of coagulation; k20, the time interval between the beginning of coagulation and the attainment of a coagulum of 20 mm; and a30, the consistency of the coagulum 30 min after the addition of rennet solution to milk (McMahon and Brown Citation1982). The analytical repeatability of these parameters has been stablished between 0.96 and 0.95 (Caroli et al., Citation1990), thus, considering the low amount of the milk samples (50 mL) and all the analysis scheduler, MCP were only determined once.
Statistical analysis
From the initial dataset (176 observations) and before applying any editing on the dataset, 5 out of 176 samples did not record information on protein, fat and lactose content and 7 out of 176 samples did not coagulate. Therefore, those 12 records were eliminated from our dataset, remaining 164 records for the statistical analysis. From those 164, 14 samples did not present information on k20 and 20 samples did not record SCC. The editing applied considered as missing information values that deviated more than 2 standard deviations (SD) from their respective mean for each studied trait. Thus, missing values for each trait due to editing ranged from 3 (protein, %) to 10 (RCT and SCS; Table ).
Table 2. Descriptive statistics of milk coagulation properties (MCP), composition traits, pH and SCS of goat milk.
Sources of variation of MCP, milk composition, pH and SCS were investigated using the MIXED procedure of SAS version 9.4 (SAS Inst. Inc., Cary, NC) with repeated measures, according to the following mixed linear model:
where yijklm is the dependent variable (RCT, k20, a30, fat percentage, protein percentage, lactose percentage, pH or SCS); µ is the overall intercept of the model; Breedi is the fixed effect of the ith goat breed (i = GA, GI, MA, MR and SA); Parityj is the fixed effect of the jth parity (j = primiparous or multiparous goats); Monthk is the fixed effect of the kth month of lactation (k = May, June, July and August); Goatl(Breedi) is the random effect of the kth goat nested within the ith breed ∼ N(0, σ2Goat(Breed)) and Ɛijklm is the random residual ∼ N(0, σ2Ɛ). In a preliminary analysis, the interactions Breed × Parity, Parity × Month and Breed × Month were not significant and, consequently, they were removed from the final model. Multiple comparisons of least squares means were performed for the main effects of breed, month of lactation and parity using Bonferroni’s test adjustment. Significance was declared at p < .05. In addition, Pearson correlation coefficients between the residuals of the studied traits were computed.
Results
Non-coagulated or no-k20 samples
From the initial dataset (n = 176), seven samples did not coagulate within 30 min and were removed from the dataset. Those seven samples were from SA (four samples), GA (two samples) and MR (one sample) goats; from May (two samples), July (three samples) and August (two samples) and from primiparous (one sample) and multiparous (six samples) goats. Milk composition of those samples was (mean ± SD): fat, 3.34 ± 0.89%; protein, 4.53 ± 1.30% and lactose, 3.65 ± 0.61%. The SCS was only available on five of those seven samples (10.21 ± 1.23).
After applying the editing criteria to the 164 samples, 10 records were treated as missing values for RCT. Those samples were to the ones that took longer than 18 min to start coagulating. Moreover, nine of them did not achieve a k20 value and eight of them were from SA does (five animals). Milk composition of those 10 samples was (mean ± SD): fat, 3.52 ± 1.24%; protein, 3.54 ± 1.29%; lactose, 4.09 ± 0.30% and SCS, 7.16 ± 3.74.
From the 164 samples, 14 samples did record a k20 value, being nine of them from SA (five animals). Milk composition of those samples was (mean ± SD): fat, 3.27 ± 1.04%; protein, 3.28 ± 1.13%; lactose, 4.23 ± 0.31% and SCS, 6.38 ± 3.08. The RCT and a30 were on average 18.56 ± 5.57 min (from 10.15 to 27.30 min) and 12.88 ± 2.78 mm (from 7.98 to 15.08 mm), respectively. After applying the editing criteria to the 164 samples, 6 records were treated as missing value for k20. Samples were from GI (three animals), SA (two animals) and MR (one animal) goats. Milk composition of those samples was (mean ± SD): fat, 3.66 ± 0.68%; protein, 3.11 ± 0.42%; lactose, 4.38 ± 0.32% and SCS, 4.36 ± 2.90. The RCT and a30 were on average 11.98 ± 2.47 min (from 8.45 to 14.15 min) and 23.17 ± 3.49 mm (from 20.00 to 23.08 mm), respectively.
Breed effect
Overall descriptive statistics of MCP, milk composition, pH and SCS after applying the editing criteria are summarised in Table . The greatest coefficient of variation (CV) was observed for k20 and a30, and the lowest was observed for pH and lactose content.
Least squares means of MCP and milk composition for the breed effect are reported in Table . Breed affected (p < .05) RCT, k20, a30, protein content, lactose content and pH. Saanen milk had the longest (p < .05) RCT (12.05 min) and k20 (6.00 min). The greatest a30 was observed in milk of GI breed, being 9.72 and 8.80 mm firmer (p < .05) than a30 of GA and SA, respectively.
Table 3. Least squares means of milk coagulation properties (MCP), milk composition, pH and SCS for goat breeds.
Protein content was lower (p < .05) in milk of SA compared with GA (−0.63%;), MA (−0.45%) and GI breed (−0.43%). Moreover, lactose content was lower (p < .05) in milk of SA compared with MR (−0.25%). Milk pH from SA was significantly higher than milk pH of GA, GI and MR breeds. Breeds did not differ significantly in terms of fat content; however, it is worth mentioning that milk of local breeds had greater fat content than milk of the cosmopolitan breed. Within local breeds, lactose content was 0.21% higher (p < .05) in milk of MR than MA. Local breeds did not differ for RCT, k20, protein content and pH.
Month of lactation and parity effects
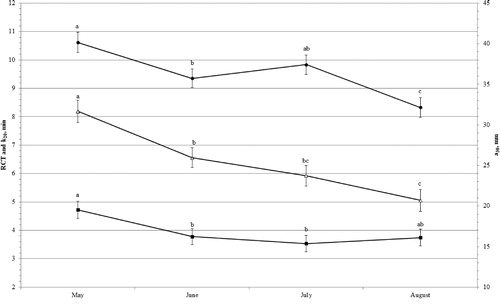
Month of lactation affected significantly MCP, milk composition, pH and SCS (Figure ). The RCT decreased by 22% towards the end of lactation (May, 10.62 ± 0.35 min; August, 8.33 ± 0.35 min; p < .05), a30 decreased by 35% towards the end of lactation (May, 31.68 ± 1.37 mm; August 20.69 ± 1.35 mm; p < .05) and k20 was shorter in June (3.78 ± 0.29 min) and July (3.53 ± 0.28 min) than May (4.72 ± 0.30 min; p < .05).
Figure 1. Least squares means (with standard errors) of rennet coagulation time (RCT, min; •), curd-firming time (k20, min; ▵) and curd firmness 30 min after rennet addition to milk (a30, mm; ▪) across month of lactation.
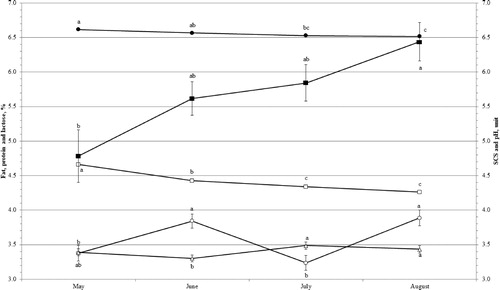
Different patterns were observed for milk composition, pH and SCS (Figure ). Fat content increased (p < .05) by 15% from May (3.38 ± 0.11%) to August (3.89 ± 0.11%). Protein content increased by approximately 1% between May (3.39 ± 0.05%) and August (3.43 ± 0.05%); however, protein content was lower (p = .05) in June (3.30 ± 0.05%) than July and August. Lactose and pH decreased progressively towards the end of lactation; in particular, lactose content decreased by 9% and pH by 2% between May and August. Conversely, SCS showed a progressive increment towards the end of lactation with a variation of +35% (p < .05) between May (4.78 ± 0.38) and August (6.44 ± 0.28).
Figure 2. Least squares means (with standard errors) of fat percentage (○), protein percentage (▵), lactose percentage (□), pH (•) and SCS (▪) across month of lactation.
Among milk composition and SCS, primiparous does tended to produce milk with greater protein percentage (3.48% vs. 3.32%, respectively; p = .05) and lower SCS (5.34 vs. 6.00, respectively; p = .06) than multiparous. Among MCP, primiparous does showed greater a30 (27.39 ± 0.98 mm) than multiparous (23.64 ± 1.03 mm; p < .05).
Correlations
Pearson’s correlations between the investigated traits are reported in Table . A weak positive correlation (p < .001) was observed between protein and fat percentage (0.26). Lactose percentage was weakly and positively correlated (p < .05) to fat percentage (0.20), pH (0.16) and protein percentage (0.19), and it was moderately and negatively correlated (p < .001) to SCS (−0.37). A strong positive correlation (p < .001) was estimated between RCT and k20 (0.62), and a moderate negative correlation (p < .001) was assessed between k20 and a30 (−0.41) and between RCT and a30 (−0.32). Negative correlations (p < .001) were observed between protein percentage and k20 (−0.46), and between pH and a30 (−0.18). The RCT was not correlated to protein, but it was positively correlated (p < .001) to pH (0.42). Moreover, a positive correlation (p < .001) was estimated between pH and k20 (0.29), between a30 and lactose (0.26) and between a30 and protein percentage (0.29).
Table 4. Pearson’s correlation coefficients between residuals of milk composition, pH, SCS and milk coagulation properties (MCP).
Discussion
Non-coagulated or no-k20 samples
The number of samples that did not coagulate within 30 min was very low (seven samples) to formulate any hypothesis. Thus, more non-coagulating samples are needed to study their sources of variation (e.g. breed, stage of lactation, season of sampling, milk chemical composition). However, it seems that could be related to the breed (four out of seven were from SA), to the animal (two out of seven were from the same animal), to the month/season of lactation (five out of seven were from July and August), or to the parity order (six out of seven were from multiparous goats). Moreover, 64% (9 out of 14) of the samples that did not present k20 were from SA, as well as 80% (8 out of 10) of the samples removed with the editing for RCT. No other pattern was observed that support an effect of the animal, the month/season of lactation (May, June, July or August) or the parity (primiparous or multiparous) to achieve k20 within 30 min of analysis.
Means and variation of MCP and milk composition
Overall, means and CV of MCP, milk composition, pH and SCS were lower than those reported when evaluating Saanen, Gamosciata delle Alpi, Murciano-Granadina, Maltese, Sarda and Sarda Primitiva goats, achieving a longer RCT (13.2 min; Vacca et al. Citation2018) and k20 (4.5 min) and greater a30 (36 mm; Vacca et al. Citation2018) than the present study. A greater RCT has also been determined in goat (10.3 min) and sheep (10.6 min) bulk milk tanks from Israeli herds (Leitner et al. Citation2016). Moreover, a greater content of protein, fat and lactose in individual (3.6%, 4.6% and 4.6%, respectively; Vacca et al. Citation2018) and bulk milk (3.7%, 4.3% and 4.4%; Leitner et al. Citation2016) of goats has been reported; as well as greater lactose content (4.6%) and pH (6.6) in Norwegian goat milk at 60 days in milk (Inglingstad et al. Citation2016). Among studied traits, the greater CV was observed for k20, similarly to Vacca et al. (Citation2018; CV = 53%). However, those authors reported a lower CV for a30 and greater CV for fat (CV = 31%), SCS (CV = 35%) and protein (CV = 15%) than we did.
The discrepancies observed among studies on MCP and milk composition might be related to the inclusion of different goat breeds, longer lactation period and parities considered, as well as the evaluation of bulk milk instead of individual milk. On the other hand, CV of lactose and pH observed in the present study was similar to those reported by Vacca et al. (Citation2018), which might be due to the low variability of those traits during the lactation (Niero et al., Citation2018).
Breed effect
In the present study, breed affected MCP, protein content, lactose content and pH. These results partially agree with Vacca et al. (Citation2018) who reported significant differences between Alpine (SA and Camosciata delle Alpi) and Mediterranean breeds (Maltese, Murciano-Granadina, Sarda and Sarda Primitiva) for k20, a30, and fat, protein and lactose content and pH.
In our study, the main differences of MCP were observed between local and cosmopolitan breeds. In detail, the shorter RCT and k20 detected in local breeds compared with SA may suggest that milk of local breeds is more suitable for cheese manufacturing than milk of SA. However, differences of a30 among breeds were less evident. Conversely, no significant differences among local breeds were observed for the studied traits. Vacca et al. (Citation2018) did not report significant differences for RCT between Alpine and Mediterranean breeds; however, they reported a slightly longer RCT for SA (13.1 min) than MA breed (11.9 min). The same authors observed similar a30 between SA and MA; however, they reported greater a30 (33.5 mm) in SA milk than the present study. On the other hand, results for k20 in the present study disagree to those of Vacca et al. (Citation2018), who reported similar results for SA, Murciano-Granadina and MA breeds (5.00 min), and also significant differences within Mediterranean breeds. These discrepancies between our study and Vacca et al. (Citation2018) might be related to the greater number of days in milk (10–374) considered in their study.
Because GA milk had short RCT and k20, we expected greater a30 than the other breeds, but this was not the case; this result may be partly the consequence of the relatively low association between RCT and a30. Moreover, the lower fat, protein and lactose content of SA than local milk breeds could be the cause of the delay in RCT and a30, as reported in Ambrosoli et al. (Citation1988). Currò et al. (Citation2019a) and Vacca et al. (Citation2018) also highlighted poorer fat, protein and lactose content in milk of SA than local (GA, GI, Jonica, MA and MR) and Sarda and Sarda Primitiva goat breeds, respectively. The low milk composition of SA breed might be due to the intensive selection for milk yield, which has likely caused a dilution of milk components (Serradilla Citation2001).
In the present study, GI showed shorter RCT, longer k20 and stronger a30 than those reported in Todaro et al. (Citation2005; 16.96 and 2.01 min, and 31.44 mm, respectively). The delay of RCT and k20 in Todaro et al. (Citation2005) compared with our results could be explained considering the different origin of rennet used in the studies; indeed, to assess MCP in Todaro et al. (Citation2005) they used rennet from lamb while in the present study calf rennet was used. Furthermore, similar protein content was detected in both studies; however, Todaro et al. (Citation2005) reported milk richer in fat (3.93%) and lactose (4.55%) and with higher pH (6.59) than the present study. Those discrepancies might be due to the whole lactation considered in the study of Todaro et al. (Citation2005); in fact, the inclusion of early lactation (characterised by milk poorer in fat and protein percentage than late lactation) in their study could be the cause of the delay in RCT and k20 in early than late lactation.
Month and parity effects
Generally, parity affect some MCP (Vacca et al. Citation2018). In the current study parity affected only a30, being thinner in multiparous than in primiparous goats, in line with Vacca et al. (Citation2018) results, who reported that a30 was thicker in primiparous and secondiparous goats than goats with 3 or more parities. Moreover, Vacca et al. (Citation2018) indicated shorter RCT for 1st and 2nd than for ≥3rd parities. Differences between multiparous and primiparous goats were not clearly observed in milk composition.
Rennet coagulation time and a30 decreased from May to August. Considering that in the present study the protein content was similar between May and August, the shorter RCT towards the end of lactation could be due to the variation of the casein fractions. Although in the present study casein fractions were not determined, Brown et al. (Citation1995) observed an increment of αs1-casein and κ-casein, and a decrease of αs2-casein and β-casein towards the end of lactation in SA goat breed; and Dı́az et al. (Citation1999) reported an increment of αs1-casein and a decrease of κ-casein and β-casein contents from spring to summer in Murciano-Granadina goats.
According to the positive correlation of a30 with lactose and protein contents, we hypothesised that the smaller a30 at the end of lactation could depend on the reduction of lactose and casein fractions content (αs2-casein and β-casein) through lactation. In general, the trends of RCT, k20 and a30 reported in this study followed the trend reported in Garfagnina goat milk (Salari et al. Citation2016) with shorter RCT and weaker a30 in summer than spring, without highlighting significant variation of protein content.
Generally, an increase of milk components in late lactation due to lower milk yield, and thus a concentration of components, is expected (Goetsch et al. Citation2011; Mestawet et al. Citation2012). Indeed, in the present study it was observed a slight increment of protein and SCS towards the end of lactation. Conversely, the fat content showed fluctuation through the period considered, and in July an inversion of fat to protein ratio was observed. The greater protein than fat content could suggests the presence of metabolic disorder status known as milk fat depression caused by nutrition (Koch and Lascano Citation2018). In agreement with the values observed in the present study, a decrease of lactose in goat milk and an increment of SCC and SCS was observed in Sung et al. (Citation1999) and in Currò et al. (Citation2019b), respectively. However, the greater SCS (6.44) with lower lactose (4.26%) associated with lower pH (6.52) in August than in previous months suggested the absence of udder diseases. Indeed, Hassan (Citation2013) studied the variation of milk composition in different species (cow, ewe and goat) affected by sub-clinical mastitis and found that goats with infected udder produced milk poor in lactose and with high pH. In general, goat milk showed greater SCS than cow milk due to the apocrine system of goat milk secretion (Raynal-Ljutovac et al. Citation2007) which excretes a great amount of cytoplasmic particles or epithelial cells into the milk causing the increment of somatic cells.
Correlations
Rennet coagulation time and protein content were not correlated in the present study, which contrasted with other authors (Clark and Sherbon Citation2000; Vacca et al. Citation2018) who reported a positive correlation between both parameters in goat milk. The absence of clear correlation in this study could depend on the caseins composition of each breed (Damián et al. Citation2008) and also on casein genotypes (Caravaca et al. Citation2011). Indeed, Chessa and Caroli (Citation2014) reported that goat species has 23 variants of αs1-casein, 7 variants of αs2-casein, 16 variants of κ-casein and 9 variants of β-casein. However, casein fractions and polymorphism were not evaluated in the present study. On the other hand, protein was correlated negatively to k20 and positively to a30. The pH correlated positively with RCT and k20, and negatively with a30; indeed, milk with higher pH had a delay of RCT and k20 and weaker a30 than milk with low pH. Moreover, we observed a positive correlation between lactose and a30, which was in accordance with results reported in Girgentana goats by Todaro et al. (Citation2005). Also, Leitner et al (Citation2016) showed a positive tendency (p < .09) between lactose and curd firmness calculated after 60 min using the Optigraph© in bulk milk. However, Vacca et al. Citation2018 reported a decreasing lactose percentage and an increasing a30 as days in lactation continues, which may suggest that the positive correlation observed in our study between both traits could be linked to other parameters not measured here.
Conclusions
In the present study, local goat breeds showed better milk composition than Saanen, thus reflecting in better MCP than the cosmopolitan breed. In addition, the number of samples that did not coagulate or did not achieve a 20 mm coagulum within 30 min of analysis seemed to be greater in Saanen than in local breeds. However, a30 of Saanen was similar to a30 of local breeds. Significant differences were detected through month of lactation, observing shorter RCT and weaker a30 towards the end of lactation. Results of the present study are relevant to better understand the variation of MCP in goat local breeds and provide useful information to safeguard and valorise local genetic resources which have economic relevance for the sustainability of marginal areas.
Disclosure statement
No potential conflict of interest was reported by the author(s).
Additional information
Funding
References
- Ambrosoli R, Di Stasio L, Mazzocco P. 1988. Content of αs1-Casein and Coagulation Properties in Goat Milk. J. Dairy Sci. 71(1):24–28. doi:10.3168/jds.S0022-0302(88)79520-X.
- Brown J R, Law A J R, Knight C H. 1995. Changes in casein composition of goats' milk during the course of lactation: physiological inferences and technological implications. J. Dairy Res. 62(3):431–439. doi:10.1017/S0022029900031137.
- Caravaca F, Ares JL, Carrizosa J, Urrutia B, Baena F, Jordana J, Badaoui B, Sànchez A, Angiolillo A, Amills M, et al. 2011. Effects of αs1-casein (CSN1S1) and κ-casein (CSN3) genotypes on milk coagulation properties in Murciano-Granadina goats. J Dairy Res. 78(1):32–37.
- Caroli A, Bolla P, Pagnacco G, Rampilli M, Degano L. 1990. Repeatability of milk clotting aptitude evaluated by lactodynamographic analysis. J. Dairy Res. 57(1):141–142. doi:10.1017/S0022029900026704.
- Chessa S, Caroli AM. 2014. Polimorfismi genetici lattoproteici caprini e ovini ed effetti sulla qualità del latte. Large Anim Rev. 4:23–27.
- Clark S, Sherbon JW. 2000. Alpha(s1)-casein, milk composition and coagulation properties of goat milk. Small Rumin Res. 38(2):123–134.
- Currò S, De Marchi M, Claps S, Salzano A, De Palo P, Manuelian CL, Neglia G. 2019a. Differences in the detailed milk mineral composition of Italian local and Saanen goat breeds. Animals. 9(7):411–412.
- Currò S, Manuelian CL, De Marchi M, De Palo P, Claps S, Maggiolino A, Campanile G, Rufrano D, Fontana A, Pedota G, et al. 2019b. Autochthonous dairy goat breeds showed better milk quality than Saanen under the same environmental conditions. Arch Anim Breed. 62(1):83–89.
- Damián JP, Sacchi I, Reginensi S, De Lima D, Bermúdez J. 2008. Cheese yield, casein fractions and major components of milk of Saanen and Anglo-Nubian dairy goats. Arq Bras Med Vet Zootec. 60(6):1564–1569.
- de Asís Ruiz Morales F, Castel Genís JM, Mena Guerrero Y. 2019. Current status, challenges and the way forward for dairy goat production in Europe. Asian-Australas. J. Anim. Sci. 32(8):1256–1265.
- Dı́az E, Analla M, Muñoz-Serrano A, Alonso-Moraga A, Serradilla JM. 1999. Variation of milk yield and contents of total casein and casein fractions in Murciano-Granadina goats. Small Rumin Res. 34(2):141–147.
- FAOSTAT. 2019. Food and Agriculture Organization of the United Nations. Statistics Division [accessed 2019 July 20].
- Goetsch AL, Zeng SS, Gipson TA. 2011. Factors affecting goat milk production and quality. Small Rumin Res. 101(1–3):55–63.
- Hassan HJ. 2013. Variations in milk composition of some farm animals resulted by sub-clinical mastitis in Aldiwania province. Bas J Vet Res. 12(2):17–24.
- Ikonen T, Morri S, Tyrisevä A-M, Ruottinen O, Ojala M. 2004. Genetic and Phenotypic Correlations Between Milk Coagulation Properties, Milk Production Traits, Somatic Cell Count, Casein Content, and pH of Milk. J. Dairy Sci. 87(2):458–467. doi:10.3168/jds.S0022-0302(04)73185-9.
- Inglingstad RA, Eknaes M, Brunborg L, Mestawet T, Devold TG, Vegarud GE, Skeie SB. 2016. Norwegian goat milk composition and cheese quality: the influence of lipid supplemented concentrate and lactation stage. Int Dairy J. 56:13–21.
- Koch L, Lascano G. 2018. Milk fat depression: etiology, theories, and soluble carbohydrate interactions. J Anim Res Nutr. 3(2):1–21.
- Leitner G, Lavon Y, Matzrafi Z, Benun O, Bezman D, Merin U. 2016. Somatic cell counts, chemical composition and coagulation properties of goat and sheep bulk tank milk. Int. Dairy J. 58:9–13. doi:10.1016/j.idairyj.2015.11.004.
- McMahon DJ, Brown RJ. 1982. Evaluation of formagraph for comparing rennet solutions. J Dairy Sci. 65(8):1639–1642.
- Mestawet TA, Girma A, Ådnøy T, Devold TG, Narvhus JA, Vegarud GE. 2012. Milk production, composition and variation at different lactation stages of four goat breeds in Ethiopia. Small Rumin Res. 105(1–3):176–181.
- Miller BA, Lu CD. 2019. Current status of global dairy goat production: an overview. Asian-Australas J Anim Sci. 32(8):1219–1232.
- Niero G, Currò S, Costa A, Penasa M, Cassandro M, Boselli C, Giangolini G, De Marchi M. 2018. Short communication: phenotypic characterization of total antioxidant activity of buffalo, goat, and sheep milk. J Dairy Sci. 101(6):4864–4868.
- Pazzola M. 2019. Coagulation traits of sheep and goat milk. Animals. 9(8):540.
- Raynal-Ljutovac K, Pirisi A, De Crémoux R, Gonzalo C. 2007. Somatic cells of goat and sheep milk: analytical, sanitary, productive and technological aspects. Small Rumin Res. 68(1–2):126–144.
- Salari F, Altomonte I, Ribeiro NL, Ribeiro MN, Bozzi R, Martini M. 2016. Effects of season on the quality of Garfagnina goat milk. Ital J Anim Sci. 15(4):568–575.
- Sepe L, Argüello A. 2019. Recent advances in dairy goat products. Asian-Australas J Anim Sci. 32(8):1306–1320.
- Serradilla JM. 2001. Use of high yielding goat breeds for milk production. Livest Prod Sci. 71(1):59–73.
- Sung YY, Wu TI, Wang PH. 1999. Evaluation of milk quality of Alpine, Nubian, Saanen and Toggenburg breeds in Taiwan. Small Rumin Res. 33(1):17–23.
- Todaro M, Scatassa ML, Giaccone P. 2005. Multivariate factor analysis of Girgentana goat milk composition. Ital J Anim Sci. 4(4):403–410.
- Vacca GM, Stocco G, Dettori ML, Pira E, Pazzola M, Bittante G. 2018. Milk yield, quality, and coagulation properties of 6 breeds of goats: environmental and individual variability. J Dairy Sci. 101(8):7236–7247.
- Wiggans GR, Shook GE. 1987. A lactation measure of somatic cell count. J Dairy Sci. 70(12):2666–2672.