
 ?Mathematical formulae have been encoded as MathML and are displayed in this HTML version using MathJax in order to improve their display. Uncheck the box to turn MathJax off. This feature requires Javascript. Click on a formula to zoom.
Abstract
The appearance of white striations over the breast of chicken and turkey meat is considered as a recent emerging and growing problem. The aim of this research is to investigate the ability of visible-near infra-red (VIS/NIR) spectroscopy to predict the quality traits of different levels of white striping (thickness of white striations, moderate < 1 mm and severe ≥ 1 mm) defects in turkey breast muscle. Accordingly, 36 turkey breast fillets affected by different level of white striping defects (normal, moderate and severe) were selected from 20-wk old tom turkeys. Colour traits (L*, a* and b*), pH, marinade uptake, drip loss, cooking loss, and chemical composition (moisture, fat, protein and ash) have been evaluated. Our findings showed that prediction models using partial least squares (PLS) were good for colour traits (a* for example; RPD values were 3.22 and 1.27, R2P were 0.91 and 0.57 while RER values were 11.8 and 3.12) , pH (RPD values were 5.00 and 0.01, R2P were 0.95 and 0.07 while RER values were –1.00 and 15.50), and chemical composition (protein content for instance, the prediction values were as the following: RPD values were 1.93 and 0.79, R2P were 0.80 and 0.34 and then RER were 8.48 and 3.80) in particular for normal and severe white striped meat respectively. In conclusion, the results of this research showed that VIS/NIR spectroscopy prediction models were satisfactory to predict the quality traits in the majority of cases.
White striping is a recent muscle abnormality that affects adversely poultry meat.
Visible-near infra-red (VIS/NIR) spectroscopy was used to predict the quality traits of turkey breast meat affected by white striping.
Partial least squares (PLS) was good indicator to predict several quality traits of normal meat.
HIGHLIGHTS
Keywords:
Introduction
Recently, several growth-related abnormalities have been observed in poultry meat such as white striping, wooden breast and spaghetti meat (Petracci et al. Citation2019; Zampiga et al. Citation2020). White striping abnormality was described by the appearance of white striations parallel to muscle fibre direction located in particular over cranial part of chicken (Kuttappan, Lee, et al. Citation2012) and turkey breasts (Soglia, Baldi, et al. Citation2018; Mudalal Citation2019). Breast meat affected by white striping abnormality had different quality traits when compared with normal meat. In this context, it was found that white striped meat had a higher content of fat and lower content of proteins in comparison to normal meat in chickens (Kuttappan, Lee, et al. Citation2012; Kuttappan, et al. Citation2013; Petracci et al. Citation2014), whilst white-striped turkey meat exhibited higher lipid levels and lower ash content (Soglia, Baldi, et al. Citation2018). Moreover, white striped meat exhibited lower water holding and binding capacity than normal meat during processing, which was characterised by low marinade uptake and high cooking loss in broilers (Petracci et al. Citation2013; Mudalal et al. Citation2015), while white striping only marginally affected technological quality traits of turkey breast meat (Zampiga et al. Citation2020).
Several studies have been carried out to evaluate the incidence of white striping in different countries in the world. Most of previous studies showed that the incidence was varied from 12 up to 60% in broilers (Kuttappan, Lee, et al. Citation2012; Petracci et al. Citation2013; Russo et al. Citation2015; Tijare et al. Citation2016 ). Recent reports revealed that meat affected by growth-related abnormalities are sold at lower price than normal or sometimes transformed to processed meat products (Kuttappan et al. Citation2017; Petracci et al. Citation2019). Therefore, this high percentage of incidence of muscle abnormalities generated huge concerns for meat industries about the economic consequences (Soglia, Mazzoni, et al., Citation2018).
Near infra-red spectroscopy (NIRS) equipped with optical sensor was used to predict and estimate different quality traits of food products and meat products by measuring the absorbance, reflectance, and/or scattering of NIR at different wavelengths (Brondum et al. Citation2000; Gardner Citation2018). NIRS has been employed in meat and meat products to predict water binding capacity (WBC) and pH. Traffano-Schiffo et al. (Citation2017) proposed that radio frequency spectra can be used as an effective technique to detect WS in chicken carcases with skin. Jiang et al. (Citation2019) showed that hyperspectral imaging was successfully applied to discriminate between normal and WS breast muscles by simultaneously providing information related to chemical and physical characteristics of meat. Moreover, NIR spectroscopy has been used to detected WB meat in chicken (Wold et al. Citation2019), chicken slaughtering lines (Geronimo et al. Citation2019), and severe WS turkey fillets (Zaid et al. Citation2020).
The ability of NIRS to predict several quality traits of meat such as chemical composition (protein, moisture, fat, and collagen), pH, water holding capacity, etc have been investigated by several researchers (Cozzolino et al. Citation2002; Meulemans et al. Citation2003; Moran et al. Citation2018; Yang et al. Citation2018). Moreover, the ability of NIR for classification of meat obtained from animals fed different diets (McDevitt et al. Citation2005), genotype (Yancey et al. Citation2010) as well as having distinct degrees of tenderness levels (Soglia, Mazzoni, et al. Citation2018) has been studied.
There are no available studies that used VIS/NIR spectroscopy to predict the quality traits of turkey breast meat affected by different levels of white striping. Therefore, the main objective of this research is to employ VIS/NIR spectroscopy in order to predict as much as possible the quality traits, which will enable the possibility of using VIS/NIR technique in the slaughterhouse as a quick and robust method for quality traits assessment.
Materials and methods
Samples selection and preparation
From local Palestinian slaughterhouse near Tulkarm city (Palestine), more than 60 Pectoralis major muscles of 20-wk old tom turkey birds were randomly selected based on the appearance of white striations. The evaluation of the presence of white striping was performed on the processing line at 1–2 h of post-mortem in the breast deboning area. Out of 60 Pectoralis major muscles, 36 muscles were classified into three groups: normal (free of white striations, n = 12), moderate (when white striations thickness <1mm, n = 12), and severe (when white striations thickness ≥ 1 mm, n = 12) according to criteria adopted in previous studies (Soglia, Baldi, et al. Citation2018; Zaid et al. Citation2020). Samples were subjectively pre-classified into categories, packed on ice, and transported to Palestine Technical University- Kadoori laboratory for VIS/NIR measurements then to An-Najah National University laboratories for other quality traits analysis. Pectoralis major muscles were excised from the whole breast muscle. Excessive fat, connective tissue, cartilage and bone fragments were avoided to minimise sampling errors. It is worthy to mention that the samples used in this research were also used for investigating the possibility of using VIS/NIR for classification of normal and white striped turkey breasts (Zaid et al. Citation2020).
VIS/NIR spectroscopy measurements
In each turkey breast meat sample (n = 36), three spectra were collected (at room with a temperature of 23 ± 2 °C and relative humidity of 60%) directly on the skin side, in radial section, and in tangential section. A USB2000+ miniature fibre optic spectrometer (Ocean Optics, USA) with a vivo light source and 50 µm fibre optics probe was used for spectra acquisition according to Zaid et al. (Citation2020).
Samples used for building PLS calibration models were 36, using their VIS/NIR spectra. Proximate chemical composition (moisture, protein, lipid and ash) and technological properties (colour, pH, drip loss, cooking loss, marinade uptake, texture) were assessed for each Pectoralis major muscle.
Quality traits
On the skin-side surface of each fillet from cranial area, colour traits (CIE L* = lightness, a* = redness and b* = yellowness) were measured in triplicate by the using Chroma Metre CR-410 (Konica Minolta, Japan).
Moreover, pH has been measured by using method described by Jeacocke (Citation2007). From each fillet, a cut (10 × 5 × 3 cm) has been excised from the cranial area to evaluate purge loss, marinade uptake, yield and cooking loss.
Marination process have been carried out for all meat samples (normal, moderate, and severe white striping) by using a small- scale vacuum tumbler (model MGH-20, VakonaQualitat, Lienen, Germany) for 25 min (speed 20 xg, 500 rounds) at pressure of 0.95 bar.
The marinade solution was added to obtain threotically 1.5% of sodium chloride and 0.4% sodium tripolyphosphate (STPP) in finished product after marination. The weights of meat samples were recorded after marination to measure marinade uptake, then samples were stored in refrigerator at 2–4 °C for 48 h, and the loss in weights during storage were recorded to calculate purge loss. After 48 h, samples were vacuumed packaged and cooked in water bath at 80 °C for 24 min until the internal temperature reached 80 °C. Meat samples were removed from bags and reweighed to measure cooking loss and total yield.
For each raw fillet, proximate composition (moisture, protein, ash and lipid contents) has been determined according to the official methods of AOAC (Helrick Citation1990).
Statistical analysis
The Unscrambler programme (version 9.7, CAMO Software AS, Oslo, Norway) was used for both PCA and PLS multivariate data analysis (MVDA) (Jolliffe Citation2011; Abu-Khalaf Citation2015). In PCA, VIS/NIR spectra represented a bilinear model of the data matrix X. PCs represented in a pattern of observations in plots. The structural part consists of a scores plot, explains the relationship between samples, and a transposed loading plot explains the relationship between variables (Wold et al. Citation2001). PLS was used to find a linear correlation by projecting the predicted variables and the observable variables to a new space (Legin et al. Citation2004). PLS components was used to reduce the original spectroscopic X data (VIS/NIR) to a very small number of latent variables, by finding a linear decomposition with chemical/physical analysis data (Y), whether Y is a single response or multi-response, such that:
where: T = X-scores, U = Y-scores; P = X-loadings, Q = Y- loadings; E = X-residuals, F = Y-residuals.
Full cross-validation was used as the validation method during building PLS models, in which one validation sample was removed from the calibration set and the PLS model was then established based on the remaining calibration samples (He et al. Citation2013). The calibration was made based on the averages of three spectra for each breast meat from each group. After that, this calibration was applied to predict chemical quality traits to investigate whether it was possible to discriminate normal turkey breast fillets from WS fillets (moderate and severe) based on these values. Then the quality traits of samples from the independent prediction set were used to confirm the predictive ability of the established PLS model.
The model performance was estimated by calculating root-mean-square error estimated by calibration (RMSEcal), the coefficient of determination in calibration (R2cal) and root-mean-square error estimated by prediction (RMSEp), in addition to the coefficient of determination in prediction (R2p). Commonly, the models that exhibited the highest coefficients of determination (R2cal and R2p) and lowest root-mean-square error (RMSEcal, RMSEp) as well as a small difference between RMSEcal and RMSEp; were considered as an acceptable model (Kapper et al. Citation2012). The ratio of performance deviation (RPD), relative error (RE), and range error ratio (RER) were also calculated to evaluate the application potential of the model (Williams and Norris Citation1987).
where: ŷi and yi are the predicted and observed values of sample i, n: number of samples.
Results and discussion
Proximate composition and technological traits
Descriptive statistics including mean, range, maximum and minimum values, standard deviations and coefficients of variation (CV) which were obtained from determination of proximate composition and technological traits of turkey breast meat used for the calibration and validation sets are shown in .
Table 1. Proximate composition and technological traits of turkey breast meat as affected by white striping.
In general, our study showed that presence of white striping defects had significant effect on the chemical composition and quality traits of turkey breast meat. In this study, the obtained colour indices were in general agreement with previous studies conducted in turkey meat (Werner et al. Citation2008; Soglia, Baldi, et al. Citation2018). It was found that the obtained range of L* value for all groups was 56.9–71.5. Sihvo et al. (Citation2014) found that normal meat exhibited wide ranges of L* values (63.7–71.5). As far as variability is concerned, a*-value of normal meat had CV higher than moderate and severe white striped meat (76.3 vs. 54.4 and 49.7), respectively. On the contrary, L* and b*-values of normal meat exhibited lower CV than moderate and severe white striped meat. Moderate and severe white striped meat also exhibited significantly higher a*-values (2.98 and 3.06 vs. 1.56, p < .05) and lower b*-values (7.27 and 7.98 vs. 4.20, p < .05) if compared with normal meat, respectively, while lightness (L*) did not show any significant difference. Similar results have been observed in a previous study (Soglia, Baldi, et al. Citation2018). The change in a*-values may be explained due to the significant increase in the pH of white striped fillets. The increase in b*-values may be attributed to increase in fat content that have been observed in this study, which also was consistent with previous studies conducted in broilers (Kuttappan, Brewer, et al. Citation2012; Petracci et al. Citation2014). The values of pH ranged from 5.93 to 6.24, 5.92 to 6.25 and 6.12 to 6.30 for normal, moderate and severe white striped meat, respectively. Severe white striping meat had significantly pH higher than normal and moderate meat. These results were in agreement with Baldi et al. (Citation2018) who found that white striped meat had significantly higher pH than normal meat (5.96 vs. 5.86) in broilers, while no differences were found when normal and severe white-striped turkey breast meat were compared (Soglia, Baldi, et al. Citation2018). Marinade uptake (%) ranged from 9.4 to 17.1, 9.2 to 21.4 and 13.5 to 24.6 for severe, moderate and normal meat, respectively. However, there were no significant differences between groups in agreement with previous findings (Soglia, Baldi, et al. Citation2018).
The presence of white striping did not exhibit any effect on drip loss, cooking loss, moisture content and ash content. Moderate and severe white striped meat had higher fat content (1.27 and 2.17 vs. 1.02, p < .05) and lower protein level (23.12 and 21.1 vs. 24.1, p < .05) when compared to normal meat. These partially agree with findings of Soglia, Baldi, et al. (Citation2018) who detected that occurrence of white striping only partially affected the proximate composition of the meat. Although higher lipid levels were found in severe white-striped muscles, moisture, collagen and protein contents did not differ between affected and normal breast muscles.
Prediction of chemical composition for three groups of meat samples was performed based on different pre- treated spectral for different quality traits, but the same regression model was applied on each group separately. The quality parameters were evaluated from VIS and NIR spectra by PLS analysis. Error of prediction and correlation coefficients of models showed the potential application of VIS/NIR spectra to differentiate meat quality parameters between normal and white striping (moderate and severe) turkey breast meat. The results of colour indices (L*, a*, b*) obtained from calibration and full cross validation PLS regression model for normal, moderate, and severe white striping turkey breast meat samples are shown in Table . The prediction values of coefficient of determination (R2p) were 0.91 and 0.57, the ratio of performance deviation (RPD) were 3.21 and 1.26, and range error ratio (RER) were 11.86 and 3.11 for a*-values of normal and severe groups, respectively. Our finding showed that VIS/NIR spectroscopy was satisfactory to differentiate normal from severe WS turkey fillets by using a*-values. Whereas the prediction ability was also high for a*-value for moderate WS; R2p was 0.89, RPD was 2.74 and RER was 7.72. Accordingly, VIS/NIR was not able to distinguish between normal and moderate WS.
Table 2. Statistics of the calibration equations for colour indices (L*, a* and b*) of the three types of turkey breast meat of the best fit and validation.
The predictive ability for VIS/NIR was satisfactory to differentiate normal from defected turkey fillets according to b*-values. R2p-values were 0.95, 0.14 and –3.06 for normal, moderate and severe fillets, respectively. RPD was 3.69 for normal, 1.13 for moderate WS, and 0.47 for severe WS. RER was 11.78, 3.49 and 1.46 for normal, moderate and severe WS.
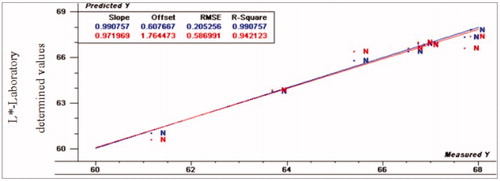
It was found that L*-value had R2p (0.94, 0.87 and 0.81), RPD (4.31, 2.49 and 2.05), and RER (13.51, 7.90 and 5.86) for normal, moderate and severe white striping fillets, respectively. Figures show the scatter plots of developing model. In general, ratio of error range (RER) values has poor predictive capability when it is less than 3, while RER is considered moderate in utility with range of 3–10 and good utility when it is more than 12 (Millmier et al. Citation2000). Moreover, for reliability analysis and strong prediction, RPD >3 is essential (Dagnew et al. Citation2004).
Figure 1. Relationship between laboratory determined and VIS/NIR predicted values for a* normal turkey breast meat using PLS and full cross validation for 10 samples (blue line for calibration set, which has numbers on top in the results table, and red line for validation set that has numbers below in the results table).
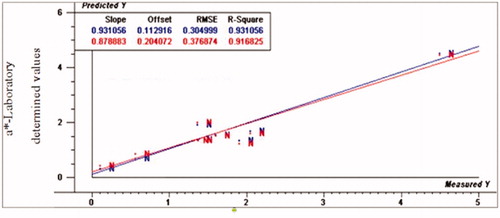
Figure 2. Relationship between laboratory determined and VIS/NIR predicted values for b* normal turkey breast meat using PLS and full cross validation for 8 samples (blue line for calibration set, which has numbers on top in the results table, and red line for validation set that has numbers below in the results table).
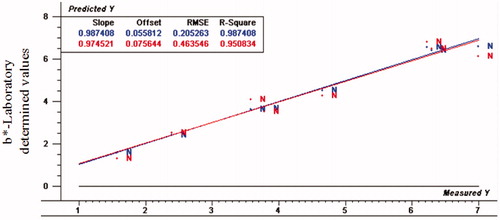
Figure 3. Relationship between laboratory determined and VIS/NIR predicted values for L* of normal turkey breast meat using PLS and full cross validation for 8 samples (blue line for calibration set, which has numbers on top in the results table, and red line for validation set that has numbers below in the results table).
The results of PLS model of quality traits for three turkey fillets types are presented in Table . The best fit of prediction values of pH from the same regression model were for R2p (0.95, 0.12 and 0.07), RPD (5.00, −0.13 and –0.33), and RER (15.00, −0.48 and 1.00) for normal, moderate WS and severe WS fillets, respectively. According to PLS regression model for pH calibration, VIS/NIR spectroscopy had the ability to differentiate between normal fillets from abnormal WS fillets.
Table 3. Statistics of the calibration equations for quality traits of the three types of turkey breast meat of the best fit and validation, including RMSEcal, R2c, RMSEp, R2p, RPD, RE and RER.
The prediction values for marinade up take were R2p (0.91, 0.73 and 0.70), RPD (3.59, 1.17 and 1.94) and RER (11.01, 3.83 and 5.96) for normal, moderate and severe WS, respectively. Considering marinade uptake, VIS/NIR spectroscopy had the ability to detect normal fillets from abnormal fillets. For cooking loss, R2p values were 0.97, 0.73 and 0.59, RPD- values were 5.17, 1.74 and 2.49 and RER-values were 19.6, 6.38 and 7.89 for normal, moderate and severe WS, respectively. The normal spectral data was compatible with the regression model very well, while WS fillets spectral data did not fit with the same model. As a result, VIS/NIR spectroscopy was able to detect normal from WS turkey breast meat. Moreover, R2p values for drip loss were 0.81, 0.14 and –0.12, RPD- values were 4.1, 3.38 and 1.12, and RER- values were 16.76, 7.18 and 7.53 for normal, moderate and severe WS, respectively. According to the prediction results of drip loss, VIS/NIR had the ability to differentiate between normal and WS fillets.
The scatter plots of quality traits developing models are shown in Figures . Calibration and full cross validation results for proximate composition (moisture, fat, protein and ash) are presented in . Figures show the PLS plot for normal samples according to proximate composition. The prediction values for moisture content were for R2p (0.86, −1.61 and –1.03), RPD (2.67, 091 and 0.61), and RER (8.48, 3.24 and 2.17) for normal, moderate and severe WS, respectively. The normal spectral data fitted the regression model very well, while WS spectral data is poorly fitted using PLS model. From these results, VIS/NIR spectroscopy has the ability to differentiate normal from abnormal WS turkey fillets according to moisture content parameter. Considering protein content, the prediction values were as the following: R2p-values were 0.80, 0.77 and 0.34, RPD values were 1.93, 1.52 and 0.79 and RER-values were 8.48, 4.15 and 3.80 for normal, moderate and severe WS, respectively.
Figure 4. Relationship between laboratory determined and VIS/NIR predicted values for pH of normal turkey breast meat using PLS and full cross validation for 7 samples (as in Figures ).
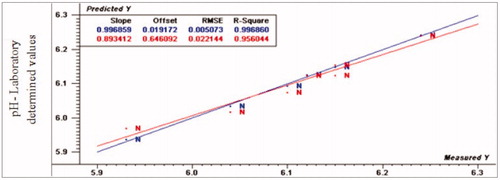
Figure 5. Relationship between laboratory determined and VIS/NIR predicted values for up- take for marinated of normal turkey breast meat using PLS and full cross validation for 7 samples (as in Figures ).
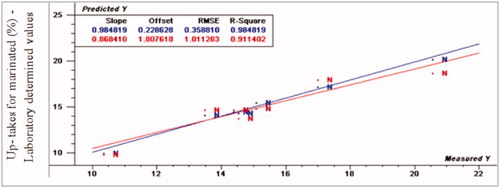
Figure 6. Relationship between laboratory determined and VIS/NIR predicted values for drip loss (%) of normal turkey breast meat using PLS and full cross validation for 7 samples (as in Figures ).
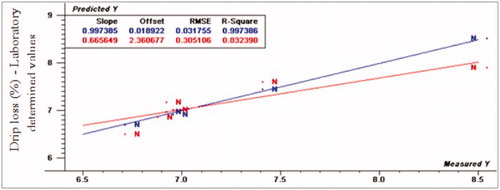
Figure 7. Relationship between laboratory determined and VIS/NIR predicted values for cooking loss (%) of normal turkey breast meat using PLS and full cross validation for 8 samples (as in Figures ).
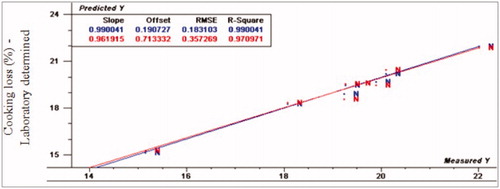
Figure 8. Relationship between laboratory determined and VIS/NIR predicted values for moisture content (%) of normal turkey breast meat using PLS and full cross validation for 8 samples (as in Figures ).
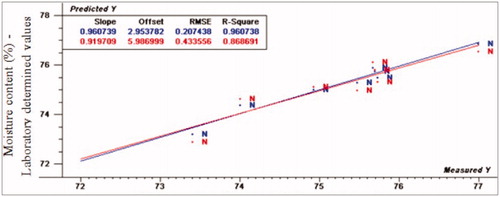
Figure 9. Relationship between laboratory determined and VIS/NIR predicted values for fat content (%) of normal turkey breast meat using PLS and full cross validation for 6 samples (as in Figures ).
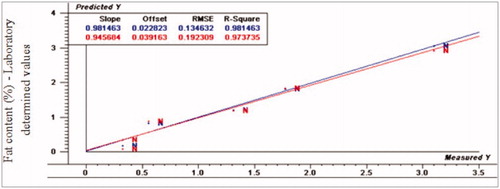
Figure 10. Relationship between laboratory determined and VIS/NIR predicted values for protein content (%) of normal turkey breast using PLS and full cross validation for 5 samples (as in Figures ).
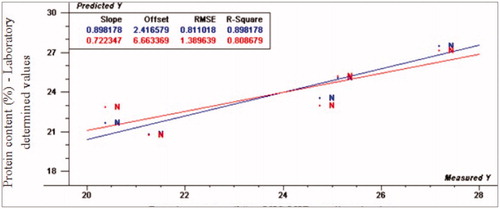
Figure 11. Relationship between laboratory determined and VIS/NIR predicted values for ash content (%) of normal turkey breast meat using PLS and full cross validation for 8 samples (as in Figures ).
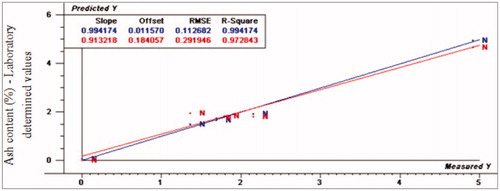
For fat content, PLS prediction values as represented by R2p-values were 0.97, 0.33 and 0.53, RPD-values were 4.78, 4.03 and 3.50, whereas RER values were 14.58, 13.85 and 3.50 for normal, moderate WS and severe WS, respectively. The normal spectral data was fitted with the regression model while moderate and severe WS spectral data were poorly fitted with the same regression model, respectively. Finally, the prediction values for ash content were as the following: R2p values were 0.97, −2.40 and 0.61, RPD values were 3.86, 0.82 and 0.82, while RER values were 4.44, 2.52 and 2.52 for normal, moderate and severe WS, respectively. The normal spectral data was relatively fitted the regression model even that the RER value was small, while WS spectral data was poorly fitted with the same model.
Conclusions
The findings of this study showed that VIS/NIR spectroscopy was able to predict several quality traits of normal fillets, such as colour indices, pH, proximate composition (moisture, fat, protein, and ash) and water holding capacity (marinade up take, cooking loss and drip loss). Moreover, our study showed that there is a potential to employ portable VIS/NIR technique in turkey meat industry. Further studies with high number of samples coming from different farming conditions are needed to confirm the ability of VIS/NIR spectroscopy combined with MVDA techniques to differentiate between normal and abnormal turkey breast meat samples.
Ethical approval
Animal Welfare Committee has approved the experiment.
Disclosure statement
No potential conflict of interest was reported by the author(s).
Correction Statement
This article has been republished with minor changes. These changes do not impact the academic content of the article.
Additional information
Funding
References
- Abu-Khalaf N. 2015. Sensing tomato’s pathogen using Visible/Near Infrared (VIS/NIR) spectroscopy and multivariate data analysis (MVDA). Palest Tech Univ Res J. 3(1):12–22.
- Baldi G, Soglia F, Mazzoni M, Sirri F, Canonico L, Babini E, Laghi L, Cavani C, Petracci M. 2018. Implications of white striping and spaghetti meat abnormalities on meat quality and histological features in broilers. Animal. 12(1):164–173.
- Brondum J, Munck L, Henckel P, Karlsson A, Tornberg E, Engelsen SB. 2000. Prediction of water-holding capacity and composition of porcine meat by comparative spectroscopy. Meat Sci. 55(2):177–185.
- Cozzolino D, Martins V, Murray I. 2002. Visible and near infrared spectroscopy of beef longissimusdorsi muscle as a means of discriminating between pasture and corn silage feeding regimes. J Near Infrared Spectrosc. 10(3):187–193.
- Dagnew MD, Crowe TG, Schoenau JJ. 2004. Measurement of nutrients in Saskatchewan hog manures using near-infrared spectroscopy. Can Biosyst Eng. 46:33–37.
- Gardner CM. 2018. Transmission versus reflectance spectroscopy for quantitation. J Biomed Opt. 23(1):018001.
- Geronimo BC, Mastelini SM, de Carvalho RH, Junior SB, Barbin DF, Shimokomaki M, Ida EI. 2019. Computer vision system and near-infrared spectroscopy for identification and classification of chicken with wooden breast, and physicochemical and technological characterization. Infrared Phys Technol. 96:303–310.
- He HJ, Wu D, Sun DW. 2013. Non-destructive and rapid analysis of moisture distribution in farmed Atlantic salmon (Salmosalar) fillets using visible and near-infrared hyperspectral imaging. Innovative Food Sci Emerg Technol. 18:237–245.
- Helrick K. 1990. Official methods of analysis. Association of Official Analytical Chemists Publ., 17th ed. Gaithersburg (MD): AOAC.
- Jeacocke RE. 2007. Continuous measurements of the pH of beef muscle in intact beef carcases. Int J Food Sci Technol. 12(4):375–386.
- Jiang H, Yoon SC, Zhuang H, Wang W, Li Y, Yang Y. 2019. Integration of spectral and textural features of visible and near-infrared hyperspectral imaging for differentiating between normal and white striping broiler breast meat. Spectrochim Acta A Mol Biomol Spectrosc. 213:118–126.
- Jolliffe I. 2011. Principal component analysis. In: Abdi, H. and Kwarteng, P., editors. International encyclopedia of statistical science. Berlin: Springer; p. 1094–1096.
- Kapper C, Klont RE, Verdonk JMAJ, Williams PC, Urlings HAP. 2012. Prediction of pork quality with near infrared spectroscopy (NIRS) 2. Feasibility and robustness of NIRS measurements under production plant conditions. Meat Sci. 91(3):300–305.
- Kuttappan VA, Brewer VB, Apple JK, Waldroup PW, Owens CM. 2012. Influence of growth rate on the occurrence of white striping in broiler breast fillets. Poult Sci. 91 (10):2677–2685.
- Kuttappan VA, Brewer VB, Mauromoustakos A, McKee SR, Emmert JL, Meullenet JF, Owens CM. 2013. Estimation of factors associated with the occurrence of white striping in broiler breast fillets. Poult Sci. 92(3):811–819.
- Kuttappan VA, Lee YS, Erf GF, Meullenet JF, McKee SR, Owens CM. 2012. Consumer acceptance of visual appearance of broiler breast meat with varying degrees of white striping. Poult Sci. 91 (5):1240–1247.
- Kuttappan VA, Owens CM, Coon C, Hargis BM, Vazquez-Anon M. 2017. Incidence of broiler breast myopathies at 2 different ages and its impact on selected raw meat quality parameters. Poult Sci. 96(8):3005–3009.
- Legin A, Rudnitskaya A, Clapham D, Seleznev B, Lord K, Vlasov Y. 2004. Electronic tongue for pharmaceutical analytics: quantification of tastes and masking effects. Anal Bioanal Chem. 380 (1):36–45.
- McDevitt RM, Gavin AJ, Andrés S, Murray I. 2005. The ability of visible and near infrared reflectance spectroscopy to predict the chemical composition of ground chicken carcasses and to discriminate between carcasses from different genotypes. J Near Infrared Spectrosc. 13 (3):109–117.
- Meulemans A, Dotreppe O, Leroy B, Istasse L, Clinquart A. 2003. Prediction of organoleptic and technological characteristics of pork meat by near infrared spectroscopy. Viandes&ProduitsCarnés-Hors Série 9èmes Journées Sciences du Muscle et Technologies des Viandes. 23 :259–262.
- Millmier A, Lorimor J, HurburghJr C, Fulhage C, Hattey J, Zhang H. 2000. Near-infrared sensing of manure nutrients. Trans ASAE. 43 (4):903.
- Moran L, Andres S, Allen P, Moloney AP. 2018. Visible and near infrared spectroscopy as an authentication tool: preliminary investigation of the prediction of the ageing time of beef steaks. Meat Sci. 142:52–58.
- Mudalal S. 2019. Incidence of white striping and its effect on the quality traits of raw and processed turkey breast meat. Food Sci Anim Resour. 39(3):410–417.
- Mudalal S, Lorenzi M, Soglia F, Cavani C, Petracci M. 2015. Implications of white striping and wooden breast abnormalities on quality traits of raw and marinated chicken meat. Animal. 9 (4):728–734.
- Petracci M, Mudalal S, Babini E, Cavani C. 2014. Effect of white striping on chemical composition and nutritional value of chicken breast meat. Ital J Anim Sci. 13 (1):3138.
- Petracci M, Mudalal S, Bonfiglio A, Cavani C. 2013. Occurrence of white striping under commercial conditions and its impact on breast meat quality in broiler chickens. Poult Sci. 92(6):1670–1675.
- Petracci M, Soglia F, Madruga M, Carvalho L, Ida E, Estévez M. 2019. Wooden‐breast, white striping, and spaghetti meat: causes, consequences and consumer perception of emerging broiler meat abnormalities. Compr Rev Food Sci Food Saf. 18(2):565–583.
- Russo E, Drigo M, Longoni C, Pezzotti R, Fasoli P, Recordati C. 2015. Evaluation of white striping prevalence and predisposing factors in broilers at slaughter. Poult Sci. 94(8):1843–1848.
- Sihvo HK, Immonen K, Puolanne E. 2014. Myodegeneration with fibrosis and regeneration in the pectoralis major muscle of broilers. Vet Pathol. 51 (3):619–623.
- Soglia F, Baldi G, Laghi L, Mudalal S, Cavani C, Petracci M. 2018. Effect of White Striping on turkey breast meat quality. Animal. 12(10):2198–2204.
- Soglia F, Mazzoni M, Petracci M. 2018. Spotlight on avian pathology: current growth-related breast meat abnormalities in broilers. Avian Pathol. 48(1):1–3.
- Tijare VV, Yang FL, Kuttappan VA, Alvarado CZ, Coon CN, Owens CM. 2016. Meat quality of broiler breast fillets with white striping and woody breast muscle myopathies. Poultr Sci. 95(9):2167–2173.
- Traffano-Schiffo M, Castro-Giraldez M, Colom R, Fito P. 2017. Development of a spectrophotometric system to detect white striping physiopathy in whole chicken carcasses. Sens. 17(5):1024.
- Werner C, Riegel J, Wicke M. 2008. Slaughter performance of four different turkey strains, with special focus on the muscle fiber structure and the meat quality of the breast muscle. Poult Sci. 87(9):1849–1859.
- Williams P, Norris K. 1987. Near-infrared technology in the agricultural and food industries. Saint Paul: Cereal Chem. Inc.
- Wold JP, Mage I, Lovland A, Sanden KW, Ofstad R. 2019. Near-infrared spectroscopy detects woody breast syndrome in chicken fillets by the markers protein content and degree of water binding. Poult Sci. 98(1):480–490.
- Wold S, Sjostrom M, Eriksson L. 2001. PLS-regression: a basic tool of chemometrics. Chemometr. Intell. Lab Syst. 58(2):109–130.
- Yancey JWS, Apple JK, Meullenet JF, Sawyer JT. 2010. Consumer responses for tenderness and overall impression can be predicted by visible and near-infrared spectroscopy, Meullenet–Owens razor shear, and Warner–Bratzler shear force. Meat Sci. 85 (3):487–492.
- Yang Y, Zhuang H, Yoon SC, Wang W, Jiang H, Jia B. 2018. Rapid classification of intact chicken breast fillets by predicting principal component score of quality traits with visible/near-Infrared spectroscopy. Food Chem. 244:184–189.
- Zaid A, Abu-Khalaf N, Mudalal S, Petracci M. 2020. Differentiation between normal and white striped turkey breasts by visible/near infrared spectroscopy and multivariate data analysis. Food Sci Anim Resour. 40(1):96–105.
- Zampiga M, Soglia F, Baldi G, Petracci M, Strasburg GM, Sirri F. 2020. Muscle abnormalities and meat quality consequences in modern turkey hybrids. Front Physiol. 12(10):2198–2204.