
 ?Mathematical formulae have been encoded as MathML and are displayed in this HTML version using MathJax in order to improve their display. Uncheck the box to turn MathJax off. This feature requires Javascript. Click on a formula to zoom.
Abstract
The aim of this study was to examine the time budgets of 20 lactating primiparous Italian Holstein cows and to determine the relationships between lying and standing behaviour, milk production and Body Condition Score in the first stage of lactation. Parturition period ranged from 15 September to 31 March and in the first seven lactation days all cows were equipped with individual 3-axes acceleration and angular displacement loggers, throughout 150 days for lying and standing behaviour measuring. Body Condition Scores (BCS) were estimated weekly, while milk production (in both morning and evening milking) and humidity and temperature air data were collected daily. Average individual milk yield was 27.3 ± 6.24 kg/d and milking time was 4.95 ± 1.94 min. Individual BCS was on average 3.46 ± 0.30 and standing daily time was 13.5 ± 2.26 h/d. Primiparous cows with BCS at parturition <3.25 quite regained BCS after 20 weeks of lactation, but produced on average 2.3 kg/d (p < .001) less than the other cows. Primiparous cows with standing time <14 h/d in the first 21 days of lactation showed higher BCS than the others cows (+0.11 on average, p < .001), but did not produce more milk (+0.1 kg/d, p = .25) on average and showed smaller Linear Score (logarithm transformation of milk somatic cell count) than other cows. Primiparous cows with standing time <14 h/d had higher number of lying bouts and less minutes between two lying bouts, probably due to a higher cow activity to feeding. Multiple regression on milk production showed a low effect of standing time, but primiparous cows lost 0.34 kg/d (p < .05) for each standing hour.
Primiparous cows with standing time <14 h/d in the first 21 days of lactation showed higher BCS than the others cows
Primiparous cows with standing time <14 h/d showed smaller somatic cell count
Primiparous cows lost 0.34 kg/d for each standing hour
HIGHLIGHTS
Introduction
Behaviour is commonly used as a sensitive indicator of animal welfare and comfort (Cook et al. Citation2005). Changes in behaviours can reflect health disorders in a herd and can be associated with lower production (Steensels et al. Citation2012). In particular, lying and standing behavioural patterns of dairy cows are useful to identify reproductive and health status of animals (Tolkamp et al. Citation2010) and are related to level of milk production (Bewley et al. Citation2010). Several studies of lying time in cows housed in free-stalls have reported that, on average, a typical dairy cow spends approximately 11.0 h/d lying down (Ito et al. Citation2014). Lying behaviour in free-stall barns is also affected by design and management factors (DeVries and von Keyserlingk Citation2005; Fregonesi et al. Citation2007), social relationships between animals (Galindo and Broom Citation2000), health status of cows (Gomez and Cook Citation2010), temperature and humidity index (THI) (Herbut and Angrecka Citation2018) and is related to level of milk production (Calamari et al. Citation2009). Gomez and Cook (Citation2010) showed that lameness was associated with an increase in time standing in the stall and a reduction in the mean number of lying bouts per day, from 13.2 bouts/d for non-lame cows to 10.9 bouts/d for moderately lame cows. Lying behaviour is also influenced by the stage of lactation: according to Vasseur et al. (Citation2012) and Ito et al. (Citation2014) lying time and lying bout duration increase with increasing days in milk (DIM). Cows in early lactation spend more time eating and less time lying than cows in late lactation (Nielsen et al. Citation2000). The automated monitoring of lying behaviour become recently available can be a powerful management tool for improving understanding of dairy cow comfort and welfare especially in large herds. Those automated systems can help dairy farm management, allowing identification and even prevention of individual or herd problems that need attention. Therefore, the correct interpretation of gathered data can be achieved only by combined monitoring systems and sensors able to integrate a wide range of information (Halachmi Citation2000).
The Body Condition Score (BCS), as known, provides a reasonably accurate indicator of a dairy cow’s body fat content and nutritional status and its monitoring is considered by animal scientists and farmers as an important factor for a successful dairy cattle management (Roche et al. Citation2007). The BCS of lactating dairy cows and its variation is related to several cow-level factors, including fertility (Pryce et al. Citation2001), parity (Roche et al. Citation2007), and season of calving (Pryce et al. Citation2001). In addition to the effects of cow-level factors on BCS, management (herd-level) factors such as stocking rate (Roche et al. Citation2007), feeding strategy and diet type (McCarthy et al. Citation2007) have also been reported to affect cow BCS. In particular, BCS at calving is an important factor that can affect early lactation Dry Matter Intake (DMI), post-calving BCS loss, milk yield, cow health and reproductive performance (Roche et al. Citation2009). Several studies (Bernabucci et al. Citation2005; Akbar et al. Citation2015) reported an optimum BCS at calving for dairy cows of 3.0 to 3.25 (5-point scale). A lower calving BCS (<3.0) is related with reduced milk production and reproduction performances, whereas cows with calving BCS greater than 3.5 (5-point scale) will reduce DMI in early lactation and milk production and will increase risk of metabolic disorders as ketosis (Roche et al. Citation2009). Therefore, BCS can be used for research, farm management, and monitoring of animal welfare and comfort (Roche et al. Citation2009).
Early lactation is a sensitive period in the life of a cow, during which the majority of health problems occur (Ingvartsen Citation2006) as a consequence of the intensive post-calving changes at hormonal, metabolic, productive and reproductive levels, especially in high producing breeds. Mainau et al. (Citation2014) found that behavioural patterns around calving were considerably modified by parturition and showed a significant parity effect. Primiparous cows, in respect to multiparous ones, have lower daily lying times during the first weeks after calving (Sepúlveda-Varas et al. Citation2014) and a parity effect was reported by Vasseur et al. (Citation2012) on lying bout frequency and lying bout length in early lactation.
Moving from these considerations, an integrated approach was performed in the present research to study the multifactor response at milk production and health in primiparous cows, paying particular attention to lying and standing behaviour, milk production and body condition score. The aims of this study were to investigate and quantify the relationships among BCS, lying behaviour and milk production in primiparous dairy cows.
Material and methods
Primiparous cow selection
The entire trial lasted 1 year and a total of 20 primiparous cows (age at calving = 2.30 ± 0.22 years; BCS at calving = 3.3 ± 0.257) were selected and included in the study, at calving, gradually during the trial. Parturition period ranged from the beginning of September to the end of March. For each cow, the monitoring period started from the first days after calving and lasted approximately 280 days for milk production and BCS, and 150 days (22 weeks) for behaviour monitoring.
Housing and farm characteristics
Data were collected at the experimental farm A. Menozzi (Landriano, Italy; 45°19′16.5″N, 9°15′56.4″E) of the University of Milan. At the beginning of the study, the herd included 72 lactating Italian Holstein cows (parity = 2.4 ± 1.2; DIM = 229 ± 119; milk yield = 24.0 ± 6.0 kg/d on average), but just 20 primiparous were selected for the trial. Cows were housed in a free-stall pen in a loose-housing layout with a total of 130 cubicles with rubber mats and 106 feeding places, split in two boxes (early lactation and late lactation cows). A total mixed ration (TMR) was delivered once daily, at approximately 10:00 a.m. Cows had ad libitum access to six water troughs and were fed the TMR consisting, on average, of 33.6% maize silage, 18.5% high moisture ear corn, 12.5% commercial mixed concentrate, 8.4% soybean meal, 6.7% maize meal, 6.2% alfalfa hay, 5.4% cotton seeds, 4.7% grass hay, 2.6% molasses, and 1.6% mineral supplement, on dry matter. Cows were milked 2 times daily at approximately 08:30 a.m. and 09:00 p.m.
Behavioural and environmental data
Lying behaviour patterns of all 20 primiparous cows were automatically recorded using individual 3-axes acceleration and angular displacement loggers (HOBO Pendant G Data Loggers – Onset Computer Corporation, Pocasset, MA). During the first seven lactation days after calving, cows were equipped with the individual data loggers throughout 150 days. These devices measured leg orientation at 1-min interval and allowed all the lying and standing behaviour data to be collected electronically (Mattachini et al. Citation2013). The devices were attached to the lateral side of the right hind leg of each cow by using plastic tough leg bands in a position such that the x-axis of the data logger was perpendicular to the ground. The degree of vertical tilt of the x- and z-axis was used to determine the lying and standing behaviour of the animal (Mattachini et al. Citation2013). Data collected by the data loggers were used to calculate lying and standing times (h/d), lying bout frequency (n bout/d) and lying bout length (min/bout) for each cow and each day.
Four data loggers were used to continuously measure the air temperature and relative humidity (HOBO U12 Temp/RH/Light/External Data Logger, Onset Computer Corporation, Bourne, MA, USA) during 1-year trial. The data loggers were placed in four different locations (2 in the resting area and 2 in feeding area) at a height of about 2 m above the floor. The recording interval for microclimatic data was set at 30 min. From the data registered by each data logger, the Temperature–Humidity Index (THI) was calculated using the following equation:
where Tdb is the dry bulb temperature in °C, and Tdp is the dew point temperature in °C (Yousef Citation1985). An average THI was determined from the THI of the four different locations in the barn.
BCS monitoring
Weekly, following the morning milking (at approximately 10:00 a.m.), individual BCS of each cow was estimated separately by both two trained observers throughout the entire study, and an average BCS was calculated from the two values. The BCS observers were trained at the start of the experiment following the method developed by Ferguson et al. (Citation1994), based entirely upon visual assessment using a 1–5 scale with 0.25 intervals. The BCS were recorded while cows were head-locked at the feed bunk.
Milk production and feed intake
Cows were milked twice a day and individual milk yield of each milking was automatically recorded (DeLaval ALPRO™, DeLaval, Sweden) during the entire trial. Individual fat and protein percentage and somatic cell counts (SCC) were obtained from the database of AIA (Italian Breeders’ Association) for each cows every month during the study. SCC were converted to Linear Scores (LS) by the following equation (Wiggans and Shook Citation1987):
The average amount of feed offered (kg/cow as fed) to the 20 primiparous cows was recorded automatically each day by a conventional feeder-mixer wagon. The DMI was estimated by subtracting the weekly average DM weight of the orts from the DM weight of the feed delivered by the feeder-mixer wagon, by DM content analysis of orts and delivered, every week for all the duration of the trial.
Statistical analysis
The data of milk production and quality of 20 primiparous cows were included from the first days after calving to 40 weeks of lactation. Weekly basis descriptive statistics (mean, SD, minimum and maximum) were used to characterise the distribution of the following dependent variables: milk yield (kg/d), milk fat (%), milk protein (%), LS, BCS, THI, DMI (kg/d) and percentage of forage (% of diet DM). Daily behavioural patterns were processed by original data, and standing and lying time (h/d), frequency of lying bouts (n/d), and mean duration of lying bouts (min/d) was calculated for each day of observation. Data were then averaged over 7-d observation period (week basis).
In the statistical analysis, 20 cows were divided into two homogeneous groups on the basis of BCS at parturition (3.0 to 3.25 or >3.25, respectively), and into two homogeneous groups on the basis of individual daily standing time in the first 21 DIM (<14 or >14 h/d, respectively), in order to have five cows for each of four subgroups. No cow had BCS <3.0 at calving. In order to study the effect of parturition season, we divided the 20 cows into two groups: 10 cows that calved between October and December (‘autumn’ period), and 10 cows that calved between January and March (‘winter’ period).
Daily cow standing time and BCS at parturition effects were included as fixed effect on milk production and lying behaviour, in a mixed model (SAS 9.4, SAS Institute Inc., Cary, NC.) as:
where Yijkl=dependent variables (milk yield, milk fat and protein, Linear Score, BCS, lying bout, lying hour, lying hour on left and lying hour on right); μ = general mean; Si = effect of standing time in the first 21 d of lactation (i = 1-2); BCSj = effect of BCS at parturition (j = 1-2); PSk = effect of parturition season (k = 1-2); S*BCSij, S*PSik, BCS*PSjk, S*BCS*PSijk = interaction effects; eijkl = residual error.
A principal component analysis was performed (PROC PRINCOMP, SAS 9.4, SAS Institute Inc., Cary, NC) on the most important variables (milk yield, DIM, milk fat and protein, Linear Score, BCS, lying bout, lying hour, lying hour on left and lying hour on right, THI) to study their multiple correlation. A consequent multiple regression analysis was computed (PROC REG, SAS 9.4, SAS Institute Inc., Cary, NC) to study the relationship between milk yield (as dependent variable) and other independent variables (DIM, milk fat and protein, Linear Score, BCS, lying bout, lying hour, lying hour on left and lying hour on right, THI).
Results and discussion
As reported in Table , average individual milk yield was 27.3 ± 6.24 kg/d (50.5% in the morning milking) and individual milking duration was 4.95 ± 1.94 min (data not shown). Milk fat was on average 3.96 ± 0.53%, milk protein 3.34 ± 0.32%, Linear Score 2.45 ± 1.47. Individual BCS was on average 3.46 ± 0.30.
Table 1. Descriptive statistics (averaged on week basis) for milk yield (kg/d), milk fat, milk protein, Linear Score, body condition score (BCS), temperature humidity index (THI) and group dry matter intake (DMI) (Number of cows = 20).
Average stall temperature was 15.8 ± 6.99 °C, average stall relative humidity was 75.6 ± 11.9%, and average THI was 60.3 ± 8.73. Average individual DMI was 25.2 ± 1.16 kg/d with a forage percentage on diet DM of 45.2 ± 2.14% (data not shown).
Standing and lying behaviour
Descriptive statistics for the standing and lying behaviour are provided in Table . Median, skewness and kurtosis are showed, because of no perfect normal distribution of data.
Table 2. Daily meanTable Footnotea values (averaged on week basis) for standing and lying behaviour patterns (standing time, lying time, lying bout frequency, lying bout duration). (Number of cows = 20, Number of total observations = 432).
Standing time lasted on average 13.5 h/d. In the first 21 d of lactation mean time of standing was 16.0 ± 2.26 h/d (data not shown). In particular, 10 cows showed a mean time <14 h/d in the first 21 DIM and 10 cows had a mean standing time of >14 h/d (data not shown).
By most standards (NFACC Citation2009), the 10.5 ± 2.26 h/d of lying found in all trial of this study represent an inadequate amount, although considerable deviation exists in recommendations for lying time. Studies on lying time in cows housed in free-stalls have reported average lying times ranging from 11.4 to 13.7 h/d (Cook et al. Citation2005). Bewley et al. (Citation2010) obtained average daily hours standing of 12.6 ± 2.0 h/d. A minimum lying time of 12 h/d is recommended under the Canadian Code of Practice for Dairy Cattle (NFACC Citation2009). Jensen et al. (Citation2005) conducted a demand experiment and concluded that heifers had a no changed demand for 12–13 h/d of lying time.
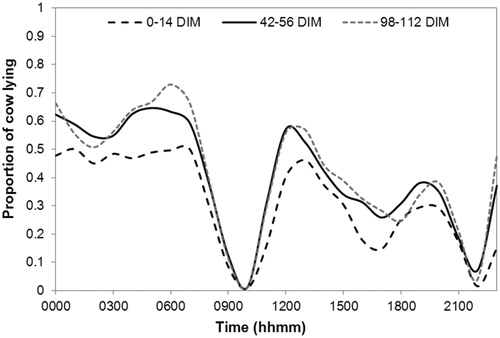
Descriptive statistics showed that cows spent more time lying down during the ‘morning’ between 00.00 a.m. and 11.59 a.m. than during the ‘evening’ between 00.00 p.m. and 11.59 p.m. This is also highlighted by Figure , which shows that between 00.00 and approximately 8.00 in the morning, most cows are lying down. After this hour, the milking and feeding activities prevealed in the herd (10.00 a.m. is the time of feed distribution). As expected, two hours after the end of the milking most of cows were lying. In the second part of the day, after 00.00 p.m. the same trend was observed between 09.00 p.m. and 11.00, due to milking time. Then, the feed pushing operation increase the number of cows standing. From Figure , it can also be noticed that the behaviour patterns differ according to the DIM. Cows in the first two weeks after calving show a lower lying time during all the day and a slower reaction to events (for example it takes more time to reach the peak of lying after milking).
Figure 1. Daily lying behaviour pattern in three different stages of lactation (0–14 DIM, 42–56 DIM, 98–112 DIM). DIM: days in milk.
The number of lying bouts in this study (8.76 ± 3.58, Table ) was lower to those reported in other studies where the range of variation was between 10.7 and 11.9 bouts/d (Blackie et al. Citation2006; Endres and Barberg Citation2007; Bewley et al. Citation2010). Lying bout duration was on average 88.2 ± 37.1 min (Table ). Both number of lying bouts and their average duration were higher in the morning than in the evening. The short overall lying time and the low number of lying bouts can be related to first parity (in this study, all cows were primiparous), as Westin et al. (Citation2016) reported a mean of daily lying time of 11.4 h/d lying down, with a lying bout frequency of 9.5 bouts/d and a median bout duration of 71 min. The authors observed increased lying time associated with increased parity, later stage of lactation and higher BCS. Older cows (parity ≥3) spent about 0.5 h/d more lying down compared with primiparous cows, and cows with BCS ≥3.5 lay down on average 1 h/d longer than cows with BCS ≤2.25.
Regarding lying laterality, in this study the primiparous cows spent 4.81 ± 2.45 h/d in right lying and 5.72 ± 2.53 h/d in left lying (+19% on right lying) (data not shown). Tucker et al. (Citation2009) reported that on average cows do not have preference for lying side, spending 51% and 49% of their total lying time per day on the left and right side, respectively, with some individual marked preferences. However, Forsberg et al. (Citation2008) found that cows in later stages of pregnancy tend to lie down more on the left side because the foetus is located mainly on the right side.
Body condition score
As showed in Figures and , BCS of primiparous cows decreased in the first weeks after calving and then increased again.
Figure 2. Milk production and Body condition score (BCS) for group of cows with BCS at parturition (<3.25 or >3.25) during the first 40 weeks of lactation.
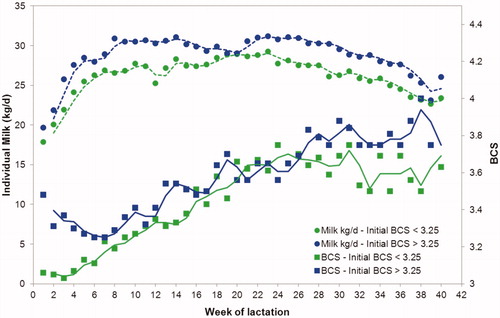
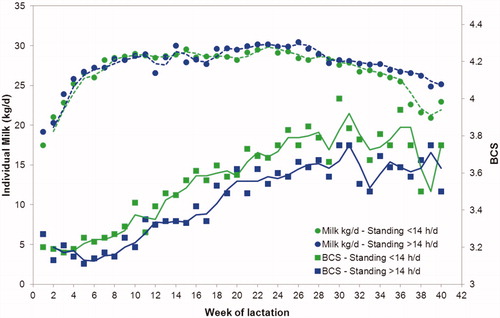
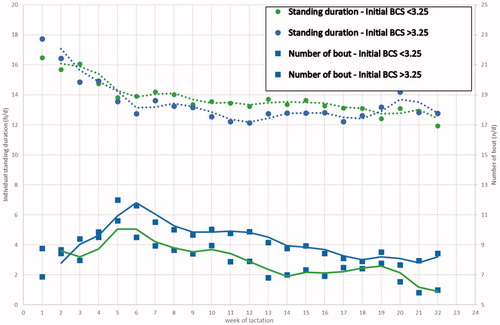
Figure 3. Milk production and Body condition score (BCS) for group of cows with daily time standing in the first 21 days of lactation (<14 or >14 h/d) during the first 40 weeks of lactation.
Cows with BCS at calving >3.25 (Figure ) lost BCS after parturition, reaching the minimum of 3.25 at 7 weeks of lactation; after that their BCS increased again regularly until 40 weeks of lactation. They have significantly higher BCS in throughout the whole lactation than the other cows (Table ). On the contrary, primiparous cows with BCS at parturition <3.25 lost less BCS in the first 3 weeks of lactation (minimum of 3.0) and then regained, but less than the other cows. They produced on average 2.3 kg/d (p < .001) less milk than the group of high BCS cows.
Table 3. Body condition score (BCS) at parturition and daily cow standing time effects on milk production and lying behaviour (Least Square means) (Number of cows = 20).
Primiparous cows with standing time in the first 21 DIM <14 h/d (Figure and Table ) showed higher BCS than the other cows (+0.11 on average, p < .001, not showed in table), but did not produce more milk (+0.1 kg/d, p = 0.25) and showed lower Linear Score than other cows. Moreover, primiparous cows with standing time <14 h/d had higher number of lying bouts during the day and lower lying bout length. Westin et al. (Citation2016) observed that, on average, thin cows (BCS ≤2.25) lay down 1 h/d less than cows with high BCS (≥3.5). Bewley et al. (Citation2010) also observed a trend of increasing lying times with increasing BCS although it was not significant. This may be due to the lack of cushioning (lower body fat) when the thin cows are lying on hard surfaces. Additionally, social competition can increase variation in lying behaviour, with subordinate cows experiencing more displacements from lying stalls (Fregonesi et al. Citation2007), causing a reduced lying time for low-ranking individuals (Galindo and Broom Citation2000).
Effects of DIM on standing or lying behaviour
In Figures and , it is showed the effect of DIM on standing time and number of bouts for primiparous cows in different standing time in the first 21 DIM (Figure ) or different BCS at parturition (Figure ). The standing time decreased in the first 10–12 weeks of lactation, particularly for the primiparous with high average standing time (>14 h/d), no differences for cows with different BCS at calving. The number of bouts are different particularly for the primiparous with high average standing time (>14 h/d). Bewley et al. (Citation2010) demonstrated that DIM was a significant predictor (P = 0.05) of mean daily hours lying. Similar results were reported by Chaplin and Munksgaard (Citation2001). Cows in early lactation may be spending more time eating, and consequently less time lying down, to meet the nutritional needs of higher milk production in early lactation.
Figure 4. Standing time (h/d) and number of bouts (n/d) by group of cows differing for the daily time standing (<14 or >14 h/d) in the first 21 days of lactation, during the first 22 weeks of lactation.
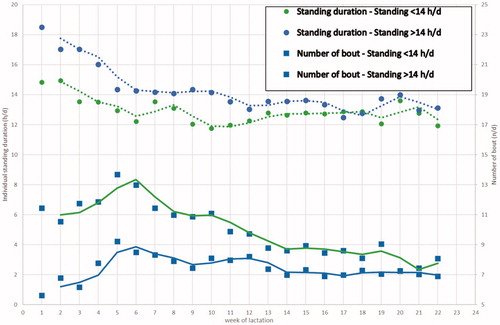
Figure 5. Standing time (h/d) and number of bouts (n/d) for group with Body condition score (BCS) at parturition (<3.25 or >3.25) during the first 22 weeks of lactation.
Multiple regression and principal component analysis
Table shows the most significant parameters (independent variables) on milk production. Model R2 was 0.432, but the Linear Score parameter explain a partial r2 as 0.319. Standing time showed a low but significant effect (r2 as 0.013) on milk production, with a milk loss of 0.34 kg/d for each standing hour.
Table 4. Multiple regression on individual milk production (kg/d).
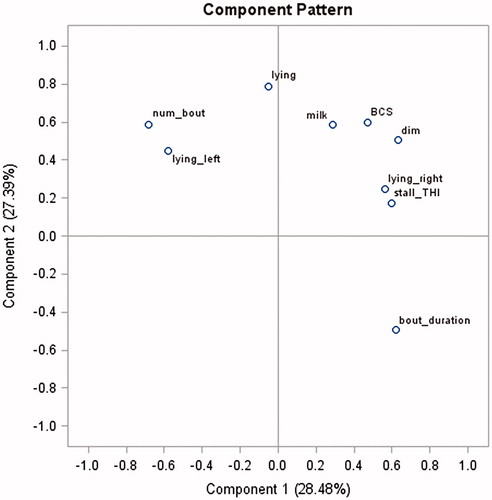
A Principal Component Analysis (Figure ) was performed on the most important parameters: the first 3 component explained the 70.3% of variability, and the first 2 components explained the 55.9% of variability. The Figure shows the high relationship between milk production, lying, BCS, stage of lactation and THI. Number of bouts are in negative relationship with lying and particularly with bout duration. The negative relationship between right and left lying is explainable by the compensation between the alternative possibility to lying on the right side or in the left side. On the contrary it is not clear the positive relationship between right lying and THI or milk production.
Figure 6. Component Pattern for principal component analysis (PCA).
Conclusions
Behaviour of dairy cows is now easy to be monitoring, because many precision dairy management technologies provide tremendous opportunities for improvements in individual animal management on dairy farms. The automatic systems for data collection can help dairy farm management and productivity, reporting individual problems that need care and attention. Continuous automated monitoring over 24-h period of behavioural patterns, integrated with other data collected by the herd management system (as milking pattern, body weight and condition) can support the early warning capability of the herd management system improving detection of health disorders and reducing time for detection, increasing the efficiency of the livestock, particularly for the first weeks of lactation.
Primiparous cows are more sensitive of the first transition period, and it is more important monitoring these cows. In this study, the primiparous cows with BCS at parturition <3.25 produced on average less than the primiparous cows with BCS at parturition >3.25. On the contrary, the primiparous cows with standing time <14 h/d in the first 21 days of lactation showed higher BCS than the cows with standing time >14 h/d, but did not produce more milk and showed smaller Linear Score than other cows. Moreover, primiparous cows with standing time <14 h/d had higher number of lying bouts and less minutes between two lying bouts, probably due to a higher cow activity to feeding. Standing time decreased in the first 10–12 weeks of lactation and showed a significant effect on milk production, with a milk loss of 0.34 kg/d for each standing hour.
From the results obtained, it is clear that the use of continuous monitoring data requires a dynamic adaptation of the model to interpret correctly the data and avoid misleading information. For example, the lying time of a primiparous cow can vary significantly during the lactation and might be affected also by several other environmental parameters like THI and cubicle characteristics. Therefore, the assessment of this value should be based on a suitable model combining different parameters. The results obtained confirm that the lying and standing behaviour and the BCS should be considered as relevant parameters as they affect the milk production. However, it will be necessary to improve the automatic monitoring behaviour in order to have a more detailed description of the activities of a cow, including drinking and eating and to develop suitable equipment for automatic recording of BCS in a herd. The research and development action in this direction are already ongoing, but more experimental data are required to obtain adequate models. Infact, in a routine and automated recording approach of precision farming management, many factors can influence cow production and behaviour and it seems essential to study decision support tools to predict problems and to improve management decisions in dairy farms.
Acknowledgments
Authors thank Regione Lombardia which financed a Postdoctoral Research Fellowship (‘Progetto Dote Ricerca’ financed by Fondo Sociale Europeo - Regione Lombardia). The authors are grateful to Mauro Colnago and Davide Reginelli of the ‘Angelo Menozzi’ farm of the University of Milan for their active support in the data collection activities.
Disclosure statement
The authors declare that there is no conflict of interest associated with the paper. The authors alone are responsible for the content and writing of this article.
References
- Akbar HT, Grala M, Vailati Riboni M, Cardoso FC, Verkerk G, McGowan J, Macdonald K, Webster J, Schutz K, Meier S, et al. 2015. Body condition score at calving affects systemic and hepatic transcriptome indicators of inflammation and nutrient metabolism in grazing dairy cows. J Dairy Sci. 98(2):1019–1032.
- Bernabucci U, Ronchi B, Lacetera N, Nardone A. 2005. Influence of body condition score on relationships between metabolic status and oxidative stress in periparturient dairy cows. J Dairy Sci. 88(6):2017–2026.
- Bewley JM, Boyce RE, Hockin J, Munksgaard L, Eicher SD, Einstein ME, Schutz MM. 2010. Influence of milk yield, stage of lactation, and body condition on dairy cattle lying behaviour measured using an automated activity monitoring sensor. J Dairy Res. 77(1):1–6.
- Blackie N, Scaife JR, Bleach E. 2006. Lying behaviour and activity of early lactation Holstein dairy cattle measured using an activity monitor. Cattle Prac. 14:139–142.
- Calamari L, Calegari F, Stefanini L. 2009. Effect of different free stall surfaces on behavioural, productive and metabolic parameters in dairy cows. Appl Anim Behav Sci. 120(1-2):9–17.
- Chaplin S, Munksgaard L. 2001. Evaluation of a simple method for assessment of rising behaviour in tethered dairy cows. Anim Sci. 72(1):191–197.
- Cook NB, Bennett TB, Nordlund KV. 2005. Monitoring indices of cow comfort in free-stall-housed dairy herds. J Dairy Sci. 88(11):3876–3885.
- DeVries TJ, von Keyserlingk M. 2005. Time of feed delivery affects the feeding and lying patterns of dairy cows. J Dairy Sci. 88(2):625–631.
- Endres MI, Barberg AE. 2007. Behavior of dairy cows in an alternative bedded-pack housing system. J Dairy Sci. 90(9):4192–4200.
- Ferguson JD, Galligan DT, Thomsen N. 1994. Principal descriptors of body condition score in Holstein cows. J Dairy Sci. 77(9):2695–2703.
- Forsberg M, Pettersson G, Ljungberg T, Svennersten-Sjaunja K. 2008. A brief note about cow lying behaviour—Do cows choose left and right lying side equally?. Appl Anim Behav Sci. 114(1-2):32–36.
- Fregonesi JA, Tucker CB, Weary DM. 2007. Overstocking reduces lying time in dairy cows. J Dairy Sci. 90(7):3349–3354.
- Galindo F, Broom DM. 2000. The relationships between social behaviour of dairy cows and the occurrence of lameness in three herds. Res Vet Sci. 69(1):75–79.
- Gomez A, Cook NB. 2010. Time budgets of lactating dairy cattle in commercial freestall herds. J Dairy Sci. 93(12):5772–5781.
- Halachmi I. 2000. Designing the optimal robotic milking barn, part 2: behaviour-based simulation. J Agric Eng Res. 77(1):67–79.
- Herbut P, Angrecka S. 2018. Relationship between THI level and dairy cows’ behaviour during summer period. Italian J Anim Sci. 17(1):226–233.
- Ingvartsen KL. 2006. Feeding- and management-related diseases in the transition cow. Physiological adaptations around calving and strategies to reduce feeding-related diseases. Anim Feed Sci Technol. 126(3-4):175–213.
- Ito K, Chapinal N, Weary DM, von Keyserlingk M. 2014. Associations between herd-level factors and lying behavior of freestall-housed dairy cows. J Dairy Sci. 97(4):2081–2089.
- Jensen MB, Pedersen LJ, Munksgaard L. 2005. The effect of reward duration on demand functions for rest in dairy heifers and lying requirements as measured by demand functions. Appl Anim Behav Sci. 90(3-4):207–217.
- Mainau E, Cuevas A, Ruiz-de-la-Torre JL, Abbeloos E, Manteca X. 2014. Effect of meloxicam administration after calving on milk production, acute phase proteins, and behavior in dairy cows. J Vet Behav. 9(6):357–363.
- Mattachini G, Riva E, Bisaglia C, Pompe J, Provolo G. 2013. Methodology for quantifying the behavioral activity of dairy cows in freestall barns. J Anim Sci. 91(10):4899–4907.
- McCarthy S, Berry DP, Dillon P, Rath M, Horan B. 2007. Influence of Holstein-Friesian strain and feed system on body weight and body condition score lactation profiles. J Dairy Sci. 90(4):1859–1869.
- NFACC 2009. Code of Practice. For the care and handling of dairy cattle. Ed. National Farm Animal Care Council (NFACC). Canada. ISBN 979-0-9812240-1-5 (e-book).
- Nielsen BL, Veerkamp RF, Lawrence AB. 2000. Effects of genotype, feed type and lactational stage on the time budget of dairy cows. Acta Agric Scand A Anim Sci. 50(4):272–278.
- Pryce JE, Coffey MP, Simm G. 2001. The relationship between body condition score and reproductive performance. J Dairy Sci. 84(6):1508–1515.
- Roche JR, Berry DP, Lee JM, Macdonald KA, Boston RC. 2007. Describing the body condition score change between successive calvings: A novel strategy generalizable to diverse cohorts. J Dairy Sci. 90(9):4378–4396.
- Roche JR, Friggens NC, Kay JK, Fisher MW, Stafford KJ, Berry DP. 2009. Invited review: Body condition score and its association with dairy cow productivity, health, and welfare. J Dairy Sci. 92(12):5769–5801.
- Sepúlveda-Varas P, Weary DM, von Keyserlingk MA. 2014. Lying behavior and postpartum health status in grazing dairy cows. J Dairy Sci. 97(10):6334–6343.
- Steensels M, Bahr C, Berckmans D, Halachmi I, Antler A, Maltz E. 2012. Lying patterns of high producing healthy dairy cows after calving in commercial herds as affected by age, environmental conditions and production. Appl Anim Behav Sci. 136(2-4):88–95.
- Tolkamp BJ, Haskell MJ, Langford FM, Roberts DJ, Morgan CA. 2010. Are cows more likely to lie down the longer they stand?. Appl Anim Behav Sci. 124(1-2):1–10.
- Tucker CB, Cox NR, Weary DM, Špinka M. 2009. Laterality of lying behaviour in dairy cattle. Appl Anim Behav Sci. 120(3-4):125–131.
- Vasseur E, Rushen J, Haley DB, de Passillé AM. 2012. Sampling cows to assess lying time for on-farm animal welfare assessment. J Dairy Sci. 95(9):4968–4977.
- Westin R, Vaughan A, de Passillé AM, DeVries TJ, Pajor EA, Pellerin D, Siegford JM, Vasseur E, Rushen J. 2016. Lying times of lactating cows on dairy farms with automatic milking systems and the relation to lameness, leg lesions, and body condition score. J Dairy Sci. 99(1):551–561.
- Wiggans GR, Shook GE. 1987. A lactation measure of somatic cell count. J Dairy Sci. 70(12):2666–2672.
- Yousef MK. 1985. Stress physiology in livestock. Boca Raton, FL, USA: CRC Press.