
 ?Mathematical formulae have been encoded as MathML and are displayed in this HTML version using MathJax in order to improve their display. Uncheck the box to turn MathJax off. This feature requires Javascript. Click on a formula to zoom.
Abstract
Optimal milking management leads to an increase in production efficiency while respecting animal welfare and health. Not all farms can equip themselves with high level technological systems for economic, generational and structural reasons. The aim of the study was to assess milking performances, cow behaviour and microclimatic condition in farm areas using an integrated data collection system based on surveys and low-cost sensors. The use of video recordings and mobile electronic flowmeters highlighted significant differences between farms that milked two and three times a day. Milking efficiency parameters (cow/hour; cows/stall per hour; milk/hour; milk/stall per hour) were calculated. In particular, the milk/stall per hour parameter emerged as the most interesting. Animal stay time, defined as the time running from when cows are moved from the housing to the beginning of the milking, was calculated and the highest value (76.3 minutes) was observed in farms with more than 10 stalls/row. Hobo pendant sensors were used in order to evaluate cows lying behaviour: no differences were observed between farms that milked two and three times a day (11.3 vs 11.0 h/d of lying). Microclimatic conditions were influenced by both the season (p < .001) and farm areas (p < .05) (holding area, milking parlour, housing area). Light intensity in milking parlour emerged as a critical point; further research is needed to understand the relation with udder hygiene and health. The integration of manual measurements with the use of low-cost sensors allowed to monitor the efficiency of the process and microclimatic condition in farm areas.
The integration of manual measurements and low-cost sensors was tested
Different parameters can be used to monitor milking efficiency
Light intensity in milking parlour emerged as a critical point
HIGHLIGHTS
Keywords:
Introduction
The use of technology is of great importance in large dairy cattle farms (Abeni et al. Citation2019), as it provides an individual or ‘per animal’ management approach (Halachmi and Guarino Citation2016). The expected increase in the number of dairy cows will require an efficient management of the milking process (O’Brien et al. Citation2012).
Different kind of technologies can be used to monitor and improve milking efficiency. Milking efficiency can be considered as a combination of different factors, such as proficiency of the milker, operation of the milking equipment and cow factors (that include udder shape, temperament and physiological traits) (Ginsberg, Citation2011). An efficient milking process is one in which the milking unit number allows a correct working routine and cow milk production level, in order to minimise over-milking and operator idle time (O’Brien et al. Citation2012). There are different parameters for the assessment of milking parlour performances such as cows milked/hour, milk yield/hour, milk yield/stall, or milk yield/stall per hour. Among these parameters, the latter seems to be the most important one; several studies showed that it neutralises the effects of the size of the milking parlour and of the number of milkers. Reid and Stewart (Citation2007) observed that farms with herds milked three times a day reached an overall parlour performance of 55 kg milk/stall per hour. Smith et al. (Citation2005) observed that applying minimal or full milking routine procedures (forestripping, pre-dipping, wiping and attaching the milking unit) can have an impact on milking efficiency. In particular, the number of cows milked per stall per hour decreased (from 5.8 to 5.3) when full milking routine procedures (predip, strip and wipe, units attach) were adopted compared to the minimum ones (strip or wipe and units attach).
The use of technology can help to increase production efficiency while respecting animal welfare and health requirements (Hartung et al. Citation2017); in this context it is useful to monitor the lying behaviour. This behaviour has proved to be an important animal based parameter for evaluating health status, well-being and productive potential of dairy cattle bred in intensive systems (Bewley et al. Citation2010; Mattachini et al. Citation2013; Vasseur et al. Citation2012). Several studies showed differences in the resting behaviour of cows milked two and three times a day. Österman and Redbo (Citation2001) argued that more frequent milking (n = 3) causes an increase in resting time in the hours before milking, probably due to lower udder pressure in comparison to cows milked twice a day. However, if a time span of 24 hours is considered, the differences between the two milking frequencies are zeroed. This may be due to the fact that cows milked twice a day compensated for the lower rest at other times of the day, although it is still unclear whether cows housed and fed indoors are able to adjust their resting pattern to compensate for the extra time required for milking (Hart et al. Citation2013). Resting behaviour depends on a variety of factors such as quality of stalls (Ito et al. Citation2009), stall size and configuration (Tucker et al. Citation2004), climate conditions (Allen et al. Citation2015) and the floor cleaning (Chen et al. Citation2017).
Milking management choices can also influence the time spent by cows in different areas of the farms (holding area, milking parlour, housing area), where microclimatic conditions can be different and promote or relieve heat stress for cows. THI (Temperature Humidity Index) is one of the most used indicators for the evaluation of the microclimatic conditions in dairy cattle farms. This parameter is a bioclimatic index that combines temperature and humidity in a unique value, allowing to assess whether environmental conditions meet the thermoneutrality thresholds of dairy cows (Bohmanova et al. Citation2007).
In order to guarantee health and well-being of dairy cows, also the housing environment lighting intensity and duration play an important role (Penev et al. Citation2014). As highlighted by Cockcroft (Citation2015), cows should be exposed to a light intensity of 200 lux per 16–18 hours in order to benefit from the positive effects of long-day photoperiod on milk production.
It must be considered that not all farms can equip themselves with high level technology for Precision Livestock Farming (PLF) systems for several reasons: economic, generational, structural. Therefore, the integration of manual surveys with the use of low-cost sensors could provide a solution to monitor the production process and highlight critical issues.
The aim of the study was to assess milking performances, cows’ behaviour and microclimatic condition in farm areas, using an integrated data collection system, based on surveys and low-cost sensors. This evaluation was performed in order to underline the most critical points of milking efficiency, milking management and microclimatic conditions that can compromise farmer profitability and animal health and welfare.
Materials and methods
Housing and milking management
This field study involved eight commercial dairy farms in northern Italy during 2 different seasons (summer and winter). In this geographical area the type of farming is intensive and characterised by a high number of heads that do not have access to summer grazing (Table ). The average herd size was 150 ± 71.7 lactating cows, housed in freestall barn with individual cubicles covered with a straw or coconut fibre bedding or rubber mattresses. All the farms were equipped with fans: in particular, 6 farms had fans in all barn areas (housing area, holding area and milking parlour), 2 farms had fans only in the housing area. Cows were milked with a conventional system in milking parlours; the majority of the farms (n = 6) had a herringbone milking parlour with on average 17.6 stalls, whereas the remaining farms (n = 2) had a parallel milking parlour, with an average number of stalls of 18. Milking frequency was different: three farms milked three times a day with an average number of milkers of 1.41, the remaining five milked twice daily, with on average 1.2 milkers. The holding area was on average 79.1 ± 24.3 m2. Milking groups ranged from 2 to 4, with different grouping criteria (stage of lactation, parity, health status).
Table 1. Milking parlour characteristics of the 8 dairy farms involved in the study.
Data collection
Evaluation of milking task timing
Mobile electronic flowmeters (Lactocorder) were used in order to evaluate (25.1 ± 6.23% of the total milking cows) the duration of udder preparation before the cluster attachment (TS500), total milking time, milk flow phases and bimodality of the milk flow curves as reported by Tamburini et al. (Citation2010). The stimulation time of the mammary gland corresponds to the time between the first teat touch by the milker and the cluster attachment.
Video recordings of two morning/afternoon milking sessions were performed in all farms through a fixed camera unit (Earthtree, TC800) positioned in the milking parlour. From the video recordings it was possible to calculate the duration of the different milking routine task phases: udder preparation or teat stimulation including forestripping, pre-dipping, drying, cluster attachment, and post-dipping. The preparation time per row was also calculated.
Movement and waiting times of 1218 lactating cows were monitored, adapting a milking task timing evaluation form developed by University of Winsconsin-Madison, Milking Research and Instruction Lab (2003). This method requires the measurement of the duration of different operations (opening exit gate, beginning first cow udder preparation, last milking unit attached and detached, first and last cow post dipped) performed during the milking process with a stopwatch only at one side of the milking parlour. The time assessment was performed for each milking group. Entry time was calculated as the time interval between opening exit gate and beginning first cow udder preparation of the following side. The stay time, defined as the time that starts when cows are moved from the housing to the beginning of the milking, was recorded for each milking group (G1-G2-G3); it gives a measure of the waiting time of the animals before milking.
Evaluation of cow resting behaviour
The resting behaviour of 36 cows (9 cows from 4 farms) was investigated using an electronic data logger (Hobo pendant G Acceleration Data Logger, Onset Computer Corporation, Pocasset, MA) between May and June 2019. The data logger is a 3-axis accelerometer with ±3 g measurement range. It was attached to the lateral side of the hind leg of each cow for 8 days and positioned with the x-axis perpendicular to the ground and pointing towards the back of the cow (dorsal direction). When milking parlour was parallel, the device was allocated on the right leg, while in the herringbone parlour the device was installed on the left/right leg depending on the cow entrance side. The logger recorded the g-force on the x, y and z-axes at 1 min intervals (Ito et al. Citation2009). Using the HOBOware software, the g-force readings were converted in degrees of tilt and exported into Microsoft Excel (Microsoft Corporation, Redmond, WA, USA). According to Ito et al. (Citation2009) the cow lying position was determined evaluating the degree of vertical tilt (y-axis). In particular, readings <60° were associated with the cow in standing position, while readings ≥60° indicated the cow lying down. The total resting time, expressed as a percentage on the total daily time and in minutes, was calculated for each milking group, as a function of the number of daily milkings and for different times of the day (1 hour before each milking, during milking and during the rest of the day). While processing the data, the feed administration was taken into account as a disturbing factor (the feed was administered twice daily in two farms and once a day in the other two).
Assessment of environmental conditions
Environmental conditions were measured in three different areas (holding area, milking parlour and housing area) for each of the 8 farms, by using a HOBO data logger, during Summer and Winter. This device recorded temperature in a range from −20 to 70 °C, relative humidity, from 5 to 95% and light intensity, from 1 to 4500 footcandles/lumens. These parameters were recorded for one week at 5 minutes intervals, and the Temperature-Humidity Index (THI) was calculated as follows (Segnalini et al. Citation2013):
where:
AT = Ambient Temperature (°C)
RH = Relative Humidity (%)
Statistical analysis
The whole dataset – including farm characteristics, milking management, milk flow parameters, animal behaviour and environmental condition – was analysed using SAS software (Version 9.4, 2012). Proc GLM were used in order to describe the data and to evaluate their relationship with the number of milkings (2 vs 3) and milking parlour size (<10 stalls/side vs > 10 stalls/side). The model used included the effects of the number of milkings and milking parlour size.
GLM procedure was also used to test the differences among seasons and between farm areas (holding area, milking parlour, housing area) of environmental conditions. The model used was the following:
where;
Yijk = dependent variables
μ = overall mean
Ai = farm area (i = holding area, milking parlour, housing area)
Sj = season (j = winter–summer)
TNij = farm area*season
eijk = residual error.
Result and discussion
Milking performances evaluation
Video recordings during milking sessions were performed in each farm. Based on video recordings the duration of milking procedures was measured, as reported in Table . Video recordings can be helpful because they do not require the presence of an external operator: milking routine can be therefore observed as milkers normally practice it. Milking routine was different between farms, both in terms of duration and the kind of operations performed. Milking time, including preparation routine and milk emission time, was 7.72 ± 1.03 min. Forestripping procedure – which is essential to check milk status, as indicator of udder health, and to remove milk with the highest bacterial content and somatic cell count (Harmon Citation1994) – was not performed by all farms involved in the study (farms performing forestripping n = 6), probably because it is considered as a time-consuming and expensive practice. Drying procedure, which is useful to remove pre-dipping detergent and to avoid milk contamination through bacteria presence on the teat surface, resulted to be the most time consuming operation (6.27 ± 2.83 s). Total preparation time per cow was determined by the sum of different factors such as the number of operations performed, and how fast and scrupulous the workers are (Smith et al. Citation2005); a complete udder preparation (pre-dipping, washing, forestripping, postdipping) can improve hygienic milk quality, as reported by Bava et al. (Citation2017). Total stimulation time, as the time from the first touch of the teat till the attach of the cluster, is a function of total preparation time per cow and the moving time of the milker. Total stimulation time can easily be measured using Lactocorder, with the presence of an operator, considering the TS500 parameter, even if that parameter includes also the time to reach a milk flow of 500 g/min. The time between the end of the stimulation and the attachment is crucial: as reported by Sandrucci et al. (Citation2007) it has to be longer than 60 seconds. On the other hand, a delayed attachment causes a transient reduction of oxytocin concentration in the first minutes of milking (Bruckmaier Citation2001). An excessive delay between the activation of milk ejection reflex and milk evacuation from the udder can negatively affect milk removal resulting in milk reflux to the ductal and alveolar compartments (Caja et al. Citation2004). If the delay is longer than 180 seconds, milk production can be reduced and residual milk can be increased. As reported in Table , the total stimulation time (TS500), measured over the eight farms involved in our study was, on average 2.66 ± 0.63 minutes, quite close to the upper suggested limit.
Table 2. Duration of milking operations (Least Square Means-LSM) in 8 farms with different milking frequency (2 vs 3 milkings/day) or different milking parlour size (<10 vs ≥10 stalls/side), measured using video and Lactocorder recordings.
Considering separately farms performing 2 vs 3 milkings, some differences in milking procedures duration was observed (Table ). In particular, all 3-milking farms performed forestripping and more time was used for this procedure (p < .05). Total preparation time per cow was much higher in 3-milkings farms than in the others (+20%, p < .05) but, at the same time, total stimulation time increased only by 4.6% (P = NS); this is the result of a scrupulous milking routine with a good work organisation in the parlour, with reduced time waste. The number of animals prepared at each side was lower in farms that performed 3 milkings than in the others. Bimodality of the milk flow curves was also lower (p < .001), as a sign of a correct routine both in terms of completeness and timing.
Increasing milking parlour size allows to milk more animals at the same time, but these two parameters have to be considered in relation to the number of milkers simultaneously working at milking. The ideal milking routine has to achieve two main objectives: the first is to clean the teat and control the milk to prevent udder health problems and avoid milk contamination; the second is to induce a correct milk ejection starting through tactile stimulation. Regarding the latter aspect, the risk of building a big parlour is to increase too much total stimulation time, decreasing effectiveness of oxitocine hormone for milk let down. In the present study total stimulation time was included in the range among 60–180 seconds, which can be considered correct, but bimodality resulted statistical different (p < .001) among farms with different parlour size (28.0% vs. 42.0%, respectively for farms with < 10 and ≥ 10 stalls per side), suggesting a reduced milk ejection effectiveness in larger milking parlours.
Total daily milking duration was very high in particular for 3 milkings/day farms where milking lasts about 11.4 hours/day, while in the others it lasts about 3.56 hours/day. This does not mean that cows are involved in milking all the time, but the milking machine is working for a long period, and this results in a faster ageing of milking machine components and higher energy consumption. Following the studies of different authors (Reid and Stewart, Citation2007; Ginsberg, Citation2011; Greenham and Humphries Citation2018), new parameters were calculated in order to compare different situations and understand where there was a need to improve (Table ). As suggested by Greenham and Humphries (Citation2018) the cows/hour parameter is a poor comparator of herds with different mean yields. In the present study it was ranging from 35 to 117 cows/hour. On the other hand, the milk/hour parameter could be more useful as an indicator of milking efficiency because it is more related to farmer income. In the present study the milk/hour parameter resulted lower than reported by other authors (Greenham and Humphries Citation2018), probably due to the long duration of milking. In order to benchmark farms of different sizes and different milking parlour types against each other the milk/stall per hour parameter can be used. The target is 55 kg of milk/stall per hour (Greenham and Humphries Citation2018) which is similar to the average value found in the present study although, as expected, great differences were found between farms with different parlour size.
Table 3. Milking efficiency parameters (least square means LSM) in farms with different milking frequency (2 vs 3 milkings/day) or different milking parlour size (<10 vs ≥10 stalls/side).
Using an opportunely adapted version of the milking task time evaluation form developed by University of Winsconsin-Madison, Milking Research and Instruction Lab (2003) the stay time for each group of cows in the holding area (Table ) could be measured. The highest stay time was measured for farms with more than 10 stalls/row, registering a maximum of 76.3 minutes. The holding area has to be well designed in order to be comfortable for cows. Both microclimatic condition and crowding can be stressful for cows. A stressful event immediately before milking can compromise milk ejection, interfering with oxytocin action.
Table 4. Stay times (Least Square Means LSM) for milking groups (G1-G2-G3) in farms with different milking frequency (2 vs 3 milkings/day) or different milking parlour size (<10 vs >10 stalls/row).
The resting behaviour and consequently the lying behaviour can be detected with visual observations or through automatic monitoring systems. Visual observations can have deficiencies such as the time needed for recording and the operator’s reliability. On the contrary automatic monitoring systems are less demanding in terms of time, less affected by the subjectivity of the evaluators, more practical under field conditions than visual evaluations and also allow the simultaneous evaluation of several animals without observer’s disturbance. The use of electronic data loggers is considered as a validated method to measure lying behaviour and in particular the total lying time, the number of lying bouts, the duration of each bout for individual cow and the laterality of their lying behaviour (Ito et al. Citation2009; O’Driscoll et al. Citation2008).
Measuring lying and standing time during the whole day allows investigating animal behaviour in relation to milking management, in particular to the number of milkings performed per day. As reported in Table there were no differences in terms of standing and lying time among farms with 2 or 3 milkings per day. This result suggests that even there is a higher standing time for 3 milkings/day farms, considering the total day budget, the cows can rest and lying the right number of hours. In this study, cows spent 11.3 h/d lying down in farms that milked twice a day and 11.0 h/d in farms that milked three times a day; these value are similar to those suggested by Cook et al. (Citation2005) and Ito et al. (Citation2009). These farms probably have a well-designed barn, comfortable for the animals that can rest adequately.
Table 5. Standing and lying time of cows in 2 and 3 milkings per day farms (184000 records).
Climatic and lighting conditions in the holding area, milking parlour and housing area
As expected, season significantly affected climatic parameters in particular for THI and relative humidity (p < .001).
Microclimatic conditions resulted significantly different also among areas (p < .05). During summer, instead, relative humidity in the holding area and milking parlour did not result different. Microclimatic parameters, as temperature and THI, were characterised by bigger variations (higher differences between minimum and maximum values) in the housing area than in the milking parlour and the holding area. Milking parlour was the area with the highest average value of THI and the lowest light intensity in both seasons (interaction season and area effects p < .005) as reported in Table . This result indicates that the milking parlour is not a comfortable place for animals and humans.
Table 6. Environmental data in holding area, milking parlour and housing area in two different seasons (1300 records).
The housing area is the place where farmers invest more on cooling systems (all farms had a fan in the housing area, 6 farms had a fan also in the holding area and milking parlour). For this reason, the housing area was characterised by a lower level of THI in both seasons. All the fans were activated through a THI based sensor.
As showed in Figure , in Summer THI exceeded the threshold of 68 for many hours of the day in all the monitored areas. As highlighted by Zimbelman et al. (Citation2009) THI threshold for high producing animals (> 35 kg milk/day) is equal to 68.
Figure 1. Daily summer (left) and winter (right) trend of THI in holding area, milking parlour and housing area. Blu line = holding area THI; orange line = housing area; grey line = milking parlour.
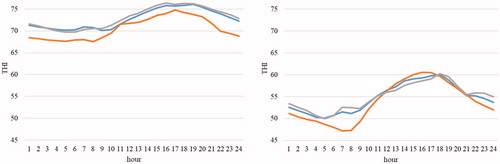
These farm areas resulted to be under climatic stressful conditions for 22.3 and 19.9 hours/day, in the milking parlour and in the housing area respectively, with potential negative effects on the animals in terms of milk production, health and welfare. Cows’ heat stress can also compromise pregnancy period and influence milk production of future generations (Tao and Dahl Citation2013).
In every farm all the areas (housing area, holding area and milking parlour) had artificial lighting. Seasonal differences in terms of light intensity were also found, as reported in Table , but the differences were specific for each area. In particular, the housing area resulted more enlightened in Winter thanks to artificial lighting, while in the holding area a better light intensity was found in Summer (Figure ).
Figure 2. Daily summer (left) and winter (right) trend of light intensity in holding area, milking parlour and housing area. Blu line = holding area THI; orange line = housing area; grey line = milking parlour.
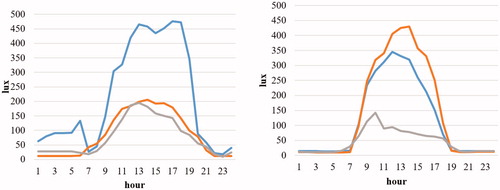
Milking parlour emerged as the area with the worst light intensity during all day in both seasons and in all the farms analysed. This result is worrying, because a bad illumination in the milking area can compromise the efficiency of the milking routine, the chance to check udder status and the well-being and health of the workers.
In barns for dairy cows, the required illuminance is 50 lux in the area of animal movements and 100 lux in the feeding spot. The optimum light intensity is probably between 40 and 120 lux (Phillips et al. Citation2000). Good lighting conditions are necessary for technological operations and to ensure hygiene and security of work. Illumination levels for dairy farms recommended by the Italian National Unification Body (UNI) are 50 and 200 lux, for animal barn and milking parlour, respectively (UNI EN 12464-1:2011). Light intensity emerged as a critical aspect in particular in the milking parlour.
Conclusions
Many sensors and data collection systems are available for evaluating milking performance, microclimatic condition and cow behaviour. Each of them has different characteristics, advantages and disadvantages. The choice of a particular method or technology has to be made on the basis of the farm situation, disposable income and time for monitoring. In the present study an integrated data collection system was presented. Some milking parameters (cow/hour; cows/stall per hour; milk/hour; milk/stall per hour) can give a good prediction of milking labour efficiency and timing. Number of milkers resulted a lacking point for the studied farms. The integration of manual measurements with the use of low-cost sensors has made it possible to monitor the efficiency of the process and the environmental conditions in the three areas that characterise a dairy cattle farm. Hence the possibility of better managing the production process by acting proactively on it. Future research needs to address the relation between animal hygiene, udder health and light intensity in the milking parlour, in order to set light intensity limits for performing a good milking job.
Disclosure statement
No potential conflict of interest was reported by the author(s).
Additional information
Funding
References
- Abeni F, Petrera F, Galli A. 2019. A survey of Italian dairy farmers’ propensity for precision livestock farming tools. Animals. 9(5):202.
- Allen JD, Hall LW, Collier RJ, Smith JF. 2015. Effect of core body temperature, time of day, and climate conditions on behavioral patterns of lactating dairy cows experiencing mild to moderate heat stress. J Dairy Sci. 98(1):118–127.
- Bava L, Colombini S, Zucali M, Decimo M, Morandi S, Silvetti T, Brasca M, Tamburini A, Crovetto GM, Sandrucci A. 2017. Efficient milking hygiene reduces bacterial spore contamination in milk. J Dairy Res. 84(3):322–328.
- Bewley JM, Boyce RE, Hockin J, Munksgaard L, Eicher SD, Einstein ME, Schutz MM. 2010. Influence of milk yield, stage of lactation, and body condition on dairy cattle lying behaviour measured using an automated activity monitoring sensor. J Dairy Res. 77(1):1–6.
- Bohmanova J, Misztal I, Cole JB. 2007. Temperature-humidity indices as indicators of milk production losses due to heat stress. J Dairy Sci. 90(4):1947–1956.
- Bruckmaier RM. 2001. Milk ejection during machine milking in dairy cows. Livest Prod Sci. 70(1–2):121–124.
- Caja G, Ayadi M, Knight CH. 2004. Changes in cisternal compartment based on stage of lactation and time since milk ejection in the udder of dairy cows. J Dairy Sci. 87(8):2409–2415.
- Chen JM, Stull CL, Ledgerwood DN, Tucker CB. 2017. Muddy conditions reduce hygiene and lying time in dairy cattle and increase time spent on concrete. J Dairy Sci. 100(3):2090–2103.
- Cockcroft PD. 2015. Cattle housing: design and management. bovine medicine, 3rd ed., West Sussex: Wiley-Blackwell. p. 520–522.
- Cook NB, Bennett TB, Nordlund KV. 2005. Monitoring indices of cow comfort in free-stall-housed dairy herds. J Dairy Sci. 88(11):3876–3885.
- Ginsberg R. 2011. Influence of milk yeld and take-off settings on milking parlour performance and udder health. Udder Health and Communication: Proceedings of the International Conference 25–27 October 2011, Utrecht, the Netherlands. p. 407–409.
- Greenham T, Humphries D. 2018. Maximising milking efficiency: a pilot study of current U.K. parameters and factors affecting the milking process. Proceedings of the British Mastitis Conference, Sixways, Worcester. The Dairy Group, The University of Nottingham, QMMS and BCVA: 61–62
- Halachmi I, Guarino M. 2016. Editorial: precision livestock farming: a ‘per animal’ approach using advanced monitoring technologies. Animal. 10(9):1482–1483.
- Harmon RJ. 1994. Physiology of mastitis and factors affecting somatic cell counts. J Dairy Sci. 77(7):2103–2112.
- Hart KD, McBride BW, Duffield TF, De Vries TJ. 2013. Effect of milking frequency on the behavior and productivity of lactating dairy cows. J Dairy Sci. 96(11):6973–6985.
- Hartung J, Banhazi T, Vranken E, Guarino M. 2017. European farmers’ experiences with precision livestock farming systems. Anim Front. 7(1):38–44.
- Ito K, Weary DM, von Keyserlingk MAG. 2009. Lying behavior: assessing within-and between- herd variation in free-stall-housed dairy cows. J Dairy Sci. 92(9):4412–4420.
- Mattachini G, Antler A, Riva E, Arbel A, Provolo G. 2013. Automated measurement of lying behavior for monitoring the comfort and welfare of lactating dairy cows. Livest Sci. 158:145–150.
- O’Brien B, Jago J, Edwards JP, Lopez-Villalobos N, McCoy F. 2012. Milking parlour size, pre-milking routine and stage of lactation affect efficiency of milking in single-operator herringbone parlours. J Dairy Res. 79(2):216–223.
- O’Driscoll KL, Boyle KL, Hanlon A. 2008. A brief note on the validation of a system for recording lying behaviour in dairy cows. Appl Anim Behav Sci. 111:195–200.
- Penev T, Radev V, Slavov T, Kirov V, Dimov D, Atanassov A, Marinov I. 2014. Effect of lighting on the growth, development, behaviour, production and reproduction traits in dairy cows. Int J Curr Microbiol App Sci. 3(11):798–810.
- Phillips CJC, Morris ID, Lomas CA, Lockwood SJ. 2000. The locomotion of dairy cows in passageways with different light intensities. Anim Welf. 9(4):421–431.
- Reid DA, Stewart SC. 2007. Using electronic data to monitor and improve parlour performance. Proc. Annual Meeting of the National Mastitis Council 12-17-2007.
- Sandrucci A, Tamburini A, Bava L, Zucali M. 2007. Factors affecting milk flow traits in dairy cows: results of a field study. J Dairy Sci. 90(3):1159–1167.
- Segnalini M, Bernabucci U, Vitali A, Nardone A, Lacetera N. 2013. Temperature humidity index scenarios in the Mediterranean basin. Int J Biometeorol. 57(3):451–458.
- Smith JF, Dhuyvetter KC, VanBaale MJ, Armstrong DV, Harner J. 2005. Managing the milking parlor: an economic consideration of profitability. Pages 165–180 in Proc. NMC Annual Conference, Austin, TX. Natl. Mastitis Counc., Madison, WI.
- Tamburini A, Bava L, Piccinini R, Zecconi A, Zucali M, Sandrucci A. 2010. Milk emission and udder health status in primiparous dairy cows during lactation. J Dairy Res. 77(1):13–19.
- Tao S, Dahl GE. 2013. Invited review: heat stress effects during late gestation on dry cows and their calves. J Dairy Sci. 96(7):4079–4093.
- Tucker CB, Weary DM, Fraser D. 2004. Free-stall dimensions: effects on preference and stall usage. J Dairy Sci. 87(5):1208–1216.
- Vasseur E, Rushen J, Haley DB, de Passillé AM. 2012. Sampling cows to assess lying time for on-farm animal welfare assessment. J Dairy Sci. 95(9):4968–4977.
- Zimbelman RB, Rhoads RP, Duff GC, Baumgard LH, Collier RJ. 2009. A-Re-Evaluation of the Impact of Temperature Humidity Index (THI) and Black Globe Humidity Index (BGHI) on Milk Production in High Producing Dairy Cows. Proceedings of the Southwest Nutrition Conference (ed.RJ Collier), pp. 158–159. Retrieved February 2, 2009, from http://cals.arizona.edu/ans/swnmc/Proceedings/2009/14Collier_09.pdf.
- Österman S, Redbo I. 2001. Effects of milking frequency on lying down and getting up behavior in dairy cows 2001. Appl Anim Behav Sci. 70:167–176.