
 ?Mathematical formulae have been encoded as MathML and are displayed in this HTML version using MathJax in order to improve their display. Uncheck the box to turn MathJax off. This feature requires Javascript. Click on a formula to zoom.
Abstract
The objective of our study was to compare animal performance of a simplified feeding system, named easy feeding (EF), with animal performance of a total mixed ration (TMR) feeding system, using high yielding dairy cows in early lactation. Two treatments, TMR (n = 16) and EF (n = 16), were evaluated in a completely randomised design. Holstein cows (617 ± 85.1 kg of body weight and 52 ± 16 days in milk) were used. The TMR treatment consisted of a mix of concentrates, corn silage and alfalfa hay, mixed and offered twice a day, while EF treatment involved the same diet components offered separately, with concentrate offered individually in the milking parlour, alfalfa hay offered as bales and corn silage offered straight from the silo bag, with no intervention of machinery in the feeding process. The feeding system had no effect on milk production, fat and protein yield, total net energy intake, total dry matter intake, body weight, body condition score plasma metabolites and eating and ruminating time. Cows in EF system had higher non-fibrous carbohydrates intake, lower intakes of crude protein and neutral detergent fibre and longer drinking time than cows in TMR system. Cows in EF selected a diet according to their preferences, which may have allowed them to achieved similar milk yield to TMR cows, despite the advantages of mixed diets in TMR treatment. Thus, the EF system is an attractive alternative to traditional TMR system, provided that costs of feeding operations are effectively reduced.
A new simplified feeding system was compared to TMR system
Milk production was similar in both feeding systems
Simplified feeding system is an attractive alternative to traditional TMR systems, provided that costs of feeding operations are effectively reduced in EF
Highlights
Introduction
The feeding system plays a major role on both animal performance (Grant and Albright Citation2001) and feeding costs (Thanh and Suksombat Citation2015). Feeding costs represent up to 60% of dairy production cost (Connor Citation2015), being the greatest cost in dairy farms (Ho et al. Citation2018), not only due to the cost of feeds itself but also due to the cost of feeding operations (Pezzuolo et al. Citation2016).
Providing a total mixed ration (TMR) to dairy cows is nowadays a common practice in commercial dairy farms with cows in confinement. The TMR offers balanced supply of nutrients in each cow’s bite all across the day (Schingoethe Citation2017) and ensures a consistent fermentation in the rumen (Fan et al. Citation2002), which may improve milk production (Schingoethe Citation2017). However, feeding TMR requires investments in machinery, increases operating costs related to feeding, and increases labour demand (Ferris et al. Citation2006). Recent studies reported that when using TMR feeding systems more than 25% of total labour time is allocated to feeding operations in dairy farms and feeding operation costs vary between $0.18 and 0.21 per cow per day, without accounting for capital investment and maintenance (Pezzuolo et al. Citation2016; Tangorra and Calcante Citation2018). While other systems, as PMR (partial mixed ration) systems reported a cost of $0.051 per kg of dry matter for distribution of silage and hay on a mixing wagon, accounting for labour, fuel, machinery depreciation and maintenance (Lazzarini et al. Citation2018).
Despite the advocated nutritional advantages of using the TMR feeding system, some dairy farmers have developed a simplified feeding system to reduce operating costs. This simplified feeding system, hereafter named easy feeding (EF), consist of feeding diet components separately with no use of machinery, offering silage straight from the bag of silo through holes on both sides of the bag, hay straight from the bales, and concentrates in the milking parlour. The EF system removes the use of specialised machinery to extract, mix, haul, and deliver feeds, which also reduces labour demand and the use of fossil energy in the feeding process. Still, EF feeding system requires a minimum capital investment for a tractor, for activities such as haul bales of hay.
In terms of animal performance, some studies reported that feeding concentrates separately from forage is associated with increased risk of metabolic disorders in dairy cattle in early lactation (Maekawa et al. Citation2002). However, offering diet components separately and for ad libitum consumption, allows animals to select feeds according to their needs (Forbes Citation2007), with the cow determining its final diet. Thus, ruminants possess a degree of nutritional wisdom in the sense they can select feeds according nutritional needs, which does not mean that animals always select a balanced diet (Provenza Citation1995).
The objective of our study was to compare animal performance of cows in a simplified feeding system with animal performance of cows in the traditional TMR feeding system, using high yielding Holstein cows in early lactation. Thus, we hypothesised that cows fed EF system could have similar animal performance than cows fed TMR system.
Materials and methods
Experimental design, animals and treatments
The study was conducted at Rafaela Research Centre of the Instituto Nacional de Tecnología Agropecuaria (INTA), Rafaela, Argentina (31° 12′ S; 61° 30′ W). All experimental procedures were conducted in accordance with the Guide for the Care and Use of Agricultural Animals in Research and Teaching (FASS Citation2010). The experiment was performed between 5 April and 27 May, 2016. This included a 21-day adaptation period followed by a 31-day experimental period. Within the experimental period, there were 3 weeks of measurements and sampling (5-day per week), with cows at 52, 64 and 78 days in milk (DIM), on average, at the beginning of each measurement week.
Twenty-four multiparous and eight primiparous Holstein dairy cows were selected from an autumn-calving herd of Rafaela Research Centre. Two treatments were evaluated, TMR and EF, in a completely randomised design. Cows were balanced for calving date (March 7 ± 16 d; mean ± SD), parity (2.6 ± 1.2) and daily milk production in previous lactation (32.1 ± 5.03 kg/d per cow), and were allocated to each treatment. Cows were grouped into four homogeneous groups (pens) per treatment (n = 4), with four cows per pen.
Cows in the TMR treatment were offered 24 kg DM/d, which would allow a 5–10% daily refusal to ensure for ad libitum feeding. The diet was formulated for a dairy cow of 620 kg of body weight (BW), producing 35 kg of milk with 3.5% milk fat and 3.0% milk true protein (NRC Citation2001). The composition of the TMR, on a dry matter (DM) basis, was 42% of concentrate, 32% of corn silage and 26% of alfalfa hay (Table ), a diet commonly used in confinement dairy systems of Argentina (Lazzarini et al. Citation2019). The diet components were mechanically mixed during 10 min once a day, at 0630 h in a mixer wagon (Mainero Model 2910, Mainero, Bell Ville, Córdoba, Argentina), and then fed to cows twice daily on a feed pad with one metre of linear space available per animal. Fifty percent of the TMR was provided at 0700 h, and the rest at 1500 h. Cows had artificial shading, drinking and resting areas available in the pen.
Table 1. Nutrient composition of the ingredients and of the total mixed ration (TMR) fed, means with standard deviation in parenthesis and the number of observations (n).
Cows in the EF treatment were offered the same diet components as cows in the TMR treatment, but feeds were offered separately. The amount, composition and quality of concentrates offered in EF treatment were equal to those offered in the TMR treatment. Pelleted concentrate was fed to cows individually in equal amounts during milking time, twice a day with an automatic feeding system.
Corn silage was offered for ad libitum intake straight from a silo bag of 270 cm diameter and 60 m length. Cow accessed silo through holes in the plastic bag, with three holes opened in a 200 cm space of silo bag (three holes each side of bag). Therefore, the 16 cows had 4 m to access silo bag from 6 holes. Electric fences were placed to keep cows’ body 30 cm away from the wall of silage. Alfalfa hay was offered for ad libitum intake as bales in round bale feeders, once a week.
Cows were placed in dry pens of 80 metres × 40 metres. Artificial shades were located besides a drinking point (10 m away) in one extreme of the pen. The silo bag and bale feeder were placed in the centre of the pen; thus, the cows could freely access to feeds, drinking and resting areas.
In both treatments, cows had access to fresh water all day and had not access to grass. Cows were milked twice daily at 0230 and 1400 h.
Feeds sampling and chemical analyses
Daily fresh samples of feeds were collected during four consecutive days within each of the 3 measurement weeks. All samples, TMR and individual feed components, were immediately frozen at −20 °C until further analysis.
Previous to analyses, samples were dried in a forced-air circulation oven at 55 °C until constant weight to determine DM content and then were ground in a Wiley mill (Arthur H. Thomas, Philadelphia, PA, USA) to pass through a 1-mm screen. Ground samples of diet components and TMR, pooled per week, were analysed for ash (method 924.05, AOAC Citation1990), total nitrogen (method 976.05, AOAC Citation1990), crude protein (CP, total nitrogen × 6.25) and ether extract (EE, method 920.39, AOAC Citation1990); neutral detergent fibre (NDF, using heat stable α-amylase and sodium sulphite, Van Soest et al. Citation1991); acid detergent fibre (ADF, method 973.18, AOAC Citation1990) and acid detergent lignin (ADL, Van Soest et al. Citation1991). The NDF and ADF are expressed inclusive of residual ash. The organic matter (OM) was determined as the difference between DM and ash content; non-fibrous carbohydrates (NFC) were calculated using the following equation: 100 − (% NDF + % CP + % EE + % ash) (NRC Citation2001). Concentration of net energy for lactation (NEl) was calculated based on NRC (Citation2001) equations. The NEl of alfalfa hay was calculated as mean between value obtained by equation of Linn and Martin (Citation1989) and NRC (Citation2001). Chemical composition of feeds is shown in Table .
Feed intake measurements
Daily dry matter intake (DMI) was measured on days 2, 3, 4 and 5 of each of the 3 measurement weeks, with cows at 52, 64 and 78 DIM, on average, at the beginning of each measurement week.
Intake per cow per day was expressed as total DMI, which represent the sum of DMI for all feeds consumed. In order to estimate silage and hay DMI in the EF treatment cows, silage was offered in two feeding bunks (0.7 m long) per pen of four cows, and hay was offered in a feed bunk (3.0 m per 1.2 m) per pen. The DMI was calculated as the difference between DM offered and refused per pen.
Concentrate intake in the EF treatment was measured as the difference between DM offered and refused per cow in the milking parlour and then the intake was averaged for the 4 cows grouped in each pen. The amount of concentrate offered in the EF treatment was calculated to be equal to the amount of concentrate offered in the TMR treatment. Thus, it was aimed to reach a similar proportion of concentrates in the whole diet in both groups.
The TMR was offered in the same feed pad throughout the experiment, but during the three measurements week, feed pad was divided into four pens to measure intake. DMI was measured as the difference between DM offered and refused per pen of four cows.
Refusals were collected from the feed bunks and feed pads each day, beginning at 0630 h, immediately before the delivery of fresh feed at 0700 h. Refusal samples were only used to determine fresh weight and DM percentage.
Animal behaviour
Animal behaviour was recorded from visual observations using an instantaneous sampling method of individual cows (Martin and Bateson Citation1993) with a 10 min scan sampling method throughout a 24 h period on all cows. Observations were performed by two observers, on day 5 of each of the 3 measurement weeks, starting at 0700 h. Each activity was assumed to persist for the entire 10 min interval. Animal behaviours were classified as: eating (i.e. grasping and chewing), ruminating (i.e. chewing regurgitated boluses of feed), drinking, and others (i.e. not showing any of the other activities). The proportion of each behavioural event per hour was calculated as the number of observations of each event over the total observations per hour.
Milk production and milk samples analyses
Individual milk production was recorded at every milking by an electronic milk metering system (DeLaval International AB, Tumba, Sweden). Milk composition was evaluated from four subsamples of milk (50 mL each) per cow, collected in four consecutive milkings at day 3 and 4 of each measurement week, using a sampler from the milk metres (DeLaval International AB, Tumba, Sweden). A pooled sample per cow per day was obtained, resulting in two samples per cow per experimental week. Samples were analysed for fat, protein and total milk solids by infra-red spectrophotometry (Milkoscan Model 4000, Foss Electric, DK-3400, Hillørod, Denmark). Samples were also used to determine somatic cell count (SCC) by flow cytometry (Fossmatic 5000; Foss Electric, Hillørod, Denmark).
Energy-corrected milk (ECM) standardised at 4% fat and 3.3% true protein was calculated using the following formula (Auldist et al. Citation2016):
Body weight, body condition score and plasma metabolites
Cows were weighed after morning milking and before feeding time, using an electronic scale (HA2000x scale, Magris, Rufino, Santa Fe, Argentina) at the beginning and at the end of the experimental period. In each of the 3 measurement weeks, body condition score (BCS) was recorded at day 1, by two trained evaluators, using the scoring system based on a 5-point scale, as described by Wildman et al. (Citation1982).
Blood samples were taken from eight cows per treatment, on day 1 of each measurement week, immediately after milking (1500 h). Samples were taken from the coccygeal vein and stored in one 10-mL tube containing sodium fluoride (5 U/mL) and another 10 mL tube without anticoagulant. Samples were immediately placed into a portable refrigerator at 4 °C and transported to the laboratory within 30 min of collection. Plasma was obtained by centrifugation (3000 × g for 15 min, 4 °C) and stored at −24˚C until further analysis. Samples for serum determination were kept chilled and allowed to clot. Blood samples were centrifuged and the serum was separated and stored at −24 °C. Samples were sent to laboratory (Wiener Laboratory, Rosario, Argentina) to determine glucose (enzymatic blood glucose) and urea nitrogen concentrations (enzymatic blood urea).
Blood β hydroxybutyrate (BHB) was measured using an electronic hand-held device (Free Style Optium xceed, Abbott Diabetes Care, Ltd., Witney, UK) validated by Voyvoda and Erdogan (Citation2010). Blood BHB concentrations ≥1.2 mmol/L were considered as indicative of subclinical ketosis.
Statistical analysis
Statistical analyses were performed using SAS (SAS Institute Inc., Cary, NC). Significance was declared at p ≤ .05 and p-values between ≥.05 and <.10 were considered tendencies. Prior to analyses, data were assessed for normality using the UNIVARIATE procedure of SAS; all assumptions of normality were met for all data. Residuals were compared to determine homogeneity of variance.
All the data analysed correspond to the 3 measurement weeks. To test the effect of treatments on dry matter intake and nutrients intake, data were averaged per pen and analysed using the MIXED procedure of SAS, treating the week as a repeated measure and the pen as the experimental unit (n = 4). The model included the fixed effects of treatment (T), week (W) of sampling, interaction between treatment and week and the random effect of the pen.
To test the effect of treatments on milk production, milk composition, animal behaviour, and plasma metabolites, data were averaged by sampling week and analysed using the MIXED procedure of SAS, treating the week as a repeated measure and the cow as experimental unit (n = 16). The model included the fixed effects of treatment, week of sampling, pen, and interaction between treatment and week, and the random effect of the cow.
Compound symmetry was selected as the covariance structure on the basis of best fit according to Akaike’s criterion. The LS MEANS statement was used to analyse differences between treatments. Somatic cell count data were log10 transformed.
To test the effect of treatment on BW and BCS parameters, data were analysed using the T-test procedure of SAS.
To test the effect of treatments on feeding behaviour events, each event expressed as a proportion of total observations per hour, the Chi-square tests were used, with the significance declared at p ≤ .025.
There were missing data from one cow during the last measurement week (week three) in the TMR treatment, because of health problems not related to the treatment per se.
Results and discussion
Weather data
Cumulative rainfall was 322 mm in the experimental period (5 April to 27 May), which was 41% higher than the average in the previous 10-year period (2006–2016) for the same period.
Mean monthly air temperatures during April and May were 18.9 and 14.4 °C during the experimental period, respectively. Average previous 10-year period (2006–2016) mean temperatures were 18.9 and 15.3 °C, for April and May, respectively.
Dry matter and nutrient intake
Total DMI were similar between treatments (22.3 kg DM/d; p > .05; Table ), which is in agreement with previous studies that compared TMR versus separated components feeding systems, with cows producing above 30 kg milk/d (Gordon et al. Citation1995; Yan et al. Citation1998). There was not interaction between treatment and experimental week for total DMI (p > .05; Table ). The F: C ratios were 60:40 and 57:43 (p < .05; Table ) for EF and TMR, respectively. There was a significant interaction between the treatment and the experimental week for the F: C ration (p < .05; Table ). Cows in the EF treatment had higher F:C than cows in TMR treatment during the second and third week, while there was not variation between treatments in the first week.
Table 2. Dry matter intake (DMI) and nutrients intake in dairy cows in total mixed ration (TMR) and easy feeding (EF) systems, least square means, standard error of difference (SED) and number of observations (n).
There was a significant interaction between the treatment and the experimental week for feed components DMI (p < .05; Table ). Comparing across periods and within treatments, cows in EF had higher silage DMI compared to cows in TMR during all experimental weeks, while EF had lower hay and concentrate DMI compared to TMR during the second and third experimental week and similar DMI of hay and concentrate between treatments in the first week. Compared with the TMR group, the cows in the EF group were able to select a diet that contained more corn silage (higher energy content) and less alfalfa hay (lower energy content) in agreement with results of Kowsar et al. (Citation2008). However, the total energy intake (NE) was the same in both groups possibly due to the higher intake of concentrates in the TMR group (p < .05; Table ). The proportion of corn silage, alfalfa hay and concentrate feed over total DMI was 0.46, 0.15, 0.40 and 0.31, 0.26, 0.43 for EF and TMR, respectively. Cows in EF treatment had the opportunity to select feeds, as alfalfa hay and corn silage and this resulted in different proportions of feeds consumed in each treatment. This reflects the ability of ruminants to select feeds and regulate their intake according to their requirements (Forbes Citation2007) and preferences, with the cow playing an active role in the feeding system (Provenza et al. Citation2003; Villalba et al. Citation2010).
There was a significant interaction between the treatment and the experimental week for the proportions of CP, NDF and ADF consumed (p < .05; Table ). The proportion of CP consumed was higher in TMR compared to EF during the second and third experimental week, while the proportion of CP was similar between treatments in the first experimental week. The proportions of NDF and ADF consumed were higher for cows in the TMR than cows in the EF for all experimental weeks. The NEl intake (NEl, Mcal/d) was similar between treatments (34.9 Mcal/d; p > .05), and energy diet concentration (NEl, Mcal/kg DM) was slightly higher for EF than TMR (p < .05). The higher intake of CP in TMR treatment was possibly due to higher intake of concentrate (with high CP content) and lower intake of corn silage (with low CP content).
Similar chemical composition of corn silage was observed in successive samplings after opening the silo bag, which suggests that quality of corn silage was maintained throughout the experiment in the EF treatment (see low SD for silage parameters in Table ).
Animal behaviour
Time spent at milking and moving cows twice per day from pen to milking parlour were 19 min/d and 30 min/d, respectively. All data regarding behaviour are shown in Table and Figure .
Figure 1. Behaviour events as a proportion of total observations per hour of cows fed TMR (●) or EF (○) systems: eating (A), ruminating (B), drinking (C) and other behaviours (D). In each hour significance is defined by *p ≤ .025 and error bars represent standard error of means (SEM). EF: easy feeding; TMR: total mixed ration.
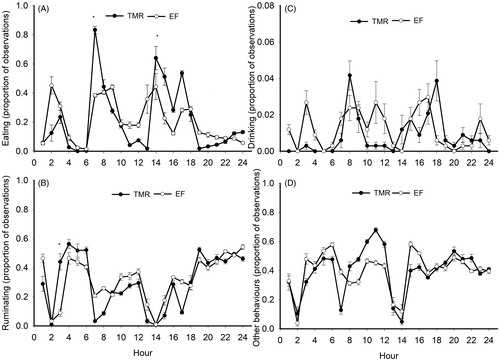
Table 3. Animal behaviour in lactating dairy cows in two feeding systems: total mixed ration (TMR) and easy feeding (EF) systems, least square means, standard error of difference (SED) and number of observations (n).
A significant interaction between treatment and the experimental week was observed for eating and ruminating time, expressed as min per day, min per kg of DM and min per kg of NDF (p < .05; Table ). Daily eating and rumination times (min per day) were similar between treatments, 293 and 446 min/d, respectively (p > .05). Cows in the EF treatment spent longer rumination (min per kg of NDF) than cows in TMR treatment during the second and third experimental week, with similar time between treatments in the first week. The higher rumination time (per kg of NDF) of cows in EF treatment would indicate the ability of silage to promote rumination when feeds are offered separately, in agreement with results of Maekawa et al. (Citation2002), who reported longer rumination time when barley silage was offered separately, compared to same silage incorporated into a TMR. Rumination time is also influenced by particle size of the diet, thus a diet offered as TMR contributes to reducing particle size and this diminish rumination time per kg NDF (Beauchemin Citation2018) compared to forage offered separately.
There was a significant interaction between the treatment and the experimental week for drinking time (p < .05; Table ). Cows in EF treatment had longer dinking time than cows in TMR treatment during the second and third experimental week, with similar drinking time between treatments in the first week (Figure ). This result was not expected in EF treatment, which had lower dietary DM content than TMR treatment. Kume et al. (Citation2010) reported that drinking water intake increased when dietary DM increased, however, correlation between these variables was low in this study. The drinking behaviour found in our study is in agreement with Cardot et al. (Citation2008), who suggested that feeding and drinking are synchronised activities, with drinking behaviour correlated to feeding events. Thus, as showed in Figure , both eating and drinking were more concentrated around feeding time in TMR than in EF treatment, and this could have led to higher water intake in EF cows, since cows were observed more frequently drinking than cows in the TMR treatment.
At the beginning of both feeding sessions (0700 and 1500 h), higher proportion of cows was observed eating in the TMR treatment than in the EF treatment (Figure ). Most rumination events occur at night time (1900–0600 h) (Figure ). Cows in EF showed a more stable pattern, i.e. lower peaks, of both eating (Figure ) and drinking (Figure ) than cows in TMR.
This may be a consequence of differences in the competitive environment at feeding, which can lead cows to modify feeding behaviour (Hosseinkhani et al. Citation2008). It is possible that cows fed with mixer wagon only twice a day (as in TMR treatment) were more stimulated to eat immediately after feeds were offered, and therefore, showed a more competitive feeding behaviour than cows in EF (DeVries et al. Citation2005). Highly competitive times at the feed bunk for dairy cattle occur when fresh feed is delivered (DeVries et al. Citation2005).
Milk production and milk composition
Milk production and milk composition are shown in Table . There were not interaction between treatment and week experimental for milk production and milk composition (p > .05). Milk, ECM, fat, protein and total solids yields were similar (p > .05) between treatments. This is similar to findings in previous studies comparing TMR and separated components feeding systems with cows producing less than 28 kg milk/d, (Holter et al. Citation1977; Phipps et al. Citation1984; Nocek et al. Citation1986; Agnew et al. Citation1996). However, studies involving dairy cows producing more than 28 kg milk/d reported higher yields of milk, fat or protein for TMR treatment than for separated components treatments (Gordon et al. Citation1995; Yan et al. Citation1998). Gordon et al. (Citation1995), reviewing previous experiments, concluded that milk yield responses to TMR treatment were greater when the proportion of concentrate in the diet increased up to 0.6, for high yielding cows in early lactation, which is higher than the ratio of 0.40 and 0.42 in the EF and TMR treatments of the present study.
Table 4. Milk yield and milk composition in dairy cows in total mixed ration (TMR) and easy feeding (EF) systems, least square means, standard error of difference (SED) and number of observations (n).
The ability of cows to select a diet according to their preferences, may have allowed cows in this treatment to achieved similar milk yield than TMR, despite the advantages of mixed diets in TMR treatment, as shown in previous studies. In addition the relatively low proportion of concentrates used in our experiment (<42%), which was relatively low compared to similar experiments, may have set a limit to milk yield of TMR cows.
Milk protein concentration was higher in TMR than in EF treatment, which could be associated with higher protein intake in this treatment as reported by Barros et al. (Citation2017), although their study was performed with cows in late lactation and our study in early lactation. No differences (p > .05) were detected for milk fat concentration, total milk solids concentration and SCC between treatments.
The coefficient of variation of daily milk production over the experimental period was lower for cows in EF than for those in TMR (22 vs. 30%, respectively, data not shown). This could indirectly reflect less variation of DMI among cows in the EF treatment. More competitive intake patterns could result in higher variation of DMI among cows (Beauchemin Citation2018).
Body weight, body condition score and plasma metabolites
There were no differences in BW change and BCS change of cows between treatments (p > .05; Table ). There were not interaction between treatment and week experimental for plasma metabolites (p > .05; Table ). Concentrations of urea nitrogen in plasma, BHB and blood glucose concentrations did not differ (p > .05) between treatments. This agrees with previous studies that showed the lack of differences in BW, BCS and BHB between EF and TMR treatments (Nocek et al. Citation1986; Gordon et al. Citation1995; Ferris et al. Citation2006).
Table 5. Body weight (BW) and body condition score (BCS) changes and plasma metabolites of the lactating cows in total mixed ration (TMR) and easy feeding (EF) systems, least square means, standard error of difference (SED) and number of observations (n).
Conclusions
In the present study, the feeding system had no effect on milk production, fat and protein yield, total energy intake, total dry matter intake, body weight, body condition score plasma metabolites and eating and ruminating time. Cows in EF system had higher non-fibrous carbohydrates intake, lower intakes of crude protein and neutral detergent fibre and longer drinking time than cows in TMR system.
Since the feeding system had no effect on milk production per cow, the EF system is an attractive alternative to traditional TMR feeding systems, provided that costs of feeding operations are effectively reduced in EF.
Further research on this simplified feeding system should explore full lactation performance, the inclusion of grazed pastures in the diet, and the quantification of labour demand and costs associated with feeding.
Ethical approval
All experimental procedures were conducted in accordance with the Guide for the Care and Use of Agricultural Animals in Research and Teaching (FASS 2010).
Acknowledgments
The authors gratefully acknowledge the staff of the Research Centre Instituto Nacional de Tecnología Agropecuaria-Rafaela for financial support and research services. The authors thank grade students of Universidad Nacional del Litoral y Universidad Nacional de Villa María for helping with data collection. The authors specially thank Belen Lazzarini, Juan Grigera, Nicolas Lyons, Gonzalo Tuñon and Daniel Lovino for their reviews and discussions on the manuscript. The principal author acknowledges support from CONICET doctoral scholarship.
Disclosure statement
The authors state that they have no conflict of interest.
References
- Agnew KW, Mayne CS, Doherty JG. 1996. An examination of the effect of method and level of concentrate feeding on milk production in dairy cows offered a grass silage based diet. Anim Sci. 63:21–31.
- AOAC. 1990. Official methods of analysis. 15th ed. Arlington (VA): Association of Official Analytical Chemists.
- Auldist MJ, Marett LC, Greenwood JS, Wright MM, Hannah M, Jacobs JL, Wales WJ. 2016. Milk production responses to different strategies for feeding supplements to grazing dairy cows. J Dairy Sci. 99:1–15.
- Barros T, Quaassdorff MA, Aguerre MJ, Colmenero JO, Bertics SJ, Crump PM, Wattiaux MA. 2017. Effects of dietary crude protein concentration on late-lactation dairy cow performance and indicators of nitrogen utilization. J Dairy Sci. 100:5434–5448.
- Beauchemin KA. 2018. Invited review: current perspectives on eating and rumination activity in dairy cows. J Dairy Sci. 101:4762–4784.
- Cardot V, Le Roux Y, Jurjanz S. 2008. Drinking behavior of lactating dairy cows and prediction of their water intake. J Dairy Sci. 91:2257–2264.
- Connor EE. 2015. Invited review: Improving feed efficiency in dairy production: challenges and possibilities. Animal. 9:395–408.
- DeVries TJ, Von Keyserling MAG, Beauchemin KA. 2005. Frequency of feed delivery affects the behavior of lactating dairy cows. J Dairy Sci. 88:3553–3562.
- Fan YK, Lin YL, Chen KJ, Chiou PWS. 2002. Effect of concentrate feeding frequency versus total mixed ration on lactational performance and ruminal characteristics of Holstein cows. Asian Australas J Anim Sci. 15:658–664.
- FASS. 2010. Guide for the care and use of agricultural animals in research and teaching. 3rd ed. Champaign (IL): FASS.
- Ferris CP, Frost JP, Binnie RC, Patterson DC. 2006. Dairy cow performance and labour inputs associated with two silage feeding systems. Grass and Forage Sci. 61:304–314.
- Forbes JM. 2007. A personal view of how ruminant animals control their intake and choice of food: minimal total discomfort. Nutr Res Rev. 20:132–146.
- Grant RJ, Albright JL. 2001. Effect of animal grouping on feeding behavior and intake of dairy cattle. J Dairy Sci. 84:E156–E163.
- Gordon FJ, Patterson DC, Yan T, Porter MG, Mayne CS, Unsworth EF. 1995. The influence of genetic index for milk production on the response to complete diet feeding and the utilisation of energy and nitrogen. Anim Sci. 61:199–210.
- Ho CKM, Heard JW, Wales WJ, Jacobs JL, Doyle PT, Malcolm B. 2018. Evaluating the economics of concentrate feeding decisions in grazing dairy cows. Anim Prod Sci. 58:1329–1340.
- Holter JB, Urban WE, Hayes H, Davis HA. 1977. Utilisation of diet components fed blended or separately to lactating cows. J Dairy Sci. 60:1288–1293.
- Hosseinkhani A, DeVries TJ, Proudfoot KL, Valizadeh R, Veira DM, Von Keyserlingk MAG. 2008. The effects of feed bunk competition on the feed sorting behavior of close-up dry cows. J Dairy Sci. 91:1115–1121.
- Kowsar R, Ghorbani GR, Alikhani M, Khorvash M, Nikkhah A. 2008. Corn silage partially replacing short alfalfa hay to optimize forage use in total mixed rations for lactating cows. J Dairy Sci. 91:4755–4764.
- Kume S, Nonaka K, Oshita T, Kozakai T. 2010. Evaluation of drinking water intake, feed water intake and total water intake in dry and lactating cows fed silages. Livest Sci. 128:46–51.
- Lazzarini B, Baudracco J, Tuñon G, Gastaldi L, Lyons N, Quattrochi H, Lopez-Villalobos N. 2019. Milk production from dairy cows in Argentina: current state and perspectives for the future. Appl Anim Sci. 35:426–432.
- Lazzarini B, Lopez-Villalobos N, Lyons N, Hendrikse L, Baudracco J. 2018. Productive, economic and risk assessment of grazing dairy systems with supplemented cows milked once a day. Animal. 12:1077–1083.
- Linn JG, Martin NP. 1989. Forage quality tests and interpretation. Bulletin AG-FO-2637. Minnesota Extension Service, University of Minnesota St. Paul, Minnesota.
- Maekawa M, Beauchemin KA, Christensen DA. 2002. Effect of concentrate level and feeding management on chewing activities, saliva production, and ruminal pH of lactating dairy cows. J Dairy Sci. 85:1165–1175.
- Martin P, Bateson P. 1993. Measuring behavior: an introductory guide. 2nd ed. Cambridge (UK): Cambridge University Press.
- Nocek JE, Steele RL, Braund DG. 1986. Performance of dairy cows fed forage and grain separately versus a total mixed ration. J Dairy Sci. 69:2140–2147.
- NRC. 2001. Nutrient requirement of dairy cattle. Washington (DC): National Academy Press.
- Pezzuolo A, Chiumenti A, Sartori L, Da Borso F. 2016. Automatic feeding system: evaluation of energy consumption and labour requirement in north-east Italy dairy farm. Proceedings of 15th International Scientific Conference on Engineering for Rural Development; Jelgava, Latvia. p. 882–887.
- Phipps RH, Bines JA, Fulford RJ, Weller RF. 1984. Complete diets for dairy cows: a comparison between complete diets and separate ingredients. J Agric Sci. 103:171–180.
- Provenza FD. 1995. Postingestive feedback as an elementary determinant of food preference and intake in ruminants. Rangel Ecol Manag. 48:2–17.
- Provenza FD, Villalba JJ, Dziba LE, Atwood SB, Banner RE. 2003. Linking herbivore experience, varied diets, and plant biochemical diversity. Small Rumin Res. 49:257–274.
- Schingoethe DJ. 2017. A 100-year review: total mixed ration feeding of dairy cows. J Dairy Sci. 100:10143–10150.
- Tangorra FM, Calcante A. 2018. Energy consumption and technical-economic analysis of an automatic feeding system for dairy farms: results from a field test. J Agricult Engineer. 49:228–232.
- Thanh LP, Suksombat W. 2015. Milk production and income over feed costs in dairy cows fed medium-roasted soybean meal and corn dried distiller’s grains with solubles. Asian Australas J Anim Sci. 28:519–529.
- Van Soest PJ, Robertson JB, Lewis BA. 1991. Methods for dietary fiber, neutral detergent fiber, and nonstarch polysaccharides in relation to animal nutrition. J Dairy Sci. 74:3583–3597.
- Villalba JJ, Provenza FD, Manteca X. 2010. Links between ruminants’ food preference and their welfare. Animal. 4:1240–1247.
- Voyvoda H, Erdogan H. 2010. Use of a hand-held meter for detecting subclinical ketosis in dairy cows. Res Vet Sci. 89:344–351.
- Wildman EE, Jones GM, Wagner PE, Boman RL, Troutt HG, Lesch TN. 1982. A dairy cow body condition scoring system and its relationship to selected production characteristics. J. Dairy Sci. 65:495–501.
- Yan T, Patterson DC, Gordon FJ. 1998. The effect of two methods of feeding the concentrate supplement to dairy cows of high genetic merit. Anim Sci. 67:395–403.