
Abstract
Milk consumption has long been associated with better bone development in children, contrary to sugar-sweetened beverages (SSB); however, stronger evidence are needed. Therefore, this study aimed to use a pig model for growing children to evaluate the effect of milk vs. SBB consumption on the developing skeleton. For this, we used 24 pre-pubertal pigs (12 in Experiment 1, 8 males and 4 females, and 12 in Experiment 2, all males) randomly split into two groups to receive up to 750 mL of whole milk supplementation or an isocaloric maltodextrin solution (as SSB) for 13 or 11 weeks. Ultrasonography was used throughout the trial to record in vivo bone growth. The pigs were euthanised, and bones of the appendicular skeleton and the mandible were collected and measured with Dual X-Ray Absorptiometry (DEXA). A three-point bending test was used for biomechanical testing. After fracture, the cortical bone thickness was measured at three regions of the femur. Of the DEXA measurements taken, only the bone mineral density of the mandible was lower in pigs receiving milk vs. SSB. Compared to SSB, pigs consuming milk had also a larger occlusal surface thickness indicating lower teeth grinding, suggesting a calming effect of the milk. There was no difference in any biomechanical tests. In femur, the medial cortical was thicker in the SSB group, while the lateral cortical was thicker in the group receiving milk. Overall, there appears to be no effect of short-term milk supplementation on bone growth, mineral density and strength.
Larger bone density and size was observed in male vs. female before puberty.
Three cups of whole milk per day for 3 months did not improve bone density and strength compared to isoenergetic sugar-sweetened beverage in prepubertal pigs used as model for growing children despite higher amount of calcium in the diet.
Lower bone density in the ramus of the mandible and less teeth grinding indicated a reduced stress in the animals feed with milk.
Highlights
Keywords:
Introduction
An estimated 200 million people suffer from osteoporosis worldwide (Sözen et al. Citation2017). Each year in the U.S., approximately eight million people experience pathologic fractures related to osteoporosis, which results in 20 billion dollars in related healthcare costs (Nanes and Kallen Citation2014). To alleviate this trend, increases in peak bone mass have proven critical to decrease fracture risk later in life. Peak bone mass (PBM) can be described as the amount of bone mass attained during the growth period that peaks at the end of skeletal maturation (Weaver et al. Citation2016). During childhood and adolescence, a peak in bone mineral acquisition velocity (12 years old for girls, 14 years old for boys) results in accumulation of 39% of total body bone mineral and by 16–18 years of age, 95% of adult PBM has been accrued. Therefore, nutrition during pre-puberty and puberty is critical for providing the necessary building blocks for proper bone development (Weaver et al. Citation2016). Achieving the largest relative PBM is pivotal for maintaining bone integrity. Higher PBM increases the amount of bone an individual can afford to lose without increasing risk of osteoporosis when bone resorption overtakes bone formation (Caroli et al. Citation2011; Stagi et al. Citation2013). Therefore, preventing osteoporosis may be achieved by maximising PBM and slowing the loss of bone after peak has been attained (Viljakainen Citation2016; Weaver et al. Citation2016).
Non-modifiable factors such as age, gender and genetics work in tandem with modifiable factors such as lifestyle, activity level and nutrition to optimise bone health (Rizzoli Citation2014a). Among nutrients, milk has been considered the perfect food for bone development (Rizzoli Citation2014b). Despite this, the economic research service of the United States Department of Agriculture (USDA ERS, Citation2018) has reported a decrease in fluid milk consumption by almost 38% since 1975.
Children (males and females age 5–14) are more susceptible to fractures than young or mature adults as peak in fracture risk occurs just before the onset of puberty (Weaver et al. Citation2016). Consumption of milk and other dairy products during childhood and adolescence is positively associated with total bone area, cortical area and cortical content (Movassagh et al. Citation2017). When children sustain a forearm trauma, those with higher bone mineral density (BMD) have increased resistance to fracture (Rizzoli et al. Citation2010; Weaver et al. Citation2016). In contrast, pre-pubertal children with bovine milk allergy displayed lower BMD despite normal growth, suggesting milk avoidance during growth is detrimental to mineral accrual and may affect PBM (Mailhot et al. Citation2016). Unfortunately, these observational studies make it difficult to demonstrate the direct effect of milk consumption on bone health. According to the most recent review of the literature, dairy products improve total body bone mineral content (BMC) in children only when baseline calcium intake is below 750 mg/day (Heuvel and Steijns Citation2018 ). However, despite multiple randomised-controlled trials, there is still no direct evidence for an effect of dairy products in reducing fracture risk in children (Heuvel and Steijns Citation2018 ).
On any given day, 50% of adults and 60% of youth (ages 2–19) will consume a soda or sport drink, known as sugar-sweetened beverages (SSB). After a spike in consumption from 1977 to 2001 (Han and Powell Citation2013), SSB consumption has seen a significant decline in the last 15 years (Bleich et al. Citation2018). Despite this decline, SSB consumption still contributes to roughly 7% of the total daily calorie intake among youth and adults (Powell and Maciejewski Citation2018). Consuming SSB may have deleterious effects on bone health (Händel et al. Citation2015). Whiting et al. (Citation2001) evaluated the average beverage type intake around peak bone mineral accrual and found that low nutrient-dense beverage choices exerted negative effects on total bone mass. Rats provided with SSB had significant decrease in femur BMD (Tian and Yu Citation2017), while high-glucose beverages suppressed the differentiation and proliferation of osteoblasts, resulting in a decreased rate of bone formation (Terada et al. Citation1998). Long-term consumption of soft drinks appears to also have a catabolic effect on bone in both boys and girls (Libuda et al. Citation2008). These results suggest that consuming SSB rather than nutrient-rich beverages may be detrimental to bone health during growth. However, to our knowledge, no work has been performed to evaluate the direct effects of milk consumption versus SSB consumption on the growing skeleton.
Based on the above data, our hypothesis is that milk consumption, in combination with an adequate diet, increases BMC, BMD and bone strength when compared to SSB consumption. Conventionally, rodents have been used to evaluate human disease due to ease of genetic manipulation and handling (Perlman Citation2016), including studies on bone growth (Jilka Citation2013). However, their small size and absence of Harversian systems are weaknesses in rodents as an animal model to study effects of nutrients on bone growth in children (Jilka Citation2013). The skeleton of growing pigs is more similar to humans than rodents, making them a more suitable animal model (Lüthje et al. Citation2018). Therefore, to test our hypothesis, we used growing pre-pubertal pigs to determine the effect of supplementing milk or SSB on 1) growth rates and bone mineral density, 2) biomechanical strength of bone and 3) physical bone characteristics.
Materials and methods
Study design
Experimental procedures used in this study were approved by the Institutional Animal Care and Use Committees of Oregon State University (protocol # 4691). Details of the experimental design are available elsewhere (Swanson et al. Citation2019). Briefly, two experiments were performed. In Experiment 1, twelve 5-week-old Yorkshire pigs, 8 males and 4 females from two litters, and in Experiment 2, twelve 8- to 9-week-old Duroc-Berkshire male pigs from 4 litters were used. Animals were blocked by litter and sex and randomly assigned to receive 750 mL, the USDA recommended amount per day for children, of whole fresh cow milk collected daily from the bulk milk tank of the Oregon State University Dairy Centre (4.8% fat, 3.6% protein, 4.8% lactose) or a daily prepared equivalent of maltodextrin balanced only to be an isocaloric solution. (500 mL) (cat# 007-345-0341, Honeyville, Ogden, UT, USA). The pigs were provided an ad libitum grower ration containing 0.5% calcium, 15.5% crude protein, 0.4% phosphorus, 2.5% crude fat, 0.95% lysine and 25 spu/lb phytase activity (according to the minimum guarantee analysis or the commercial formulation). Prior to receiving grower chow, the pigs were given the milk or maltodextrin solution in their feed bins and only given chow once all the milk or solution was finished. While fed ad libitum, feed offered was measured prior each feeding and any residual was collected and measured to estimate overall feed intake. Pigs were treated for 13 or 11 weeks in Experiment 1 and 2, respectively, and euthanised using captive bolt (Experiment 1) and barbiturate injection (Experiment 2) at the end of the study. Euthanasia styles differed as experiment 2 included neurological development detailed data in other research.
In vivo bone growth
Ultrasonography was used to track growth of the right femur and right last rib using a Mindray M5 Ultrasound (#MR-01001893, Shenzhen Mindray Bio-Medical Electronics C., LTD., Nanshan, Shenzhen, China) with a variable frequency 5–8 MHz micro-convex transducer. For Experiment 1 and 2, ultrasound measurements were taken at four (6, 10, 14 and 18 weeks of age) and three timepoints (8, 12 and 18 weeks of age), respectively. Ultrasounds were measured using ImageJ (National Institutes of Health, Bethesda, MD, USA, v 1.51j8). First, the measurement scale was calibrated from the measuring depth of the image. Next, a straight line was drawn across the bone to measure bone diameter. Images were analysed by an individual blinded to treatments.
Sample collection and preservation
Immediately after euthanasia, the following samples were collected. From Experiment 1: left femur, last left rib, and left and right tibia/fibula. From Experiment 2: left femur, last left rib, left radius, left humerus and left mandible. Bones to be used for DEXA analysis were stripped of all adherent tissue, fixed in 10% buffered formalin (cat# CA71007-348, VWR, Radnor, PA, USA) for 2 months and stored in 70% ethanol at room temperature until analysis (Vesper et al. Citation2017). Bones for biomechanical evaluation had adherent tissue left and were wrapped in gauze soaked with serological saline solution (lot#A130607-1, VEDCO, St. Joseph, MO, USA) and stored at −20 °C until evaluation (Vesper et al. Citation2017).
Dexa and femur/mandible volume
Excised bones were scanned by DEXA (Hologic Discovery QDR series) at the Samaritan Athletic Medicine Centre in Corvallis, Oregon. Calibration was performed on a lumbar spine phantom prior to scanning the samples. Bones were positioned parallel to scanner table and scanned using the Rat Whole Body setting at high definition. Parameters measured included BMC (g), bone area (cm2) and BMD (g/cm2). Regions of interest of the mandible (body, ramus, teeth), femur (proximal metaphysis, diaphysis, distal metaphysis) and humerus (proximal metaphysis, diaphysis, distal metaphysis) were further evaluated for the same parameters. The same person to minimise operator variability performed all scans.
Femur and mandible volume were measured via water displacement. A 2000 mL graduated cylinder was filled with 1000-mL of distilled water and each femur was carefully placed inside and the new volume was recorded. Femur volume was then calculated by subtracting 1000-mL from the new volume reading and rounded to the nearest mL. To measure the volume of the mandible, a one-half inch hole was drilled into the side of a 1.5 L plastic container and a plastic tube was inserted and heated to create an airtight seal. The plastic tube drained into a 200-mL graduated cylinder. Water was added to the container and allowed to reach equilibrium. Known volumes of water were added to create a standard curve for volume measurement. After this calibration, each mandible was carefully submerged and volume was recorded to the nearest mL (Supplementary Figure 1).
Three-point bending evaluation
Frozen femurs were thawed at 4° C for 24 hours prior to analysis. All adherent tissue was subsequently removed, and bones were re-wrapped in gauze soaked with saline to prevent drying. The femoral diameter was measured using a 0–150 mm range Swiss Precision Instruments (SPI) electronic calliper (cat#14-792-6, Garden Grove, CA, USA) with 0.01 mm display resolution and ± .03 mm accuracy.
An Instron 5900 series high-capacity testing system (100 kN) dual-column floor model in the Instron Calibration Laboratory in the Department of Mechanical, Industrial, and Materials Engineering at Oregon State University was used for three-point bending evaluation. Prior to testing, each femur was warmed to room temperature for one hour and the midpoint of the diaphysis was determined. Each femur was supported by an adjustable fulcrum and adjusted to the active length of the bone and the load point was set in the middle of the diaphysis. The two supports and load applicator were rounded to avoid shearing. The anterior surface (flattest side) of the bone was facing downward and load was applied at 10 mm/min. Load was applied until bone fracture and corresponding force curves were generated and evaluated using Bluehill 3 Testing software (Instron, Norwood, MA, USA). Parameters measured were ultimate bending strength (N), experimental deformation at fracture (mm) and overall bone stiffness (N/mm).
Cortical thickness evaluation
After three-point bending evaluation, each femur was cut using a Dremel moto-tool model 395 type 5 variable speed saw equipped with cut-off wheels No. 409 at 30,000 rpm. Three locations were selected for evaluation: fracture point, proximal femur and distal femur. Thickness measurements of the dorsal, ventral, lateral and medial diaphysis were taken with the same SPI electronic calliper mentioned above. A picture was taken using an iPhone 7 with 16-megapixel camera of the midpoint and the cross-sectional area, medullary cavity area, cortical area, and average cortical thickness were measured using ImageJ. The measurement scale was calibrated from the ruler held against the bone during the picture. Next, using the tracing feature of ImageJ, the endosteal surface and periosteal surface were traced and measured to obtain medullary cavity area and cross-sectional area, respectively. Cortical area was obtained via subtraction (cross-sectional area – medullary cavity area = cortical area). A straight line was drawn to measure cortical thickness in 10 equidistant places along the cross-section to measure average cortical thickness (Supplementary Figure 2).
Enamel thickness
The fourth premolar was removed from the left-half of the mandible (using the Dremel mentioned above) and cut along a sagittal plane to expose the enamel. Pictures were taken of the tooth using an iPhone 7 with 16-megapixel camera and enamel thickness was evaluated using ImageJ. The measurement scale was calibrated from the ruler held against the tooth. Next, a straight line was drawn across the enamel in 10 equidistant places apart to measure average enamel thickness (Supplementary Figure 3). The thickness of the occlusal surface of each tooth was measured in the same manner.
Statistical analysis
Statistical analysis was performed using R Studio (Version 3.4.3). Ultrasound measurements were analysed with repeated measures ANOVA using the ‘stats’ package in R. All other data were analysed using a liner mixed effects model with fixed effects of treatment (and sex for experiment 1) and random effect of pig. Relationships between variables were made using Pearson correlations. This was accomplished with the ‘lme’ function in R. Statistical significance was set at p < .05 and statistical tendencies at p < .10 and all data are expressed as mean ± SE.
Results and discussion
In vivo bone growth
The overall growth of the rib and femur had a steady but significant increase over time with no differences between treatments at any timepoint measured (Figure ). The increases observed through time are consistent with growth during childhood in humans being relatively steady (Kelly and Diméglio Citation2008). In the pre-adolescent years, human bone accrual occurs at a rate of approximately 5–6 cm per year (length) (Stagi et al. Citation2013). However, once the adolescent growth spurt occurs, peak growth velocity can reach approximately 8.5 and 10.4 cm per year for girls and boys, respectively (Rauch et al. Citation2004).
Figure 1. Ultrasonography in vivo measurement of the thickness of the right femur and last right rib in Experiment 1 (A and C) with 5-week-old male (n = 4/group) and female (n = 2/group) pigs and Experiment 2 (B and D) with 8-week-old male (n = 6/group) pigs. In both experiments, pigs received daily supplementation of 750 mL milk or isocaloric amount of maltodextrin (as mimic for sugar-sweetened beverage).
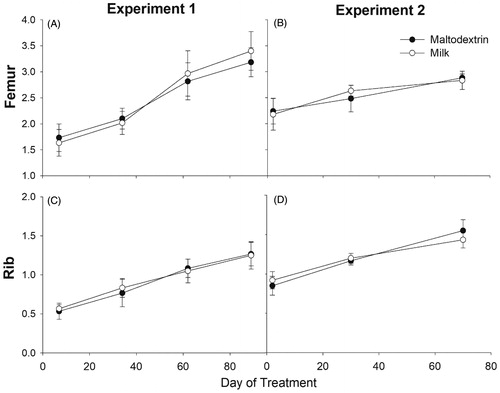
The lack of differences observed in bone growth between pigs receiving milk or maltodextrin is consistent to data generated from the NHANES 1999–2002 survey that revealed no effect of milk consumption on height of 5- to 11-year-old children. In contrast, milk consumption was a predictor of height and bone health in adolescent children aged 12–18 years (Wiley Citation2005). Similarly, Chevalley et al. (Citation2005) found that bone size and standing height did not differ in children with baseline calcium consumption of ∼750mg/d supplemented with milk-calcium enriched foods versus children receiving a placebo.
Comparison of male and female growth data was also performed (Experiment 1). Interestingly, the female pigs receiving milk realised an initial increase in growth compared to males, but overall growth was unaffected by treatment or sex (Supplementary Figure 4). These results are not surprising as skeletal sexual dimorphism usually does not present itself until the onset of puberty (Callewaert et al. Citation2010).
Dexa
We found no treatment effect on any measurement in Experiment 1 (Table ). However, sex differences were evident in Experiment 1 (Table ). Femur BMC was larger (22.4 ± 0.81 g vs. 18.37 ± 0.95 g, p = .025) in males compared to females, as was femur BMD (0.44 ± 0.01 g/cm2 vs 0.39 ± 0.01 g/cm2, p = .016) (Figure ). Further evaluation into specific regions of interest of the femur revealed that the proximal metaphyseal area, BMC and BMD as well as the diaphyseal area, BMC and BMD were significantly larger in males compared to females (Table ). Due to high activity levels, pre-pubertal children are at the highest risk for fracture among population sub-groups (Weaver et al. Citation2016). Post-menopausal women, however, are ranked second for fracture risk and first for osteoporotic fracture risk (Weaver et al. Citation2016). Menopause is associated with a natural reduction in oestrogen production, which leads to increased deterioration of bone mass and microarchitecture (Seeman Citation2013). Similar to pubertal growth results reported by Yilmaz et al. (Citation2005) in children, the data in the current study demonstrates that female pigs were predisposed to lower BMC and BMD before puberty. Interestingly, this difference was observed before pubertal onset and sexual maturation. Oestrogens and androgens are responsible for structural gender differences in bone mass and contribute to skeletal sexual dimorphism (Callewaert et al. Citation2010). However, our male pigs were castrated, and the female pigs had not begun to experience oestrous cycles, suggesting this skeletal difference could be due to a genomic difference between males and females in relation to bone formation, rather than an effect of increased concentration of circulating sex hormones.
Figure 2. Bone mineral content (BMC), bone mineral density (BMD) and area of right femur between male (n = 8) and female (n = 4) pigs in Experiment 1. Significance of the effect as p-value is indicated in the graph.
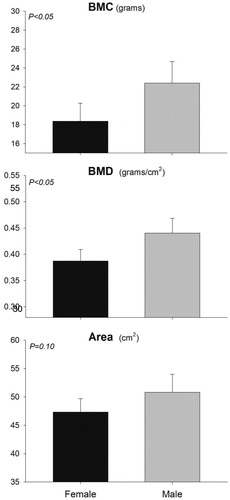
Table 1. Dual-energy X-ray absorptiometry data from bones and regions of interest of pigs (n = 6/group) receiving daily supplementation of 750 mL milk or isocaloric amount of maltodextrin (as mimic for sugar-sweetened beverage) for 13 weeks (Experiment 1).
Table 2. Dual-energy X-ray absorptiometry data for sex differences from bones and regions of interest of male (n = 8) and female (n = 4) pigs from Experiment 1.
We found no significant difference in the area, BMC, and BMD for the radius, femur, or humerus between the two treatment groups in male pigs in Experiment 2 (Table ). Unexpectedly, BMC and BMD of the mandible were significantly smaller (p < .05) in the group receiving milk when compared to the maltodextrin group. In order to understand the detected differences, we evaluated BMC and BMD on the three distinct regions of the mandible (body, ramus and teeth). The area, BMC and BMD of the ramus had no difference between the two groups. The area of the mandibular body had no difference although the BMD was lower (p < .05) and the BMC tended to be lower (p = .09) in the group receiving milk compared to maltodextrin solution. Conversely, the area and the BMC of the teeth tended to be higher in the group receiving milk (p = .08 and p = .09, respectively), but not the BMD (p = .79), suggesting the increased mineral content of the teeth was due to the increased area.
Table 3. Dual-energy X-ray absorptiometry data from bones and regions of interest in each bone of pigs supplemented daily with 750 mL of milk or isocaloric amount of maltodextrin for 11 weeks (Experiment 2. n = 6/group).
The difference in bone mineral density of the mandible between the two groups suggests that there was a difference in overall mandibular activity. Several studies have examined masticatory hypofunction and mandible bone mineral density. In 2011, Tsai and collaborators injected botulinum toxin into the temporalis and masseter muscles of 30-day-old Long-Evans rats and found decreased mandibular bone mineral density as a result of disuse (Tsai et al. Citation2011). Kunii et al. (Citation2008) also found that occlusal (contact between the upper and lower teeth during chewing or rest) hypofunction decreased total mandibular BMD of both trabecular and cortical bone, but was recovered when mandibular function was restored. When considering the results of our experiment, the above data suggest that the group receiving milk likely had lower mandibular activity compared to the control group. Interestingly, both groups of pigs received liquid supplements in addition to the grower diet, offering little insight into outward cause of the difference. To further evaluate this observation, the excised premolar was evaluated for wear patterns and occlusal surface thickness was measured. The enamel thickness of the occlusal surface was significantly thicker in the group receiving milk (Table ). In addition, visual inspection of the teeth revealed increased wear and flattened areas of the tooth in the group receiving the maltodextrin solution (Supplementary Figure 5). Milk is known to contain various bioactive peptides and one, α-casozepine, has anxiolytic effects similar to benzodiazepines (McDonnell et al. Citation2013; Landsberg et al. Citation2017). Besides α-casozepine, milk contains other anxiolytic compounds that can reduce stress and anxiety (Mika et al. Citation2018). Increased stress and anxiety can induce teeth-grinding (bruxism) that results in higher jaw activity (Cavallo et al. Citation2016). Based on the above evidence, it is possible that the low BMD of the mandible of pigs receiving milk was due to an anxiolytic effect of the milk, resulting in lower mandibular activity.
Three-point bending evaluation, cortical thickness, cortical area, cross-sectional area, medullary cavity area and femur properties
Femurs were preserved for biomechanical evaluation for Experiment 2 only. There were no significant differences in ultimate bending strength, experimental deformation, or overall bone stiffness between the two groups (Table ). Femur diameter, volume and length, along with final body weight, were also measured as these extrinsic properties affect bone strength and no significant differences were found between groups (Table ). There were no significant correlations of ultimate bending strength with final body weight, femur diameter, volume, area, BMC, or BMD. Experimental deformation at fracture was negatively correlated with femur diameter (r2= −0.75), area (r2= −0.69) and BMC (r2= −0.62) and had tendencies to be negatively correlated with femur length (r2= −0.56). In contrast, final body weight was positively correlated with femur length in Experiment 1 (r2= 0.77), while final body weight was positively correlated with femur length (r2= 0.58), area (r2= 0.58) and BMC (r2= 0.60) in Experiment 2 (Supplementary Table 1).
Table 4. Right femur characteristics and final body weight for pigs in Experiment 1 [5-week-old male (n = 4/group) and female (n = 2/group)] and Experiment 2 [8-week-old male (n = 6/group)] receiving daily 750 mL of milk or isocaloric amount of maltodextrin as mimic of sugar-sweetened beverage.
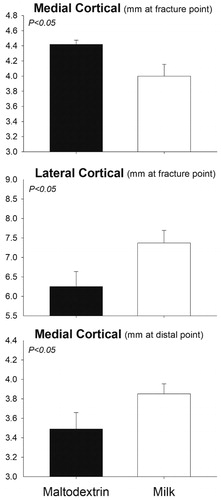
No significant treatment differences in any of the measurements (average cortical thickness, cross-sectional area, cortical area and medullary cavity area) were detected in Experiment 1 (Table ). Comparing the two sexes, the ventral cortical thickness of the proximal femur was significantly larger in males (4.91 ± 0.06 mm) vs. females (4.10 ± 0.11 mm, p < .05) while the medullary cavity area tended to be larger in females (179.54 ± 7.48 mm) vs. males (142.96 ± 2.53 mm, p < .10). In Experiment 2, the medial cortical thickness of the femur at the fracture point was smaller in milk compared to the control group (p = .03) while the lateral thickness at the fracture point was larger in the group receiving milk (p = .05). The medial cortical thickness of the distal femur tended to be larger in the group receiving milk (p = .10) (Figure ). There were no differences in medullary cavity area, cross-sectional area, or cortical area between the two groups (Table ).
Figure 3. Differences in cortical thickness measurements for pigs receiving daily supplementation of 750 mL milk or isocaloric amount of maltodextrin (as mimic for sugar-sweetened beverage) for 11 weeks (Experiment 2, n = 6/group). Significance of the effect as p-value is indicated in the graph.
To our knowledge, this is the first study to evaluate the direct effect of whole and unfortified milk consumption on physical bone strength in pre-pubertal pigs. Bone strength is determined by various properties such as bone geometry, microarchitecture and tissue-level properties (Fonseca et al. Citation2014). Though we found no differences in mechanical strength or bone level properties between groups, an interesting observation was the greater area of the medullary cavity of the female pigs in Experiment 1. After menopause, females lose the bone-protective effect of oestrogen and lose bone more rapidly than men (Cheung et al. Citation2016). Specifically, women experience an imbalance in bone turnover characterised by endosteal erosion, cortical thinning and medullary cavity expansion which increases risk of fracture (Cheung et al. Citation2016). While we found no significant difference in average cortical thickness between treatments, males on average had thicker cortices than females (4.94 ± 0.11 mm vs. 4.60 ± 0.23 mm; p =.05).
We found no significant correlations between femoral BMD and strength which contradicts work by Nielsen et al. (Citation2007) who found that BMD and biomechanical strength in pigs were closely related. However, it was not surprising that bone strength was not significantly different between groups as BMC, BMD and other femoral properties were not different. In our study, negative correlations of experimental deformation with femur diameter, area, BMC and length suggest that the linear growth experienced during childhood and adolescence may increase risk of fracture from a fall or physical activity as the capability of bone to resist fracture by deforming is reduced (Weaver et al. Citation2016). The differences in cortical thickness measurements of the medial and lateral femur between treatment groups await an explanation. Final body weight was positively associated with length and mineral content of the femur. These data are in line with Wolff’s law and theorised by the mechanostat hypothesis, which states that increases in weight and force applied to bone can increase and adjust bone structure to adapt to the increase in mechanical loads (Iwaniec and Turner Citation2016). While it is beyond the scope of our study, these data suggest that increases in mechanical forces, such as those experienced through physical activity, have a positive effect on bone mineral accrual and development.
Enamel thickness
The fourth premolar was only harvested for animals in Experiment 2. There were no differences in enamel thickness between the two treatment groups (1.15 ± 0.05 mm vs 1.16 ± 0.05; p = .97).
Soft drinks have become the beverage of choice for most children (Tahmassebi et al. Citation2006). Although we did not find any short-term effect of SSB consumption, enamel erosion from SSB could have detrimental effects on children’s teeth with long-term consumption (Barac et al. Citation2015).
Calcium and maltodextrin intake
The amount of estimated Ca was statistical larger in pigs receiving milk vs. the pigs receiving maltodextrin in Experiment 1 (10.5 vs. 9.0 g/day; SEM = 0.08; p <.0001) or Experiment 2 (13.2 vs. 13.7 g/day; SEM = 0.13; p = .005). The pigs were provided an ad libitum grower ration containing 0.5% calcium and both groups achieved their National Research Council (NRC) recommended calcium requirements prior to any supplementation (National Research Council Citation2012). The feed intake of the two groups was not statistically different between groups in both experiments (Swanson et al. Citation2019). Ca from milk accounted only approx. 5.6% of the total Ca provided daily (0.8 g out of 13.7 g). It is likely that the relatively modest increase of Ca intake in milk-fed pigs was not sufficient to induce larger bone formation likely because the amount of Ca from the diet was already sufficient. In addition, the bioactive features of milk appear to have no effect on bone metabolism when supplemented short-term. Children who avoid dairy products or have low baseline calcium intakes may have compromised skeletal health (Pereira Citation2014; Mailhot et al. Citation2016). Milk supplementation and increased calcium intake have proven to increase bone mineral density and overall skeletal health when baseline calcium is below the daily recommended intake (DRI) (Viguet-Carrin et al. Citation2014; Heuvel and Steijns Citation2018). However, as seen in the current study, milk supplementation when calcium intake is already adequate provides no further benefit. Our data are in agreement with Gibbons et al. (Citation2004). Overall, when dietary calcium levels meet the DRI, milk supplementation has no effect on bone metabolism. In contrast, SSB have reported negative effects on skeletal development (Tsanzi et al. Citation2008). Cola consumption has been associated with decreased hip BMD and increased fracture risk, decreased serum calcium levels, and higher calcium excretion – all potential factors for developing osteoporosis (Tucker et al. Citation2006). No negative effects on bone development were seen in our experiment, suggesting no short-term effects of maltodextrin on skeletal growth and development.
Results from the combination of the two experiments
Statistical results of the combination of the same data (males only) from Experiment 1 and Experiment 2 can be found in Supplementary Table 2. Despite the increased number of animals, there were no differences when comparing the two treatment groups (except for lateral cortical thickness). When the data were compared between the two experiments, we observed several significant differences, with almost all the bone being larger in animals in Experiment 2 vs. Experiment 1. This was not surprising as the pigs in Experiment 2 were older, heavier and bigger when the trial was completed.
Limitations
Our study was not without limitations. As these were short-term experiments, it is difficult to make long-term inferences regarding the effects of milk supplementation on bone growth as pigs reach skeletal maturity around 25 months of age. In Experiment 1, only the femur and tibia/fibula were collected whereas in Experiment 2, the femur, humerus, radius and mandible were collected. This limits our ex vivo comparison between studies to only the femur and its characteristics. Likewise, our growth data are limited as only two female pigs were present in each group for experiment 1. Additionally, the current experiment may have missed the critical window of opportunity for evaluating the effect of milk on bone growth; specifically, when there is a peak in bone mass and mineral accrual during the growth spurt of puberty. In the present work we did not assess the microarchitecture of the trabecular bone using microcomputer tomography. This would have provided a better understanding of the long-term effect of milk on fracture resistance, since trabecular bone can be affected by milk in adolescents (Movassagh et al. Citation2017). Another limitation of our study was the lack of measurement of any bone remodelling using, for instance, expression of genes related to bone turnover. Furthermore, long term effect on bone may be seen on mesenchymal and periosteal stem cells, as these cell lineages are responsible for bone formation.
Conclusions
Short-term milk supplementation does not affect bone growth, development, or strength in pre-pubertal growing pigs compared to SSB supplementation. Milk may exert an indirect effect on bone formation by affecting behaviour through the anxiolytic properties of casein-derived bioactive peptides. Adequate dietary calcium could have overridden any effect of milk on the skeleton in the short-term. Further research regarding milk’s effect on pubertal bone mineral accrual, pre-pubertal hormone profiles, longer experimental trials, evaluation of bone turnover, and assessment of the status of stem cells responsible for bone formation is needed to further understand the direct effect of milk on bone health. In addition, more research into the bioactive elements of milk fat and milk protein could provide insight into milk’s role in skeletal development beyond its mineral profile.
Author contributions
Study design: BB, MK and MB. Study conduct: BB, MK and MB. Data analysis: BB, SC and MB. Drafting manuscript: BB. Revising manuscript: BB, MK, RT and MB. Approving final version of manuscript: BB, MK, SC, RT and MB.
| Abbreviations | ||
| BMC | = | bone mineral content |
| BMD | = | bone mineral density |
| DEXA | = | dual energy x-ray absorptiometry |
| DRI | = | daily recommended intake |
| PBM | = | peak bone mass |
| SPI | = | swiss precision instruments |
| SSB | = | sugar-sweetened beverages |
Supplemental Material
Download MS Word (1.5 MB)Acknowledgments
The authors thank Oregon State University for providing the housing, feeding and husbandry equipment for their project. The authors thank Matthew Kennedy and his students for overseeing animal welfare, procuring the pigs and cleaning the pens. The authors thank Sarah Akers, Cassie Penix, Emily Sahagun, Randi Wilson, Tamay Guevara, Minda Newhouse, Katie White, Eric Tam, Catalina Tello, Enrique Perez, Kaitlyn Vander Pas, Nina Enos, Katherine Swanson, Emili Peterson, Nicolas Rivero, Winnie Luo and Sebastiano Busato who assisted in feeding, recording weight data and collecting samples.
Disclosure statement
All authors have no conflicts of interest.
References
- Barac R, Gasic J, Trutic N, Sunaric S, Popovic J, Djekic P, Radenkovic G, Mitic A. 2015. Erosive effect of different soft drinks on enamel surface in vitro: application of stylus profilometry. Med Princ Pract. 24:451–457.
- Bleich SN, Vercammen KA, Koma JW, Li Z. 2018. Trends in beverage consumption among children and adults, 2003–2014. Obesity. 26:432–441.
- Callewaert F, Sinnesael M, Gielen E, Boonen S, Vanderschueren D. 2010. Skeletal sexual dimorphism: relative contribution of sex steroids, GH-IGF1, and mechanical loading. J Endocrinol. 207:127–134.
- Caroli A, Poli A, Ricotta D, Banfi G, Cocchi D. 2011. Invited review: dairy intake and bone health: a viewpoint from the state of the art1. J Dairy Sci. 94:5249–5262.
- Cavallo P, Carpinelli L, Savarese G. 2016. Perceived stress and bruxism in university students. BMC Res Notes. 9:514..
- Cheung AM, Frame H, Ho M, Mackinnon ES, Brown JP. 2016. Bone strength and management of postmenopausal fracture risk with antiresorptive therapies: considerations for women’s health practice. Int J Womens Health. 8:537–547.
- Chevalley T, Bonjour J-P, Ferrari S, Hans D, Rizzoli R. 2005. Skeletal site selectivity in the effects of calcium supplementation on areal bone mineral density gain: a randomized, double-blind, placebo-controlled trial in prepubertal boys. J Clin Endocrinol Metab. 90:3342–3349.
- Fonseca H, Moreira-Gonçalves D, Coriolano HJA, Duarte JA. 2014. Bone quality: the determinants of bone strength and fragility. Sports Med. 44:37–53.
- Gibbons MJ, Gilchrist NL, Frampton C, Maguire P, Reilly PH, March RL, Wall CR. 2004. The effects of a high calcium dairy food on bone health in pre-pubertal children in New Zealand. Asia Pac J Clin Nutr. 13:341–347.
- Han E, Powell LM. 2013. Consumption patterns of sugar-sweetened beverages in the United States. J Acad Nutr Diet. 113:43–53.
- Händel MN, Heitmann BL, Abrahamsen B. 2015. Nutrient and food intakes in early life and risk of childhood fractures: a systematic review and meta-analysis. Am J Clin Nutr. 102:1182–1195.
- Heuvel E. v d, Steijns JMJM. 2018. Dairy products and bone health: how strong is the scientific evidence? Nutr Res Rev. 31:164–178.
- Iwaniec UT, Turner RT. 2016. Influence of body weight on bone mass, architecture and turnover. J Endocrinol. 230:R115–R130.
- Jilka RL. 2013. The relevance of mouse models for investigating age-related bone loss in humans. J Gerontol A Biol Sci Med Sci. 68:1209–1217.
- Kelly PM, Diméglio A. 2008. Lower-limb growth: how predictable are predictions? J Child Orthop. 2:407–415.
- Kunii R, Yamaguchi M, Aoki Y, Watanabe A, Kasai K. 2008. Effects of experimental occlusal hypofunction, and its recovery, on mandibular bone mineral density in rats. Eur J Orthod. 30:52–56.
- Landsberg G, Milgram B, Mougeot I, Kelly S, de Rivera C. 2017. Therapeutic effects of an alpha-casozepine and L-tryptophan supplemented diet on fear and anxiety in the cat. J Feline Med Surg. 19:594–602.
- Libuda L, Alexy U, Remer T, Stehle P, Schoenau E, Kersting M. 2008. Association between long-term consumption of soft drinks and variables of bone modeling and remodeling in a sample of healthy German children and adolescents. Am J Clin Nutr. 88:1670–1677.
- Lüthje FL, Skovgaard K, Jensen HE, Kruse Jensen L. 2018. Pigs are useful for the molecular study of bone inflammation and regeneration in humans. Lab Anim. 52:630–640.
- Mailhot G, Perrone V, Alos N, Dubois J, Delvin E, Paradis L, Roches AD. 2016. Cow’s milk allergy and bone mineral density in prepubertal children. Pediatrics. 137:e20151742.
- McDonnell SM, Miller J, Vaala W. 2013. Calming benefit of short-term alpha-casozepine supplementation during acclimation to domestic environment and basic ground training of adult semi-feral ponies. J Equine Vet Sci. 33:101–106.
- Mika A, Gaffney M, Roller R, Hills A, Bouchet CA, Hulen KA, Thompson RS, Chichlowski M, Berg BM, Fleshner M. 2018. Feeding the developing brain: Juvenile rats fed diet rich in prebiotics and bioactive milk fractions exhibit reduced anxiety-related behavior and modified gene expression in emotion circuits. Neurosci Lett. 677:103–109.
- Movassagh EZ, Kontulainen S, Baxter-Jones ADG, Whiting S, Szafron M, Papadimitropoulos M, Vatanparast H. 2017. Are milk and alternatives and fruit and vegetable intakes during adolescence associated with cortical and trabecular bone structure, density, and strength in adulthood? Osteoporos Int. 28:609–619.
- Nanes MS, Kallen CB. 2014. Osteoporosis. Semin Nucl Med. 44:439–450.
- National Research Council 2012. Nutrient requirements of swine. 11th revised ed. Washington (DC): The National Academies Press.
- Nielsen DH, McEvoy FJ, Madsen MT, Jensen JB, Svalastoga E. 2007. Relationship between bone strength and dual-energy X-ray absorptiometry measurements in pigs. J Anim Sci. 85:667–672.
- Pereira PC. 2014. Milk nutritional composition and its role in human health. Nutrition. 30:619–627.
- Perlman RL. 2016. Mouse models of human disease: an evolutionary perspective. Evol Med Public Health. 2016:170–176.
- Powell LM, Maciejewski ML. 2018. Taxes and sugar-sweetened beverages. JAMA. 319:229–230.
- Rauch F, Bailey DA, Baxter-Jones A, Mirwald R, Faulkner R. 2004. The ‘muscle-bone unit’ during the pubertal growth spurt. Bone. 34:771–775.
- Rizzoli R, Bianchi ML, Garabédian M, McKay HA, Moreno LA. 2010. Maximizing bone mineral mass gain during growth for the prevention of fractures in the adolescents and the elderly. Bone. 46:294–305.
- Rizzoli R. 2014a. Nutritional aspects of bone health. Best Pract Res Clin Endocrinol Metab. 28:795–808.
- Rizzoli R. 2014b. Dairy products, yogurts, and bone health. Am J Clin Nutr. 99:1256S–1262S.
- Seeman E. 2013. Age- and menopause-related bone loss compromise cortical and trabecular microstructure. J Gerontol A Biol Sci Med Sci. 68:1218–1225.
- Sözen T, Özışık L, Başaran NÇ. 2017. An overview and management of osteoporosis. Eur J Rheumatol. 4:46–56.
- Stagi S, Cavalli L, Iurato C, Seminara S, Brandi ML, de Martino M. 2013. Bone metabolism in children and adolescents: main characteristics of the determinants of peak bone mass. Clin Cases Miner Bone Metab. 10:172–179.
- Swanson K, Kutzler M, Bionaz M. 2019. Mar 21. Cow milk does not affect adiposity in growing piglets as a model for children. J Dairy Sci. 102:4798–4807.
- Tahmassebi JF, Duggal MS, Malik-Kotru G, Curzon MEJ. 2006. Soft drinks and dental health: a review of the current literature. J Dent. 34:2–11.
- Terada M, Inaba M, Yano Y, Hasuma T, Nishizawa Y, Morii H, Otani S. 1998. Growth-inhibitory effect of a high glucose concentration on osteoblast-like cells. Bone. 22:17–23.
- Tian L, Yu X. 2017. Fat, sugar, and bone health: a complex relationship. Nutrients. 9:506.
- Tsai CY, Shyr YM, Chiu WC, Lee CM. 2011. Bone changes in the mandible following botulinum neurotoxin injections. Eur J Orthod. 33:132–138.
- Tsanzi E, Light HR, Tou JC. 2008. The effect of feeding different sugar-sweetened beverages to growing female Sprague-Dawley rats on bone mass and strength. Bone. 42:960–968.
- Tucker KL, Morita K, Qiao N, Hannan MT, Cupples LA, Kiel DP. 2006. Colas, but not other carbonated beverages, are associated with low bone mineral density in older women: The Framingham Osteoporosis Study. Am J Clin Nutr. 84:936–942.
- USDA ERS. Dairy Data. 2018 [accessed Mar 14]. https://www.ers.usda.gov/data-products/dairy-data/
- Vesper EO, Hammond MA, Allen MR, Wallace JM. 2017. Even with rehydration, preservation in ethanol influences the mechanical properties of bone and how bone responds to experimental manipulation. Bone. 97:49–53.
- Viguet-Carrin S, Hoppler M, Membrez Scalfo F, Vuichoud J, Vigo M, Offord EA, Ammann P. 2014. Peak bone strength is influenced by calcium intake in growing rats. Bone. 68:85–91.
- Viljakainen HT. 2016. Factors influencing bone mass accrual: focus on nutritional aspects. Proc Nutr Soc. 75:415–419.
- Weaver CM, Gordon CM, Janz KF, Kalkwarf HJ, Lappe JM, Lewis R, O'Karma M, Wallace TC, Zemel BS. 2016. The National Osteoporosis Foundation’s position statement on peak bone mass development and lifestyle factors: a systematic review and implementation recommendations. Osteoporos Int. 27:1281–1386.
- Whiting SJ, Healey A, Psiuk S, Mirwald R, Kowalski K, Bailey DA. 2001. Relationship between carbonated and other low nutrient dense beverages and bone mineral content of adolescents. Nutr Res. 21:1107–1115.
- Wiley AS. 2005. Does milk make children grow? relationships between milk consumption and height in NHANES 1999-2002. Am J Hum Biol. 17:425–441.
- Yilmaz D, Ersoy B, Bilgin E, Gümüşer G, Onur E, Pinar ED. 2005. Bone mineral density in girls and boys at different pubertal stages: relation with gonadal steroids, bone formation markers, and growth parameters. J Bone Miner Metab. 23:476–482.