
 ?Mathematical formulae have been encoded as MathML and are displayed in this HTML version using MathJax in order to improve their display. Uncheck the box to turn MathJax off. This feature requires Javascript. Click on a formula to zoom.
Abstract
Limited water intake affects livestock. Though small ruminants are more resilient to suboptimum water intake compared to other species of livestock, tolerance abilities differ among breeds. This study was aimed at investigating the effect of water deprivation levels on intake, growth performance and nutritional status of Nguni goats. Thirty-six Nguni goats (initial weight, 18 ± 3.2 kg) were assigned to one of three treatments: without water deprivation, water deprivation for 24 and 48 h in a completely randomised design for 40 days. Performance traits, body condition score (BCS), faecal egg count (FEC) and FAffa MAlan CHArt (FAMACHA) were determined weekly while blood metabolites were determined on the last day of the experiment and analysed with PROC GLM of SAS software. The average daily water intake (WI) and feed intake (FI) increased (p < .05) with increased period of water deprivation. The average daily gain (ADG) and feed conversion ratio (FCR) declined (p < .01) with increased period of water deprivation. Final body weight, BCS and FAMACHA decreased (p < .05) while faecal egg count, glucose and creatine increased (p < .05) with increased period of water deprivation. Water deprivation period had negative correlations with ADFI, WFR, ADG, FCR, FAMACHA, BCS and BW. The correlation of BW was negative with FEC and positive with serum glucose. It was concluded that water deprivation impacts negatively on the nutritional status, blood metabolites and growth performance of Nguni goats.
Limited water intake in small ruminants decreases body weight and body condition score.
Rehydration, after prolonged dehydration of 48 h in small ruminants, results in increased average daily water and feed intake.
Under dehydration effect, bodyweight positively correlates with body condition scores and negatively correlates with faecal egg count.
Highlights
Introduction
The socio-economic importance and preference for small ruminants especially goats by resource-limited, smallholder farmers cannot be over-emphasised. This is because goats are imbued with good attributes such as fast growth rate, low production cost, short generation intervals, efficient utilisation of crop residues, adaptability to a harsh environment and the good nutritional profile and acceptability of the meat irrespective of religion and cultural divides (Webb Citation2014). However, their sustainability alongside other species of livestock is currently under threat due to increasing drought and water scarcity (Akinmoladun et al. Citation2019). The severity of water stress and vulnerability to seasonal drought is further heightened in arid and dry zones of the world. According to the projections illustrated by Gosain et al. (Citation2006), more than thirty countries will experience water stress by the year 2025 as against seven countries in the year 1995. This gradual spread of water stress, going by the projection, could consume about two-thirds of the world population by the year 2050 due to a continuous rise in the human population, irreversible change in climate, industrialisation and increasing water use.
Water is required by the body for several physiological processes such as heat balance, temperature regulation, efficient digestion and absorption of food, and solvents for body fluids. Therefore, a suboptimum intake can be critically limiting in terms of performance and productivity of livestock (Alamer Citation2010). Small ruminants are highly revered for their efficient water use abilities and resilience to limited water intake compared to other species of livestock (Akinmoladun et al. Citation2019). This is attributed to minimal water requirement resulting from their small body size and also the ability to conserve water in their rumen (reservoir) for later use during shortfalls (Shkolnik et al. Citation1980; Silanikove Citation2000). However, the degree of water use abilities and tolerance to reduced intake rest hugely on breed, animal type, the extent of adaptability and the length and nature of deprivation (Akinmoladun et al. Citation2020a). Although there is an enhanced adaptation with prolonged exposure, huge differences in response by different breeds exist and have been documented (Habibu et al. Citation2017). The bodyweight of Awassi and Najdi sheep decreased by 13.30% and 15.00% respectively when exposed to similar water deprivation conditions (Alamer and Al-hozab Citation2004). Also, the Barmer and black Bedouin goats can survive on once in 4 days watering as well as desert goats, managed under the open grazing system and with a watering regimen of once in 3–6 days (Silanikove Citation1994). Under a 3-day water deprivation, the Egyptian Baladi goat was still able to maintain about 35% of the control feed intake (Hassan Citation1989), while a 2-day water deprivation in Aardi goats made them stop eating completely (El-Nouty et al. Citation1990). Therefore, breeds that can adapt to changing climatic condition, including resilience to limited water intake, without seriously compromising production indices are currently advocated as a key research need and focus for sustainability (Akinmoladun et al. Citation2019).
The Nguni goat is one of the local breeds among the South African rural communities. Giving the prevailing water scarce nature of the country (Donnenfeld et al. Citation2018), the extent of adaptability of this local breed to water stress is yet to be fully elucidated. Therefore, this research is focussed on the effect of water deprivation on intake, growth performance and some selected blood metabolites of Nguni goats.
Materials and methods
Study site and ethical consideration
The study was carried out at Ukulinga Research farm in Pietermaritzburg, South Africa. The elevation of the farm was about 775 m above sea level and with geographical coordinates 29°40′ S and 30°24′ E. The daily average temperature and mean annual rainfall were 29 °C and 735 mm, respectively (Bengaly et al. Citation2007).
Goat management, diets and design
Thirty-six Nguni goats with an initial mean body weight of 18 ± 3.2 kg were dewormed with 2 mL of Zolvix Monepantel® (Novartis Animal Health, Australia) and put in individual pens. The experiment lasted for 40 days, aside from the 7-day adaptation period. The goats were allocated to one of three treatments: without water deprivation (ad libitum water intake), water deprivation for 24 (followed by water supply for 24 h) and 48 h (followed by water supply for 24 h) as shown in Table . Goats were fed chopped Medicago sativa hay ad libitum. The composition of the hay is shown in Table . Water was offered ad libitum using 10-litre buckets.
Table 1. Water supply and deprivation periods during the experiment for Nguni goats.
Table 2. Chemical composition of Medicago sativa hay (as-fed basis).
Measurements
Water and feed intake
Average daily water intake (ADWI) of goats subjected to 0 h water deprivation was determined weekly [(water offered − water refused)/7 days] while those subjected to 24 and 48 h of water deprivation were determined using the formula [(water offered − water refused)/collection days] for the four weeks. Water intake was determined daily at 0800 h in the morning. Losses due to evaporation were accounted for by placing two buckets filled with water at strategic positions within the pen so that evaporation losses can be deducted from water intake. Feed intake (FI) was determined by weighing the amount of feed refused and subtracting the same from the weight of feed offered. Average daily feed intake (ADFI) was calculated by dividing FI by 7 days.
Bodyweight, body condition scores (BCS), water to feed ratio and average daily gain
The bodyweight of the goats was carried out weekly with the aid of an electronic weighing system with a precision of 0.05. The average daily gain (ADG) was calculated by finding the difference in weight of does at the beginning and end of each week divided by 7. The proportion of daily water consumed to the amount of feed ingested (water to feed ratio) was also calculated during the experimental trial. To determine the feed conversion ratio (FCR), the amount of feed consumed was divided by body weight gain. Body condition scoring (BCS) was determined by palpating the spinous processes of the lumbar vertebrae using a scale of 1 (emaciated), 2 (thin), 3 (average condition), 4 (fat) and 5 (obese) once a week, over 4 weeks as described by Gerhart et al. (Citation1996).
FAMACHA score and faecal egg count
To determine the FAffa MAlan CHArt (FAMACHA) scores, the lower eyelid of the goats was gently opened and the colour of the conjunctivae assessed. This was compared with five different chart colours and score numbers, ranging from 1 (non-anaemic) to 5 (severely anaemic) (Kaplan et al. Citation2004), assigned accordingly. The McMaster technique was used in determining the faecal egg counts (Rumosa-Gwaze et al. Citation2010). Briefly, 56 mL of a saturated solution of sodium chloride was prepared, and 4 g of faeces was added and mixed. The number of nematode eggs per gram of faeces was estimated by multiplying the total number of eggs counted in the two squares of the McMaster slide by the dilution factor of 50. The McMaster technique detects 50 or more eggs per gram of faeces.
Blood collection and analysis
On the last day of the experiment, blood samples were collected via jugular venipuncture into Li-heparinised tubes (Terumo Europe NV Leuven, Belgium). The tubes were ice-packed and transferred immediately to the laboratory. The plasma was separated, using a centrifuge machine (3000×g) for 10 minutes, and stored at −20 °C pending analysis. Blood samples were analysed for glucose (glucose oxidase method, Reagents Applications Inc., San Diego, California), urea (Berthelot method, Reagents Applications Inc., San Diego, California), cholesterol (cholesterol esterase method) and creatine kinase using a commercially available kit.
Statistical analysis
Data obtained were subjected for analysis using the PROC GLM of SAS (Citation2010). The number of weeks for body condition scoring, live weight, faecal egg counts and FAMACHA was used as covariates. However, the week effect was not used as a covariate for blood metabolites since they were collected on the last day. The differences between least square means were tested using the PDIFF option of (2010). Body condition scores and FAMACHA scores were root transformed whilst faecal egg counts were transformed using log10 (FEC + 1) to normalise the data. The linear model used was described as follows:
where Yijk = response variable for each goat; μ = overall mean; Di = water deprivation (i = 0, 24 and 48 h); and Wj = week of successive feeding (j = week 1, 2, 3 and 4).
A Pearson’s correlation test was run to cater for the relationships that exist amongst water and feed intake, including growth performance parameters together with water deprivation. The interaction of water deprivation and week of successive feeding was not significant across all parameters tested; therefore, it was removed from the model. PROC CORR of SAS (Citation2010) was used to test for relationships that exist amongst body condition scoring, body weight, faecal egg counts, FAMACHA and blood metabolites tested.
Result
Water and feed intake
The influence of water deprivation × week of successive feeding interaction on ADWI, ADFI and WFR is shown in Table . In general, the ADWI and ADFI increased (p < .05) with an increase in the period of water deprivation. In week 3 of the feeding period, the ADWI decreased (p < .05) with an increase in water deprivation periods. Unlike week 1, the WFR increased with an increased period of water deprivation for week 2 of the feeding period.
Table 3. Least square means for average daily water intake and average daily feed intake from Nguni goats subjected to varying periods of water deprivation over a four-week period of successive feeding.
Growth performance and correlation among growth parameters
The effects of water deprivation on average daily gain and feed conversion ratio are illustrated in Figure . Both average daily gain and feed conversion ratio decreased continuously as the level of water deprivation increased. Water deprivation period had weak negative correlations amongst all parameters tested, where ADFI and WFR were weakly correlated, and ADG and FCR revealed moderate correlations. The relationship between water deprivation and ADWI was not significant (p > .05; Table ).
Figure 1. Effect of water deprivation period on average daily gain and feed conversion ratio from Nguni goats; water deprivation label: 0 = 0 h; 1 = 24 h; 2 = 48 h. BW: body weight.
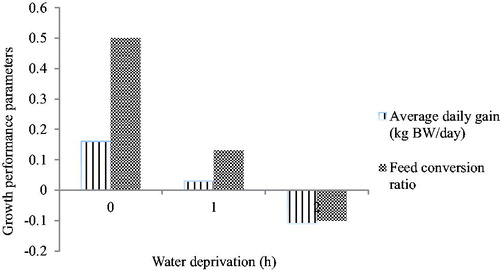
Table 4. Pearson’s correlation coefficients among growth performance parameters from Nguni goats.
BW, BCS, faecal egg counts, FAMACHA and selected blood metabolites
The effect of water deprivation periods on BW, BCS, FEC and selected blood metabolites is shown in Table . The BW and BCS decreased (p < .05) with increased period of water deprivation. The FAMACHA scores recorded for goats deprived of water for 0 and 24 h were higher compared to those deprived of water for 48 h (p < .05). The serum glucose, creatinine and cholesterol increased (p < .05) with increased period of water deprivation. Serum urea was not significantly affected (p > .05) by levels of water deprivation
Table 5. Least square means for body condition scoring, body weight, faecal egg counts, FAMACHA scores and selected blood metabolites of Nguni goats subjected to varying periods of water deprivation.
Correlations between body weight and nutritional indices
The correlation coefficients among body condition scoring, body weight, faecal egg counts, FAMACHA and blood metabolites for Nguni goats subjected to water deprivation are shown in Table . Correlations for water deprivation period were negatively correlated for FAMACHA, positive for faecal egg counts and creatine kinase, negative for body condition scoring and also for body weight. Body condition scoring had a positive correlation with body weight. Correlations for body weight were negative with faecal egg counts and positive with serum glucose. Faecal egg counts had negative correlations with serum glucose.
Table 6. Pearson’s correlation coefficients among water deprivation period, BCS, body weight, faecal egg counts, FAMACHA and selected blood metabolites.
Discussion
The observed higher increase in the amount of water consumed in the group deprived of water for 48 h compared to other groups (24 h and 0 h) was expected. Body water and body weight are cojoined, and adapted breeds are adjudged based on their tolerance to water stress. Small ruminants adapt to severe water scarcity by recouping as much water as possible in the rumen during rehydration to counteract weight loss induced by water deprivation (Akinmoladun et al. Citation2019). With an increased length of water deprivation, excessive thirst is induced leading to increased consumption of water during rehydration (Hogan et al. Citation2007). In a similar study, Ethiopian Somali goats watered every second, third and fourth day, drank 1.34, 2.01 and 2.51 times as much water as the ad-lib group, respectively (Mengistu et al. Citation2007). An increased amount of ingested water during rehydration has also been reported in water-deprived Bedouin goats (Choshniak et al. Citation1984). Also, water and feed intake are positively correlated. This is because, effective digesta passage in the tract, efficient digestion and absorption of food require a water medium (Muna and Ammar Citation2001; Kaliber et al. Citation2015). The observed improvement in average daily feed intake in the 48 h-water-deprived groups compared to 24 h and 0 h groups could be attributed to a much higher average daily water intake. Previous studies have shown that goats subjected to water deprivation consume feed in comparable amounts, such that variations in feed intake can be observed with increased water deprivation and rehydration (Alamer Citation2006). Despite the much-increased feed and water intake, the average daily gain and feed conversion ratio were the lowest in the 48-h water-deprived group. This might probably be as a result of reduced nutrient intake due to the inconsistencies in water resources that limit fermentation and digestive process. Studies have shown that increased water intake during rehydration induced by an extended period of water deprivation creates an imbalance (sudden drop) in rumen osmolality resulting in a huge osmotic gradient between the systemic fluid and rumen (Silanikove Citation2000). This high extracellular rumen volume may not favour efficient digestion and absorption of feed.
Water deprivations usually result in body weight fall. The progressive decrease in body weight to length of deprivation in this study can be attributed to reduced nutrient and water intake as well as body water loss. In a similar study, the body weights of Saudi Arabia goats were reduced by 21% when deprived of water for 3 days (Alamer Citation2006). A similar decrease in body weight was observed in a 75-d water-restriction study in Xhosa goats (Akinmoladun et al. Citation2020b). Giving the correlation between body weight and body condition (Rumosa-Gwaze et al. Citation2010), the decreased body condition with increasing period of water deprivation in this study was expected. Efficient utilisation of feed resources requires optimal water consumption, and its limitation could result in body condition loss in goats (Alamer Citation2009). Also, energy production is compromised during water stress, and attempts to maintain energy needs normally result in fat mobilisation from adipose tissues (Jaber et al. Citation2013). In a similar study, Akinmoladun et al. (Citation2020b) reported an increasing loss of body condition in Xhosa goats' water restricted by 70% and 50% of ad libitum intake for 75 days. This decline in body condition scoring and body weight in the current study proved the negative correlation that exists between water deprivation period together with body condition scoring and body weight.
The FAMACHA technique, as well as the faecal egg counts, helps to provide a measure of small ruminant’s resistance to parasite infestations such as the Haemonchus contortus (Kaplan et al. Citation2004; Rumosa-Gwaze et al. Citation2010). According to van Wyk and Bath (Citation2002), FAMACHA scores of 3, 4 and 5 in goats are suggestive of anaemia, requiring selective treatment. In this study, the FAMACHA scores recorded were ˂3 among the experimental goats. This indicates that the entire experimental goats were not anaemic (minimal nematode or gastrointestinal infestation) nor affected by water deprivation. However, the findings from the current study indicate that FAMACHA scores declined while faecal egg counts increased with increased periods of water deprivation. This could be attributed to the water deprivation regimen adopted. A similar response was reported in a 75-d water restriction study on Xhosa goats (Akinmoladun et al. Citation2020b). Besides, the correlations from the current study indicate that an increase in water deprivation periods results in low body condition scores and large faecal egg counts. Pearson’s correlations explained a decline in body condition score, body weight and FAMACHA score as the water deprivation period was increased, whereas increased periods of water deprivation explained an increase in faecal egg counts.
Through the kidney, the liver eliminates urea as well as ammonium ions produced from amino acid metabolism, rumen microbiota and intestinal flora. The similarity in the urea concentrations among the treatment groups indicated that the kidney functions were not compromised. Usually, prolonged dehydration, as well as increased concentrations of blood metabolites, may compromise the functional integrity of the kidney. The need to effectively utilise the limited water within the animal's body normally results in increased water reabsorption; consequently, urea is increasingly reabsorbed (nephron level) giving its high permeability (Hamadeh et al. Citation2006). Other water restriction studies in goats (Alamer Citation2006; Abdelatif et al. Citation2010) and sheep (Jaber et al. Citation2004; Casamassima et al. Citation2016) reported increased urea concentrations. The increased levels of creatinine relative to an increase in the period of water deprivation may be attributed to a slow glomerular filtration due to water stress burden on the kidney. In similar experiments, the plasma creatinine concentrations were also reported to increase with the length of water deprivation (Abdelatif et al. Citation2010; Kaliber et al. Citation2015). However, no changes were observed in Poll Dorset x Merino lambs deprived of water for 2 days (Jacob et al. Citation2006). In the present study, the plasma cholesterol increases with length of water deprivation and was highest in the 48-h water-deprived group. The decreased energy intake during water deprivation and/or restriction requires that fat be mobilised from adipose tissues (Jaber et al. Citation2011), thus increased plasma cholesterol concentration. Similar increased level of plasma cholesterol induced by limited water intake was reported in goats (Akinmoladun et al. Citation2020b) and sheep (Jaber et al. Citation2004).
The observed increase in plasma glucose in this study contradicts the unchanged concentrations observed in goats (Alamer Citation2006; Abdelatif et al. Citation2010), as well as the significant drop, observed in sheep (Li et al. Citation2000) during water deprivation. Such variations in plasma glucose concentration could be as a result of the pattern of dehydration adopted in this study which allows for rehydration for 24 h. Normally, small ruminant adaptively responds to limited water intake by depressing feed intake, and such feed intake depression may affect blood concentration of glucose (Akinmoladun et al. Citation2019). The increased blood constituents due to limited water intake agree with the report of Alamer (Citation2006) who observed increased plasma concentrations of creatinine, urea and plasma osmolality in Saudi Arabia indigenous goats subjected to a 3-day water deprivation study. The haemo-concentration of blood constituents resulting from limited water intake has also been documented in goats and sheep (Nejad et al. Citation2014; Akinmoladun et al. Citation2020b).
Conclusions
It was concluded that water deprivation influences intake, growth performance and the blood constituents, thereby impacting on the productivity as well as the nutritional status of Nguni goats. In general, goats deprived water over 48 h resulted in the highest daily water, feed intake, faecal egg counts and blood metabolites. To ensure efficient use of water resources, one can deprive Nguni goats for 24 h considering that goats subjected to 48 hours of water deprivation resulted in negative growth, with the faecal egg counts and FAMACHA scores becoming more severe.
Ethical approval
The experimental animals were raised in line with the animal regulatory standard and welfare protocol of the Animal Ethics Committee of the University of KwaZulu-Natal (Reference No. 072/14/Animal).
Acknowledgments
The authors appreciate the staff at Ukulinga Research Farm, University of KwaZulu-Natal (UKZN). The authors also acknowledge the financial support from the National Research Foundation of South Africa and the UKZN Competitive Research Grant. The authors are also grateful to the Govan Mbeki Research and Development Centre, University of Fort Hare, South Africa, for providing the financial assistance to publish this research article.
Disclosure statement
The authors declare that there is no conflict of interest associated with this paper.
References
- Abdelatif AM, Elsayed SA, Hassan Y. 2010. Effect of state of hydration on body weight, blood constituents and urine excretion in Nubian goats (Capra hircus). World J Agric Sci. 6:178–188.
- Akinmoladun OF, Fon FN, Mpendulo CT. 2020a. Stress indices, carcass characteristics and meat quality of water restricted Xhosa goats supplemented with vitamin C. Livest Sci. 238:104083.
- Akinmoladun OF, Fon FN, Mpendulo CT, Okoh O. 2020b. Performance, heat tolerance response and blood metabolites of water restricted Xhosa goats supplemented with vitamin C. Transl Anim Sci. 4:1–15.
- Akinmoladun OF, Muchenje V, Fon FN, Mpendulo CT. 2019. Small ruminants: farmers' hope in a world threatened by water scarcity. Animals. 9:456.
- Alamer M. 2006. Physiological responses of Saudi Arabia indigenous goats to water deprivation. Small Rumin Res. 63:100–109.
- Alamer M. 2009. Effect of water restriction on lactation performance of Aardi goats under heat stress conditions. Small Rum. Res. 84:76–81.
- Alamer M. 2010. Effect of water restriction on thermoregulation and some biochemical constituents in lactating Aardi goats during hot weather conditions. J. Basic Appl Sci Res. 11:189–205.
- Alamer M, Al-Hozab A. 2004. Effect of water deprivation and season on feed intake, body weight and thermoregulation in Awassi and Najdi sheep breeds in Saudi Arabia. J Arid Environ. 59:71–84.
- Bengaly K, Mhlongo S, Nsahlai IV. 2007. The effect of wattle tannin on intake, digestibility, nitrogen retention and growth performance of goats in South Africa. Livest Res Rural. 19: 50.
- Casamassima D, Vizzarri F, Nardoia M, Palazzo M. 2016. Effect of water restriction on various physiological variables on intensively reared Lacaune ewes. Vet Med. 61:623–634.
- Choshniak I, Wittenberg C, Rosenfeld J, Shkolnik A. 1984. Rapid rehydration and kidney function in the black Bedouin goat. Physiol Zool. 57:573–579.
- Donnenfeld Z, Crookes C, Hedden S. 2018. A delicate balance: water scarcity in South Africa. Pretoria (South Africa): Institute for Security Studies; p. 1–24.
- El-Nouty FD, Al-Haidary AA, Basmaeil SM. 1990. Physiological responses, feed intake, urine volume and serum osmolality of Aardi goats deprived of water during spring and summer. Asian Australas J Anim Sci. 3:331–336.
- Gerhart KL, White RG, Cameron RD, Russell DE. 1996. Estimating fat content of caribou from body condition scores. J Wildl Manage. 60:713–718.
- Gosain AK, Sandhya R, Debajit B. 2006. Climate change impact assessment on the hydrology of Indian river basins. Curr Sci. 90:346–353.
- Habibu B, Kawu MU, Aluwong T, Makun HJ. 2017. Influence of seasonal changes on physiological variables, haematology and serum thyroid hormones profile in male Red Sokoto and Sahel goats. J Appl Anim Res. 45:508–516.
- Hamadeh SK, Rawda N, Jaber LS, Habre A, Abi Said M, Barbour EK. 2006. Physiological responses to water restriction in dry and lactating Awassi ewes. Livest Sci. 101:101–109.
- Hassan GE. 1989. Physiological responses of Anglo-Nubian and Baladi goats and their crossbreeds to water deprivation under subtropical conditions. Livest Prod Sci. 22:295–304.
- Hogan JP, Petherick JC, Phillips CJC. 2007. The physiological and metabolic impacts on sheep and cattle of feed and water deprivation before and during transport. Nutr Res Rev. 20:17–28.
- Jaber L, Chedid M, Hamadeh S. 2013. Water stress in small ruminants. In: Akinci S, editor. Responses of organisms to water stress. Rijeka (Croatia): InTech; p. 115–149.
- Jaber LS, Habre A, Rawda N, Abi Said M, Barbour EK, Hamadeh S. 2004. The effect of water restriction on certain physiological parameters in Awassi sheep. Small Rumin Res. 54:115–120.
- Jaber LS, Hanna N, Barbour EK, Said MA, Rawda N, Chedid M, Hamadeh SK. 2011. Fat mobilization in water restricted Awassi ewes supplemented with vitamin C. J Arid Environ. 75:625–628.
- Jacob RH, Pethick DW, Clark P, D'Souza DN, Hopkins DL, White J. 2006. Quantifying the hydration status of lambs in relation to carcass characteristics. Aust J Exp Agric. 46:429–437.
- Kaliber M, Koluman N, Silanikove N. 2015. Physiological and behavioral basis for the successful adaptation of goats to severe water restriction under hot environmental conditions. Animal. 10:82–88.
- Kaplan RM, Burke JM, Terrill TH, Miller JE, Getz WR, Mobini S, Valencia E, Williams MJ, Williamson LH, Larsen M, et al. 2004. Validation of the FAMACHA© eye colour chart for detecting clinical anaemia in sheep and goats on farms in the Southern United States. Vet Parasitol. 123:105–120.
- Li BT, Christopherson RJ, Cosgrove SJ. 2000. Effect of water restriction and environmental temperatures on metabolic rate and physiological parameters in sheep. Can J Anim Sci. 80:97–104.
- Mengistu U, Dahlborn K, Olsson K. 2007. Effects of intermittent watering on water balance and feed intake in male Ethiopian Somali goats. Small Rum Res. 67:45–54.
- Muna MMA, Ammar IES. 2001. Effect of water and feed restriction on body weight change and nitrogen balance in desert goats fed high- and low-quality forages. Small Rumin Res. 41:19–27.
- Nejad GJ, Lohakare JD, West JW, Sung KI. 2014. Effects of water restriction after feeding during heat stress on nutrient digestibility, nitrogen balance, blood profile and characteristics in Corriedale ewes. Anim Feed Sci Technol. 193:1–8.
- Rumosa-Gwaze F, Chimonyo M, Dzama K. 2010. Nutritionally-related blood metabolites and faecal egg counts in indigenous Nguni goats of South Africa. S Afr J Anim Sci. 40:480–483.
- SAS. 2010. SAS/STAT Software Release 9.3. Cary (NC): SAS Institute.
- Shkolnik A, Maltz E, Choshniak I. 1980. The role of the ruminants digestive tract as a water reservoir. In: Rockebusch Y, Thiven P, editors. Digestive physiology and metabolism in ruminants. Lancaster (UK): MTP Press; p. 731–741.
- Silanikove M. 2000. The physiological basis of adaptation in goats to harsh environments. Small Rumin Res. 35:181–193.
- Silanikove N. 1994. The struggle to maintain hydration and osmoregulation in animals experiencing severe dehydration and rapid rehydration: the story of ruminants. Exp Physiol. 79:281–300.
- van Wyk JA, Bath GF. 2002. The FAMACHA system for managing haemonchosis in sheep and goats by clinically identifying individual animals for treatment. Vet Res. 33:509–529.
- Webb EC. 2014. Goat meat production, composition and quality. Anim Front. 4:33–37.