
Abstract
South African native chicken breeds are no exception to the declining of local domestic breeds that has long been recognised and found associated with the commercialisation of breeding in domestic animals. The aims of the study were: (i) to provide a comprehensive view of genetic variation in four KwaZulu-Natal indigenous chicken populations (Jozini, Newcastle, Pietermaritzburg, and Port Shepstone), and (ii) to estimate the extent of differentiation of the village populations from three conserved South African indigenous pure breeds (Potchefstroom koekoek, Ovambo, and Venda) by genotyping individuals at 19 autosomal microsatellite loci. Finally, (iii) new information to the history of KwaZulu-Natal indigenous chicken populations was made available by exploring their phylogenetic relationship and their possible maternal origin through the mitochondrial DNA. The results suggested noticeable genetic diversity within and between ecotypes with clear sub-structuring between them. The indigenous populations had high genetic diversity (observed heterozygosity ranging from 0.61 in Pietermaritzburg to 0.70 in Jozini) while conserved populations showed considerable within population inbreeding coefficient (from 0.01 in Potchefstroom koekoek to 0.18 in Ovambo). Median-joining network analyses indicated the dominance of haplogroup E suggesting a likely Southeast Asia and/or Indian subcontinent origin. The presence of haplogroup B and C not only emphasises multiple maternal origin but also highlights genetic introgression of local chickens with commercial genotypes. These results highlighted the importance of local breeds as a genetic reservoir; moreover, the conservation of local breeds may play an important role in the local economy as a source of high-quality products for consumers.
The genetic variation and differentiation of KwaZulu-Natal indigenous chicken populations and pure South African chicken breeds is investigated.
The village populations showed a noticeable genetic variability with clear sub-structuring between them.
The results can be used to improve a sustainable breeding and conservation programs to control possible genetic dilution with commercial genotypes.
Highlights
Introduction
Domestic chickens have long been used for religious activities, decorative arts, and entertainment (Liu et al. Citation2006). However, their history of domestication and routine of distribution over the whole world is still unstable and open to debate (Zhang et al. Citation2017). Asia and African continents have a long history of crops and livestock that interchanged between them due to maritime and terrestrial corridors (Boivin and Fuller Citation2009). Mwacharo et al. (Citation2011) reported that East Africa and Asia experienced important maritime exchanges following the monsoon wind patterns of the Indian Ocean. Cattle, pigs, chickens, broomcorn millet and bananas are some of the livestock and crop domesticates that arrived in Africa from Asia through maritime routes (Boivin and Fuller Citation2009). Domestic chickens are now recognised as an important component of the rural household livelihood by providing good quality meat and eggs, used as a source of income, and as gifts to strengthen social relationships at a cheaper cost (Weimann et al. Citation2016).
For centuries, locally adapted chicken breeds have been exposed to unfavourable environmental conditions in Southern African Development Community regions. As a result, they have developed adaptive traits and genetic combinations that allow them to survive under local conditions including water and food availability, climate, and disease outbreaks (Köhler-Rollefson Citation2004). However, breeding programs in domestic animals have gradually favoured the use of highly productive exotic breeds which has consequently led to decline of population sizes of low performing native breeds (Abebe et al. Citation2015). There is a concrete risk of extinction of native domestic chicken breeds (FAO Citation2009; Fathi et al. Citation2017). Approximately 33% of local chicken breeds globally have been classified as endangered, thus their valuable genotypes could be lost through extinction (Mahammi et al. Citation2016; Strillacci et al. Citation2017).
Although local chickens are still widespread in the rural villages of South Africa, their genotype is under threat due to indiscriminate crossbreeding practices (Reardon et al. Citation1998). Halima et al. (Citation2007) reported that random distribution of exotic chicken breeds by both governmental and non-governmental organisations, resulted in dilution of the indigenous chicken genetic stock, leading to biological diversity loss. Imported chicken breeds over the years have been used in developing countries by genetic programmes to improve productivity (Dana et al. Citation2011). According to Khobondo et al. (Citation2015) exotic breeds (such as White and Brown Leghorns, Rhode Island Red, New Hampshire, Australorp, and White Sussex) have been introduced to improve local chicken performances.
Despite genetic erosion due to human practice, factors such as diseases and predators are also some of the reasons why these valuable genetic resources are still being lost. However, initiating conservation programmes can be helpful towards protecting their highly diverse gene pool. In animal breeding, decision-making is guided by the knowledge of breed peculiarities (FAO Citation2007a, Citation2007b). FAO (Citation2012) reported that genetic characterisation describes and classifies animal breeds and species at molecular level using DNA-based techniques. On the other hand, livestock phenotypic characterisation classifies livestock populations and clarifies their external and production characteristics in a given environment and management, considering social and economic factors that affect them.
Poultry breeds characterisation methods have gradually been upgraded, from morphological traits to molecular levels (Mtileni et al. Citation2011a). The use of molecular markers can provide quantified criteria for assessing genetic diversity, either within or between populations (FAO Citation2009). Microsatellites and mitochondrial DNA (mtDNA) are markers used to investigate genetic makeup for many domestic animals (Groeneveld et al. Citation2010; Di Lorenzo et al. Citation2015; Lasagna et al. Citation2020). These markers complement each other to provide a more relevant reflection of population genetic makeup and its relationship with other populations (Ceccobelli et al. Citation2015). The study sought to investigate (i) the genetic variation within and between KwaZulu-Natal village indigenous chicken populations sampled in different agro-ecological zones and (ii) the extent of differentiation of the village populations from the conserved South African indigenous pure breeds. White Sussex is a British dual-purpose breed that is adapted to local conditions (Hrnčár et al. Citation2016) and due to its noticeable high frequencies on studied village farms, it was included in this study in order to estimate its effect on the genetic dilution phenomenon in South African indigenous chicken populations. Furthermore, the control region mtDNA variation of these populations was analysed. Haplotypes were classified in different haplogroups in order to clarify their phylogenetic relationship and to reconstruct their possible maternal origin.
Materials and methods
Ethics statement
All experimental procedures were reviewed and approved by the University of Zululand Research Ethics Committee, Reg No: UZRC 171110-030 PGM 2016/342.
Animal sampling and DNA extraction
A total of 199 blood samples were randomly collected from 4 different regions of KwaZulu-Natal (KZN), including Jozini (JO, n = 30), Newcastle (NE, n = 30), Pietermaritzburg (PM, n = 30), Port Shepstone (PO, n = 30) with 50% representation of males and females per region. Minimum of 3 mL of blood was collected from a wing vein of each animal in a vacutainer® system tube, containing EDTA as an anticoagulant, then stored at −20 °C until the DNA extraction was made. Genomic DNA was extracted as reported by Selepe et al. (Citation2018). All analysed individuals per region were selected from different farms (minimum of 5 farms per population) that are widely separated by geographical barriers to avoid repeated selection of closely related individuals per region. Selected individuals can then be considered as the representative sample of village populations within each area. Pure breeds of most common South African indigenous chicken were sampled as reference populations for comparison with village populations: Potchefstroom koekoek (KO, n = 20), Ovambo (OV, n = 20), and Venda (VE, n = 19). One exotic pure breed (common in the areas of KwaZulu-Natal), White Sussex (WH, n = 20), was also sampled to trace any crossbreeding.
The details of the studied chicken populations/breeds are reported in Supplementary Table S3.
Microsatellite molecular analysis
A total of 19 microsatellite loci (MCW0248, MCW0111, ADL0268, MCW0020, MCW0034, MCW0222, MCW0037, MCW0295, LEI0094, MCW0098, MCW0078, ADL0278, MCW0067, ADL0112, MCW0216, MCW0123, MCW0330, MCW0165, MCW0069 – Supplementary Table S1) were chosen from a list of 30 microsatellites recommended by the ISAG/FAO (Citation2004) for chicken genetic studies. Markers were selected according to their level of polymorphism and also to their performance in a previous research (Ceccobelli et al. Citation2015). Multiplex PCR was carried out according to ISAG/FAO (2004) recommendations using an ABI ProFlexTM 3 × 32-well PCR system. The PCR conditions were as follows: initial denaturation step of 5 min at 95 °C, 35 cycles of 30 sec at 90 °C, 45 sec at the annealing temperature of each multiplex PCR, 30 sec at 72 °C and a final extension period of 15 min at 72 °C. Products from Multiplex PCR were pulled under electrophoresis to allow the analysis of several microsatellites. An automated DNA Sequencer (ABI 3500 Genetic Analyser, Applied Biosystems, Forest City, CA, USA) and GeneMapper version 5.0 software (Applied Biosystems, Foster City, CA, USA) were used to determine the size of each fragments.
Microsatellite statistical analysis
Allele frequencies, mean number of alleles, polymorphic information content (PIC) for each microsatellite loci, and observed and expected heterozygosity in the eight populations were estimated using the MICROSATELLITE TOOLKIT (Park Citation2001). To calculate average allelic richness and richness of private alleles for each population, the rarefaction method (Kalinowski Citation2004) implemented in HP-RARE version 1.0 software was used, adopting a sample of 13 individuals (Kalinowski Citation2005). MICRO-CHECKER version 2.2.3 (Van Oosterhout et al. Citation2004) was used to detect possible genotyping errors due to allelic dropout, stuttering and null alleles. A test for departure from Hardy–Weinberg equilibrium (HWE) was done using the Markov Chain Monte Carlo method (20 batches, 5,000 iterations per batch and a dememorisation number of 10,000) implemented in GENEPOP version 4.0 software (Raymond and Rousset Citation1995). Levels of significance were adjusted using Bonferroni procedure (Rice Citation1989). The FIS for each population was calculated via bootstrapping using 1,000 replicates with GENETIX software version 4.05 (Belkhir et al. Citation2004). The pairwise FST indexes of Weir and Cockerham (Weir and Cockerham Citation1984) between populations and their associated 95% confidence intervals were estimated using GDA software (Lewis and Zaykin Citation1999).
The Reynolds weighted genetic distance (Reynolds et al. Citation1983) among the populations was calculated and a neighbour-joining tree was reconstructed using PHYLIP package version 3.6 (Felsenstein Citation2005); the dendrogram was depicted using the software package TreeView version 1.6.6 (Page Citation1996). Population structure across the entire dataset was analysed using a Bayesian approach implemented in STRUCTURE software version 2.3.4 (Pritchard et al. Citation2000) to assess the most probable number of partitions in the dataset without the assumption of the breed identities. The assignment of individuals to populations considered an ancestry model with admixture, correlated allele frequencies and defined sampling location for each individual. Ten independent runs with 500,000 MCMC (Markov Chain Monte Carlo) iterations and a burn-in of 200,000 steps were performed for 2 ≤ K ≤ 7 (K= number of clusters) to estimate the most likely number of clusters present in the dataset. The algorithm of Evanno et al. (Citation2005) was adopted in order to evaluate the most probable value of K. STRUCTURE HARVESTER (Earl and vonHoldt Citation2012), a web-based programme, was used for collating results generated by the programme STRUCTURE. The clustering pattern was implemented in the CLUMPP programme and visualised using the DISTRUCT software version 1.1 (Rosenberg Citation2004).
To further investigate the genetic structure of each breed when adopting an approach without assumptions about HWE or linkage disequilibrium, Discriminant Analysis of Principal Component (DAPC) was carried out using the method implemented in the ADEGENET package (Jombart Citation2008) within the statistical package R version 3.3.2 (2020). DAPC was conducted without a posteriori group assignment by inferring the most likely number of genetic clusters (K) using the find clusters function. This procedure utilises K-means clustering to calculate a Bayesian information criterion (BIC) value for each potential value of K (the most likely K has the lowest BIC value) and delineates individual group assignments for DAPC.
Mitochondrial DNA molecular analysis
A subset of DNA samples randomly chosen for each KwaZulu-Natal native chicken ecotypes and pure breeds were sequenced as shown in Table . In relation to the complete mitochondrial sequence (accession number NC_040970.1; Liu et al. Citation2018) control region mtDNA amplification was performed from nucleotide position np 16,741 to np 1279 (1324 base pairs). DNA was amplified by PCR using the following primers: forward 5′-AGGACTACGGCTTGAAAAGC-3′ and reverse 5′-CATCTTGGCATCTTCAGTGCC-3′. DNA amplification was conducted in a 25 μl volume with 3 ul of 25 mM MgCl2, 2 μl of 10 mM dNTPs, 10 mM of each primer and 0.2 μl of 5 U/μl of Taq® DNA polymerase. PCR conditions were as follows: denaturation for 5 minutes at 95 °C followed by 35 cycles consisting of 95 °C for 30 s, 60 °C for 30 s, and 72 °C for 75 s. PCR was finalised with a 5 min extension at 72 °C. Purified PCR products were sent to central analytical facilities of Stellenbosch University, for Sanger sequencing with the forward primer 5′-AGGACTACGGCTTGAAAAGC-3′. Electropherograms were aligned, assembled, and compared using Sequencher™ 5.10 software (Gene Codes Inc., Ann Arbour, MI, USA). Fragments of 530 base pairs (from np 21 to np 550) resulted from the standardisation and optimisation of the ecotypes and pure breeds sequencing results. Additional nucleotide bases that exceeded np 550 were excluded from the analysis in order to make uniform our dataset. The mtDNA sequences have been deposited in GenBank with accession numbers MT684350-MT684456. All sequences were compared with the reference sequence (Liu et al. Citation2018) and classified in haplotypes and haplogroups, following the nomenclature previously published by Miao et al. (Citation2013).
Mitochondrial statistical analysis
Genetic diversity indices such as haplotype diversity (Hd), nucleotide diversity (π), and average number of nucleotide differences (k) were estimated by DnaSP 5.10 software (Librado and Rozas Citation2009). Analysis of molecular variance (AMOVA) and pairwise FST calculations were performed using the Arlequin software package version 3.5 (Excoffier and Heidi Citation2006). Significance testing of the values was performed using 1000 coalescent simulations. Intrapopulation and interpopulation comparisons were performed based on the number of pairwise differences between sequences and calculated using an Arlequin integrated R script (http://www.rproject.org/).
In order to assess the potential phylogeographic origin of the samples, reference sequences from Miao et al. (Citation2013) haplogroups were included (Supplementary Table S2). Network 5.0 software (http://www.fluxus-engineering.com/sharenet.htm) was used to draw maximum parsimony median-joining (MP) network plots.
Results
Microsatellite polymorphisms
A total of 161 alleles were observed with an average of 8.47 alleles per locus across the 19 microsatellite loci for the eight studied South African populations (Supplementary Table S1). All studied markers were found to be polymorphic. Level of polymorphism fluctuated between markers with number of alleles per locus ranging from 4 (MCW0222 and MCW0098) to 13 (MCW0034 and LEI0094). The expected frequencies of heterozygotes per locus ranged from 0.51 (MCW0216) to 0.75 (MCW0165) while that observed stretched from 0.43 (MCW216) to 0.77 (MCW0248).
Mean number of observed alleles (MNA), allelic richness (R), private allelic richness (PR), mean observed (HO) and expected heterozygosity (HE), and inbreeding coefficient (FIS) per population are presented in Table .
Table 1. Genetic diversity of eight studied chicken populations/breeds.
The village populations had higher mean number of alleles per locus compared to the conserved flocks. The MNA per population extended from 4.63 (PM) to 5.32 (PO) and has an across all the village population average value of 4.98 ± 1.48 alleles per locus. Mean allelic richness values (mean value of 4.50) were similar in all village populations, varying within a short range, from 4.13 in PM to 4.84 in PO, assuming a minimum sample size of 13 individuals.
The expected and observed average heterozygote frequencies within populations across loci were 0.68 (ranging from 0.65 to 0.72) and 0.67 (ranging from 0.61 to 0.70), respectively. The conserved flocks showed lower values of expected and observed heterozygote frequencies (0.59 and 0.53, respectively) than those recorded for the village populations. The MICRO-CHECKER analysis suggested that there were no indications of scoring error due to stuttering, large allele dropout or evidence for null alleles. Following Bonferroni correction, 1.50 of the 19 loci (a mean value in the total ecotype samples) were noted to have deviated from HWE. JO and NE populations were at HWE for all examined loci.
The inbreeding coefficient (FIS) estimated in the village populations ranged from 0.074 (PM) to −0.038 (NE).
Genetic differentiation, distance and phylogeny
Table demonstrates pairwise genetic differentiation (FST) between the populations that were studied. Values presented showed that the longest distance relationship was between VE and WH (0.371), while PO and NE (0.094) were the closest. The village populations had a relatively closer genetic distance to KO than to other breeds, JO was closely related (0.179), followed by NE (0.192) while PO and PM had the longest distances (0.231 and 0.236, respectively) to KO.
Table 2. Pairwise FST among studied breeds/populations (with confidence interval of 95%).
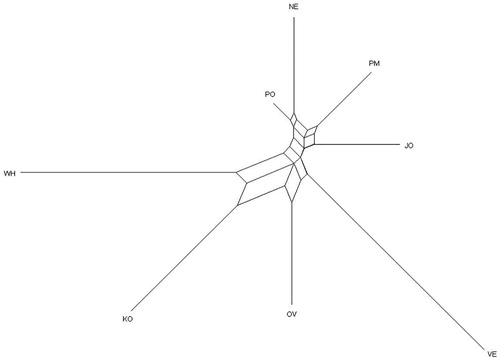
The consensus neighbour-joining phylogenetic tree constructed using Reynolds’ genetics distance (Figure ), revealed three main clusters among the eight chicken populations/breeds. The first cluster comprised PO, NE, PM, and JO. The second cluster had OV and VE, while the last cluster comprised KO and WH. The conserved breeds (KO, OV, VE, WH) showed longer branches than the four KwaZulu-Natal populations studied.
Figure 1. Genetic relationship among the four studied populations and the four reference breeds, using Reynolds’ genetic distance according to the neighbour-joining algorithm. JO: Jozini; NE: Newcastle; PM: Pietermaritzburg; PO: Port Shepstone; KO: Potchefstroom Koekoek; OV: Ovambo; VE: Venda; WH: White Sussex.
Genetic structure and admixture analysis
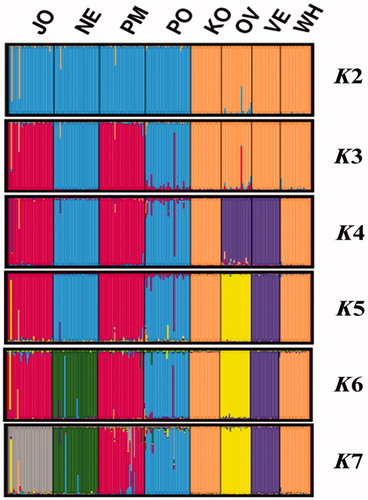
Using Bayesian approach, individuals were clustered to 2 ≤ K ≤ 7 for admixture analysis and the results of STRUCTURE are presented in Figure . This analysis was made to assess identification of variation among populations and also to reveal hidden substructures within them. At the lowest K-value (K = 2), all ecotypes clustered together and the conserved population (KO, VE, OV) formed one cluster with the exotic breed (WH). KO and WH showed a homogenous population structure, forming one common structure for every K-value. At K = 3 and 4 JO, PM and OV, and VE separated and formed independent clusters respectively. Similarity between populations appeared to drop dramatically at 5 ≤ K ≤ 7 for every K value each population clustered separately. NE and PM were found to have few individuals from the PO population at K = 7. The highest similarity coefficient was at K = 7, and was found as the most probable clustering (Supplementary Figure S1(a)).
Figure 2. Clustering of the four studied populations and the four reference breeds with STRUCTURE analysis. JO: Jozini; NE: Newcastle; PM: Pietermaritzburg; PO: Port Shepstone; KO: Potchefstroom Koekoek; OV: Ovambo; VE: Venda; WH: White Sussex.
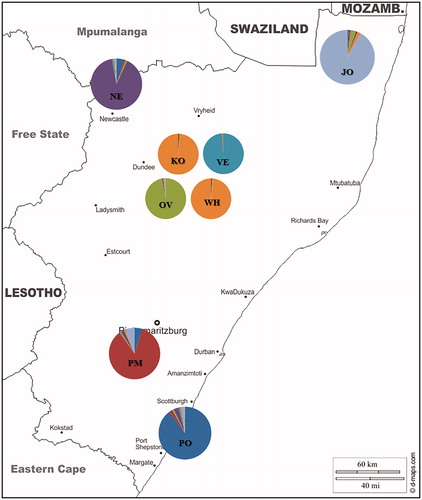
Although ecotype populations and pure breed flocks appeared to cluster independently at K = 2, while partial admixture is noticeable between OV and all ecotypes (Figure ). The map presented in Figure was used to highlight the distribution of membership coefficients according to population and geographic location. This was done using the Q-matrix averaged over similar run for K = 7.
Figure 3. Representation of sample size (indicated by diameter of the pies) and of relative admixture distribution (indicated by different colours) inferred by STRUCTURE at K = 7. JO: Jozini; NE: Newcastle; PM: Pietermaritzburg; PO: Port Shepstone; KO: Potchefstroom koekoek; OV: Ovambo; VE: Venda; WH: White Sussex. Source: figure taken from http://www.d-maps.com and adapted for illustrative purpose only.
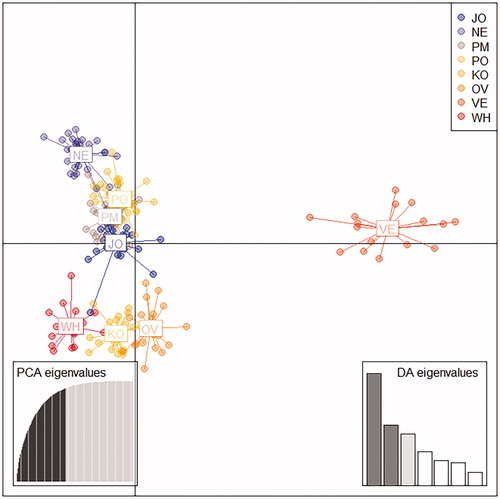
The Bayesian Information Criterion (BIC) statistic generated by Discriminant Analysis of Principal Components (DAPC) showed that the optimal number of clusters in the data set is K = 8 (Figure , Supplementary Figure S1(b)), performing one more cluster by DAPC than those generated by STRUCTURE. In the DAPC analysis, 60 PCs of the PCA were retained as input to discriminant analysis, accounting for approximately 93% of the total genetic variability. The scatterplot of the first three components of the DA (Figure ) showed extensive sharing of genetic variation among KwaZulu-Natal ecotypes. In particular, the plot showed genetic proximity and a particular affinity among NE, PO, PM, JO. While VE appeared clearly distinct from the other populations. Using the grouping function obtained in the discriminant analysis, a high proportion of individuals were found to be correctly assigned to their original group: JO (97%), NE (97%), PO (97%). The lowest score was observed for PM (90%).
Figure 4. Scatterplot of the first two principal components of Discriminant Analysis of Principal Component (DAPC) using populations as a posteriori clusters. The individuals are assigned to populations a posteriori, that is, after determining the number of clusters by the programme, instead of forcing them into known populations. Populations are labelled inside their 95% inertia ellipses and dots represent individuals. JO: Jozini; NE: Newcastle; PM: Pietermaritzburg; PO: Port Shepstone; KO: Potchefstroom koekoek; OV: Ovambo; VE: Venda; WH: White Sussex.
Mitochondrial DNA diversity
Nucleotide diversity, polymorphic site, number of haplotypes, diversity of haplotypes and number of sequences are presented in Table . A total of 107 mtDNA control region sequences spanning from nucleotide position (np) 21 to np 550, including 530 bp of the mtDNA control region, and belonging to eight South African chicken populations/breeds, were analysed. All the sequences revealed the presence of 36 polymorphic sites (S) ranging from six (JO, PO, NE) to 19 (OV) (Table ). Nucleotide diversity (π) across all ecotype individuals was estimated at 0.00902, whereas between pure breeds π was equal to 0.01004. The haplotype diversity (Hd) was determined at 0.734 for ecotypes and 0.723 for pure breeds. The total number of haplotypes found was five with PM having the highest (four) and JO having the lowest (two) values. The ecotype diversity analysis showed the highest haplotype diversity (0.654) in PM and the lowest (0.485) in NE. Among pure breeds, the haplotype diversity was 0.723, with OV the highest (0.895) and WH the lowest value (0.473).
Table 3. Genetic diversity within the studied chicken ecotypes/pure breeds based on mitochondrial DNA variation.
Mitochondrial DNA phylogeny analysis
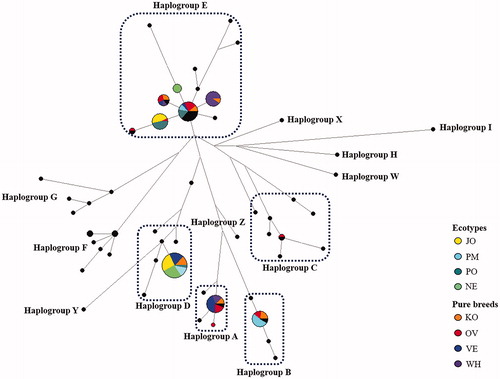
To investigate the relationships of haplotypes, we constructed a network plot for South African village chickens with the pure chicken breeds reared in the same geographic area (Figure ). The median-joining network analysis was based on 11 haplotypes of this study along with 55 reference sequences corresponding to the 13 haplogroups (A–Z) defined by Miao et al. (Citation2013). The median-joining network revealed a clear pattern among village chickens and pure breeds. The median-joining tree exhibited a star-like distribution profile centred on the predominant haplogroup (E), indicating a recent exponential population growth. In clade B, D and E, the core haplotypes occurred in ecotype chickens, whereas, A and C haplogroups are a peculiarity of pure breeds.
Figure 5. Median-Joining network. Black circles refer to reference haplotypes. Circles are proportional to the numbers of samples. JO: Jozini; NE: Newcastle; PM: Pietermaritzburg; PO: Port Shepstone; KO: Potchefstroom koekoek; OV: Ovambo; VE: Venda; WH: White Sussex.
According to the analysis of pairwise genetic distances between populations, PM was the most genetically distant and it was also the most heterogeneous breed even when comparing to village populations and to the conserved South African indigenous pure breeds. Furthermore, JO and NE resulted being the most closely related (Supplementary Figure S2). The maternal genetic sub-structure was also assessed within and between studied populations by analysis of sequence variations (AMOVA) following imposition of two hierarchical groupings (Table ). A huge within-population variation contributed 76% to the total maternal variance, while the 5.24% of the observed variation was accounted to differences between the South African ecotypes belonging to this study and pure breeds reared in the same geographic areas, with an overall ΦST value of 0.240 (p ≤ .001).
Table 4. Hierarchical analysis of molecular variance (ecotypes vs pure breeds).
Discussion
Comprehensive knowledge of population structure and the distribution of genetic diversity in livestock are essential aspects for improving selection designs and breeds, supporting the safeguard of biodiversity, enhancing the efficient use of the breeds, and implementing conservation programs adapted to local conditions. In this study, the level of diversity of KwaZulu-Natal village indigenous chicken populations from different South African agro-ecological zones, their genetic distinctiveness from conserved South African indigenous pure breeds and the phylogenetic relationship and maternal origin were reported.
Microsatellites
All 19 microsatellites used in this study displayed a minimum of four alleles per locus with mean number of alleles (8.47) above 4, making them effective for genetic diversity judgement (Barker Citation1994). The mean values of HO and HE were 0.59 and 0.63 (above 50), respectively (Supplementary Table S1), highlighting noticeable genetic diversity across eight studied chicken populations. Ecotypes had a higher mean number of alleles and allelic richness than conserved flocks. Allelic richness is a measure of genetic diversity and an indicative of a population’s long-term adaptability and persistence potential (Özdemir and Cassandro Citation2018). Results showed that the village populations are more genetically diverse than the conserved pure breeds and current values are in range with those reported by Van Marle-Köster et al. (Citation2008) and Mtileni et al. (Citation2011a) on South African populations. Relatively higher genetic diversity has been reported previously on local chickens (Wimmers et al. Citation2000; De Marchi et al. Citation2006; Muchadeyi et al. Citation2007; Mtileni et al. Citation2011a; Özdemir and Cassandro Citation2018). Muchadeyi et al. (Citation2007) and Mtileni et al. (Citation2011a) suggested that continuous gene flow due to immigration and emigration between subpopulations could be the reason for high genetic diversity possessed by scavenging populations sharing the same geographic zone. The observed heterozygosity values in all the ecotypes were above 60%, indicating that all analysed ecotypes are characterised by noticeable genetic diversity. Additionally, this high observed heterozygosity can further be attributed to the large number of alleles detected. Conserved South African indigenous chicken breeds observed heterozygosity range (50–55%) suggest that these populations are well managed to protect their genetic variability in conservation flocks (Table ).
Conserved South African breeds had greater genetic distance among their populations, as evidenced by high FST values between them (Table ). This was expected because they are managed under an intensive production system and are subjected to closed populations with minimum immigration and emigration. In addition, these populations had restricted gene flow accompanied by non-random mating with a limited gene pool which Muchadeyi et al. (Citation2007) reported as militating against genetic diversity. Sumreddee et al. (Citation2019) reported that inbreeding is very sensitive to high allele frequency and actually reduces it. Low allelic frequency within conserved populations (OV, VE) may be the result of excessive inbreeding within these populations, as confirmed by high inbreeding coefficients (Table ). Similar to findings described by Van Marle-köster et al. (2008), conserved flocks showed a high inbreeding coefficient compared to village flocks.
Animals respond to the environment and adapt phenotypically and genetically for their survival (Benatchez Citation2016). South African ecotypes appear to have moderately high FST values between them, suggesting clear sub-structuring. These results are in contrast to Muchadeyi et al. (Citation2007) findings with Zimbabwean single structured ecotypes. The authors reported that Zimbabwean local chicken populations are not sub-structured across their agro-ecological zones and not locally adapted and restricted to their local zones. However, the study by Lyimo et al. (Citation2014) on Ethiopian ecotypes’ genetic diversity reported that Ethiopian ecotypes appeared to cluster in three distinct groups related to their geographic location, thus complementing findings of the current study. Results from this study indicate that the analysed South African village population’s genotypes are highly diverse with well sub-structured ecotypes.
STRUCTURE-based analysis further supports the high differentiation among ecotypes of the South African chickens. The most probable clustering was found at K = 7 where each flock separated independently, suggesting clear sub-division between all the studied South African populations. These results suggest that all populations from different regions of KwaZulu-Natal showed different allelic frequencies, which is a reflection of the larger gene pool of KZN indigenous chicken populations.
Mitochondrial DNA
Vilakazi (Citation2018) reported high phenotypic variation among South African indigenous chicken populations on traits such as plumage colour, skin colour, shank colour, comb type, ear lobe colour, and eye colour. Considerable ecotypes genetic diversity presented by the current study substantiate findings by Mtileni et al. (Citation2011a) and Mtileni et al. (Citation2011b) using microsatellites and mtDNA genetic markers respectively. However, our mtDNA sequence analysis revealed higher genetic diversity from conserved than village population thus contradicts with our previous findings using microsatellite markers. According to Fratini et al. (Citation2011), microsatellites and mitochondrial DNA genetic markers have different molecular and evolutional properties thus may disclose different distribution patterns of recorded genetic diversity. The haplotype diversity in the conserved pure South African breed flocks and village flock ecotypes occur at equal frequencies, and this reveals the positive effect of controlled genetic flow in a population and further highlights the interest and the need for conservation. The lowest haplotype diversity in the conserved exotic pure breed (WH) is in agreement with Muchadeyi et al. (Citation2008) findings using mtDNA, in which Zimbabwean ecotypes possessed greater genetic diversity compared with exotic commercial white egg layer. Fluctuation of genetic variability presented by the studied indigenous chicken ecotypes of KwaZulu-Natal agrees with the suggestions of Delany (Citation2003) and Muchadeyi et al. (Citation2007) that population isolation through geographic location can lead to population sub-structuring and gene pool status variability.
Four of the five haplogroups observed in the current study (A, B, D and E), were previously reported by Mtileni et al. (Citation2011b). Although this work reveals for the first time haplogroup C in South African populations, it was previously described in other African countries such as Kenya, Madagascar (Herrera et al. Citation2017), Nigeria (Lasagna et al. Citation2020) and Ethiopia (Al-Jumaili et al. Citation2020). It is known that haplogroup E is one of the haplogroups showing ubiquity on chicken mtDNA profile globally. According to Mwacharo et al. (Citation2011) observations on domestic chickens in East Africa, haplogroup E was only observed in Ethiopia and Sudan. However, the current study discovered equal representation of all studied populations in haplogroup E suggesting it as a dominant maternal lineage. This is in agreement with Mtileni et al. (Citation2011b) previous findings which also revealed the dominance of haplogroup E in South African chicken populations. Although there is still uncertainty with the origin of this haplogroup, according to the suggestions by Oka et al. (Citation2007) haplogroup E originated in Southeast Asia. Furthermore, the authors stated that this haplogroup was first introduced into the Indian subcontinent before reaching to other regions. Recent study stated that haplogroup E remains by far the commonest in the African continent, likely originated from the Indian subcontinent following a terrestrial route along the Nile River Basin and/or through the coastal areas of the Horn of Africa (Al-Jumaili et al. Citation2020). Liu et al. (Citation2006) proposed that haplogroup B and C originated from Yunan province and/or surrounding areas and their biological history seems to be closely related (Mwacharo et al. Citation2011). Muchadeyi et al. (Citation2008) highlighted the relationship of both haplogroup B and C with commercial egg layers (brown and white) and commercial broilers including chicken from the Northwest Europe respectively. The presence of these haplotypes accompanied with its lack of diversity could be revealing the recent genetic introgression of local populations with commercial genotypes. The predominance of haplogroup D has been reported in Africa and in South African regions in particular (Muchadeyi et al. Citation2008; Razafindraibe et al. Citation2008; Mtileni et al. Citation2011b). Liu et al. (Citation2006) reported that this haplogroup was common in jungle fowl and gamecocks from Indonesia, India and Japan.
Conclusions
Our results highlighted noticeable genetic variability within and between KwaZulu-Natal local chickens. Microsatellites revealed clear substructuring between studied local populations, substantiating their local adaptation to respective agro-ecological zones. Ecotypes genetic introgression by the studied exotic breed is still minimum and unnoticeable thus should be further eluded. Mitochondrial DNA sequences highlighted that South African chickens can be assigned to five haplogroups with multiple potential maternal linages. Moreover, a possible recent genetic introgression of local chickens with commercial genotypes is highlighted by mtDNA; thus, there is a need for sustainable breeding and conservation programs to control possible genetic dilution. These results can improve knowledge on structure of indigenous chicken populations. This information will contribute to breeders’ organisations constitution and can be included in the FAO DAD-IS database. Moreover, these findings can enhance the local breeds productivity in order to obtain high quality products for the consumers.
Author contributions
Conceptualisation. S.C., H.L., E.L., and N.K.; Methodology. N.N., S.C., and I.C.; Software S.C. and I.C.; Validation S.C., H.L., E.L., and N.K.; Formal analysis S.C. and I.C.; Investigation. N.N., and S.C.; Resources: H.L., E.L., and N.K.; Data curation N.N.; Writing—original draft preparation N.N.; Writing—review and editing. S.C., H.L., E.L., and N.K.; Supervision E.L., and N.K; Project administration E.L., and N.K; Funding acquisition E.L., and N.K.
Supplemental Material
Download MS Word (4 MB)Supplemental Material
Download TIFF Image (667.6 KB)Supplemental Material
Download TIFF Image (230.1 KB)Acknowledgments
The authors thank the three anonymous referees for their valuable comments to the manuscript and their constructive suggestions.
Disclosure statement
The authors have declared that no competing interests exist.
Additional information
Funding
Related Research Data
References
- Abebe AS, Mikko S, Johansson AM. 2015. Genetic diversity of five local Swedish chicken breeds detected by microsatellite markers. PLoS One. 10:e0120580.
- Al-Jumaili AS, Boudali SF, Kebede A, Al-Bayatti SA, Essa AA, Ahbara A, Aljumaah RS, Alatiyat RM, Mwacharo JM, Bjørnstad G, et al. 2020. The maternal origin of indigenous domestic chicken from the Middle East, the north and the horn of Africa. BMC Genet. 21:1–16.
- Barker JSF, editor. 1994. A global protocol for determining genetic distances among domestic livestock breeds. Proceedings of the 5th world congress on genetics applied to livestock production; Guelph, Ontario. Vol. 21. p. 501–508.
- Belkhir K, Borsa P, Chikhi L, Raufaste N, Bonhomme F. 2004. GENETIX 4.05, logiciel sous Windows TM pour la génétique des populations. Montpellier (France): Laboratoire Génome, Populations, Interactions, CNRS UMR 5171, Université de Montpellier II.
- Benatchez L. 2016. On the maintenance of genetic variation and adaptation to environmental change: considerations from population genomics in fishes. J Fish Biol. 89:2519–2556.
- Boivin ND, Fuller DQ. 2009. Shell middens, ships and seeds: exploring coastal subsistence, maritime trade and dispersal of domesticates in and around the ancient Arabian Peninsula. J World Prehist. 22:113–180.
- Ceccobelli S, Di Lorenzo P, Lancioni H, Monteagudo Ibáñez LV, Tejedor MT, Castellini C, Landi V, Martínez Martínez A, Delgado Bermejo JV, Vega Pla JL, et al. 2015. Genetic diversity and phylogeographic structure of sixteen Mediterranean chicken breeds assessed with microsatellites and mitochondrial DNA. Livest Sci. 175:27–36.
- Dana N, Vander Waaij EH, Van Arendonk JA. 2011. Genetic and phenotypic parameter estimates for body weights and egg production in Horro chicken of Ethiopia. Trop Anim Health Prod. 43:21–28.
- De Marchi M, Dalvit C, Targhetta C, Cassandro M. 2006. Assessing genetic diversity in indigenous Veneto chicken breeds using AFLP markers. Anim Genet. 37:101–105.
- Delany ME. 2003. Genetic Diversity and Conservation of Poultry. Poultry genetics, breeding, and biotechnology, Davis (CA): CABI publishing; p. 257–283.
- Di Lorenzo P, Ceccobelli S, Panella F, Attard G, Lasagna E. 2015. The role of mitochondrial DNA to determine the origin of domestic chicken. World Poultry Sci J. 71:311–318.
- Earl DA, vonHoldt BM. 2012. Structure Harvester: a website and program for visualizing STRUCTURE output and implementing the Evanno method. Conservation Genet Resour. 4:359–361.
- Evanno G, Regnaut S, Goudet J. 2005. Detecting the number of clusters of individuals using the software STRUCTURE: a simulation study. Mol Ecol. 14:2611–2620.
- Excoffier L, Heidi L. 2006. An integrated software package for population genetics data analysis. Berne (Switzerland): Computational and Molecular Population Genetics Lab (CMPG), Institute of Zoology, University of Berne.
- FAO. 2007a. Global plan of action for animal genetic resources and the intertaken declaration. Rome (Italy): FAO; [accessed 2020 Jul 10]. http://www.fao.org/3/a-a1404e.pdf
- FAO. 2007b. The state of food and agriculture. Paying farmers for environmental services part 1. Rome (Italy): FAO; [accessed 2020 Jul 10]. http://www.fao.org/3/a1200e/a1200e00.pdf
- FAO. 2009. The state of food and agriculture, livestock in the balance. Rome (Italy): FAO; [accessed 2020 Jul 10]. http://www.fao.org/3/a-i0680e.pdf
- FAO. 2012. Phenotypic characterisation of animal genetic resources. Animal Production and Health Guidelines No. 11. Rome (Italy): FAO; [accessed 2020 Jul 10]. http://www.fao.org/3/i2686e/i2686e00.pdf
- Fathi MM, Al-Homidan I, Motawei MI, Abou-Emera OK, El-Zarei MF. 2017. Evaluation of genetic diversity of Saudi native chicken populations using microsatellite markers. Poult Sci. 96:530–536.
- Felsenstein J. 2005. PHYLIP (Phylogeny Inference Package) version 3.6. Distributed by the author. Seattle (WA): Department of Genome Sciences, University of Washington. http://evolutiongenetics.washingtonedu/phylip/getme.html
- Fratini S, Schubart CD, Ragionieri L. 2011. Population genetics in the rocky shore crab Pachygrapsus marmoratus from the western Mediterranean and eastern Atlantic: complementary results from mtDNA and microsatellites at different geographic scales. In: Schubart CD, Held C, Koenemann S, editors. Phylogeography and population genetics in Crustacean. Boca rato (FL): CRC Press; p.191–213.
- Groeneveld LF, Lenstra JA, Eding H, Toro MA, Scherf B, Pilling D, Negrini R, Finlay EK, Jianlin H, Groeneveld E, et al. 2010. Genetic diversity in farm animals–a review. Anim Genet. 41:6–31.
- Halima HFWC, Neser FWC, Van Marle-Koster E, De Kock A. 2007. Village-based indigenous chicken production system in north-west Ethiopia. Trop Anim Health Prod. 39:189–197.
- Herrera MB, Thomson VA, Wadley JJ, Piper PJ, Sulandari S, Dharmayanthi AB, Kraitsek S, Gongora J, Austin JJ. 2017. East African origins for Madagascan chickens as indicated by mitochondrial DNA. R Soc Open Sci. 4:160787.
- Hrnčár C, Biesiada-Drzazga B, Nikolova N, Hanusová E, Hanus A, Bujko J. 2016. Comparative analysis of the external and internal egg quality in different pure chicken breeds. Acta Fytotechn Zootechny. 19:123–127.
- ISAG/FAO. 2004. Standing Committee. Secondary guidelines for development of national farm animal genetic resources management plans. Measurement of domestic animal diversity (MoDAD): recommended microsatellite markers. Rome (Italy): ISAG/FAO; [accessed 2020 Jul 10]. http://www.fao.org/3/a-aq569e.pdf
- Jombart T. 2008. adegenet: a R package for the multivariate analysis of genetic markers. Bioinformatics. 24:1403–1405.
- Kalinowski S. 2004. Counting alleles with rarefaction: private alleles and hierarchical sampling designs. Conserv Genet. 5:539–543.
- Kalinowski ST. 2005. HP–RARE 1.0: a computer program for performing rarefaction on measures of allelic richness. Mol Ecol Notes. 5:187–189.
- Khobondo JO, Muasya TK, Miyumo S, Okeno TO, Wasike CB, Mwakubambanya R, Kingori AM, Kahi AK. 2015. Genetic and nutrition development of indigenous chicken in Africa. Livestock Res Rural Dev. 27:122.
- Köhler-Rollefson I. 2004. Farm animal genetic resources: safeguading national asses for food security and trade. Eschborn (Germany): GTZ, FAO, CTA.
- Lasagna E, Ceccobelli S, Cardinali I, Perini F, Bhadra U, Thangaraj K, Dababani RC, Rai N, Sarti FM, Lancioni H, et al. 2020. Mitochondrial diversity of Yoruba and Fulani chickens: a biodiversity reservoir in Nigeria. Poult Sci. 99:2852–2860.
- Lewis P, Zaykin D. 1999. Genetic data analysis. Computer program for the analysis of allelic data. Version 1.0. Storrs (CT): Lewis Labs, University of Connecticut.
- Librado P, Rozas J. 2009. DnaSP v5: a software for comprehensive analysis of DNA polymorphism data. Bioinformatics. 25:1451–1452.
- Liu R, Jin L, Long K, Tang Q, Ma J, Wang X, Zhu L, Jiang A, Tang G, Jiang Y, et al. 2018. Analysis of mitochondrial DNA sequence and copy number variation across five high-altitude species and their low-altitude relatives. Mitochondrial DNA B Resour. 3:847–851.
- Liu YP, Wu GS, Yao YG, Miao YW, Luikart G, Baig M, Beja-Pereira A, Ding ZL, Palanichamy MG, Ya-Ping Zhang YP. 2006. Multiple maternal origins of chickens: out of the Asian jungles. Mol Phylogenet Evol. 38:12–19.
- Lyimo CM, Weigend A, Msoffe PL, Eding H, Simianer H, Weigend S. 2014. Global diversity and genetic contributions of chicken populations from African, Asian and European regions. Anim Genet. 45:836–848.
- Mahammi FZ, Gaouar SBS, Laloë D, Faugeras R, Tabet‐Aoul N, Rognon X, Tixier‐Boichard M, Saidi‐Mehtar N. 2016. A molecular analysis of the patterns of genetic diversity in local chickens from western Algeria in comparison with commercial lines and wild jungle fowls. J Anim Breed Genet. 133:59–70.
- Miao YW, Peng MS, Wu GS, Ouyang YN, Yang ZY, Yu N, Liang JP, Pianchou G, Beja-Pereira A, Mitra B, et al. 2013. Chicken domestication: an updated perspective based on mitochondrial genomes. Heredity (Edinb). 110:277–282.
- Mtileni BJ, Muchadeyi FC, Maiwashe A, Chimonyo M, Groeneveld E, Weigend S, Dzama K. 2011b. Diversity and origin of South African chickens. Poult Sci. 90:2189–2194.
- Mtileni BJ, Muchadeyi FC, Maiwashe A, Groeneveld E, Groeneveld LF, Dzama K, Weigend S. 2011a. Genetic diversity and conservation of South African indigenous chicken populations. J Anim Breed Genet. 128:209–218.
- Muchadeyi FC, Eding H, Simianer H, Wollny CBA, Groeneveld E, Weigend S. 2008. Mitochondrial DNA D-loop sequences suggest a Southeast Asian and Indian origin of Zimbabwean village chickens . Anim Genet. 39:615–622.
- Muchadeyi FC, Eding H, Wollny CBA, Groeneveld E, Makuza SM, Shamseldin R, Simianer H, Weigend S. 2007. Absence of population substructuring in Zimbabwe chicken ecotypes inferred using microsatellite analysis. Anim Genet. 38:332–339.
- Mwacharo JM, Bjørnstad G, Mobegi V, Nomura K, Hanada H, Amano T, Jianlin H, Hanotte O. 2011. Mitochondrial DNA reveals multiple introductions of domestic chicken in East Africa. Mol Phylogenet Evol. 58:374–382.
- Oka T, Ino Y, Nomura K, Kawashima S, Kuwayama T, Hanada H, Amano T, Takada M, Takahata N, Hayashi Y, et al. 2007. Analysis of mtDNA sequences shows Japanese native chickens have multiple origins. Anim Genet. 38:287–293.
- Özdemir D, Cassandro M. 2018. Assessment of the population structure and genetic diversity of Denizli chicken subpopulations using SSR markers. Ital J Anim Sci. 17:312–320.
- Page RD. 1996. TreeView: an application to display phylogenetic trees on personal computers. Comput Appl Biosci. 12:357–358.
- Park S. 2001. Trypanotolerance in West African cattle and the population genetic effects on selection [dissertation]. University of Dublin.
- Pritchard JK, Stephens M, Donnelly P. 2000. Inference of population structure using multilocus genotype data. Genetics. 155:945–959.
- Raymond M, Rousset F. 1995. An exact test for population differentiation. Evolution. 49:1280–1283.
- Razafindraibe H, Mobegi VA, Ommeh SC, Rakotondravao ML, Bjørnstad G, Hanotte O, Jianlin H. 2008. Mitochondrial DNA origin of indigenous malagasy chicken. Ann N Y Acad Sci. 1149:77–79.
- Reardon T, Stamoulis K, Balisacan A, Cruz ME, Berdegue J, Banks B. 1998. Rural nonfarm income in developing countries. Special Chapter in the State of Food and Agriculture. Rome (Itay): Food and Agricultural Organization of the United Nations; p. 283–356.
- Reynolds J, Weir BS, Cockerham CC. 1983. Estimation of the coancestry coefficient: basis for a short-term genetic distance. Genetics. 105:767–779.
- Rice WR. 1989. Analyzing tables of statistical tests. Evolution. 43:223–225.
- Rosenberg NA. 2004. DISTRUCT: a program for the graphical display of population structure. Mol Ecol Notes. 4:137–138.
- Selepe MM, Ceccobelli S, Lasagna E, Kunene NW. 2018. Genetic structure of South African Nguni (Zulu) sheep populations reveals admixture with exotic breeds. PloS One. 13:e0196276.
- Strillacci MG, Cozzi MC, Gorla E, Mosca F, Schiavini F, Román-Ponce SI, Ruiz López FJ, Schiavone A, Marzoni M, Cerolini S, et al. 2017. Genomic and genetic variability of six chicken populations using single nucleotide polymorphism and copy number variants as markers. Animal. 11:737–745.
- Sumreddee P, Toghiani S, Hay EH, Roberts A, Agrrey SE, Rekaya R. 2019. Inbreeding depression in line 1 Hereford cattle population using pedigree and genomic information. J Anim Sci. 97:1–18.
- Van Marle-Köster E, Hefer CA, Nel LH, Groenen MAM. 2008. Genetic diversity and population structure of locally adapted South African chicken lines: implications for conservation. S Afr J Anim Sci. 38:271–281.
- Van Oosterhout C, Hutchinson WF, Wills DPM, Shipley P. 2004. MICRO-CHECKER: software for identifying and correcting genotyping errors in microsatellite data. Mol Ecol Notes. 4:535–538.
- Vilakazi B. 2018. Characterization of production systems and phenotypic traits of indigenous chickens in communal areas of KwaZulu-Natal [master’s thesis]. South Africa: University of Zululand.
- Weimann C, Eltayeb NM, Brandt H, Yousif IS, Abdel Hamid MM, Erhardt G. 2016. Genetic diversity of domesticated and wild Sudanese guinea fowl (Numida meleagris) based on microsatellite markers. Arch Anim Breed. 59:59–64.
- Weir BS, Cockerham CC. 1984. Estimating F-statistics for the analysis of population structure. Evolution. 38:1358–1370.
- Wimmers K, Ponsuksili S, Hardge T, Valle‐Zarate A, Mathur PK, Horst P. 2000. Genetic distinctness of African, Asian and South American local chickens. Anim Genet. 31:159–165.
- Zhang L, Zhang P, Li Q, Gaur U, Liu Y, Zhu Q, Zhao X, Wang Y, Yin H, Hu Y, et al. 2017. Genetic evidence from mitochondrial DNA corroborates the origin of Tibetan chickens. PLoS One. 12:e0172945