
Abstract
This study assessed the effects of three tannin-based feed additives on the productive performance, foot-pad conditions, plasma metabolome, and caecal microbiota of meat-type chickens. A total of 2,340 male broilers were divided into 4 treatments (9 replicates each) fed either a commercial basal diet (CON) or the basal diet supplemented with one of the three tested products (A, B, or C) up to 49 days. According to manufacturers’ instructions, product A was added to the basal diet at 0.3% from 0 to 49 d, while B and C at 0.13% from 0 to 21 d and 0.12% from 22 to 49 d. Compared to CON, tannin-supplemented birds consumed less feed (6.59 vs. 6.37, 6.49, and 6.35 kg, for CON vs. A, B, and C, respectively; p < .001) and reached a lower slaughter weight (3,599 vs. 3,494, 3,546, and 3,472 g, for CON vs. A, B, and C, respectively; p < .05). Feed conversion ratio (FCR) was not affected by the tannin supplementations, except for the starter phase when CON exhibited lower FCR than the other groups (p < .01). The observed differences in the plasma metabolome between CON and treated groups might indicate an impaired energy metabolism of tannin-supplemented chickens. The significant reduction in the caecal microbial diversity and short-chain fatty acid producer bacteria can also be related to the depressed performance of tannin-fed chickens. In contrast to earlier findings, pododermatitis was unaffected by our treatments. Further dose-response studies can help better exploit tannin-based additives in broiler diets.
Highlights
Two tannin-based feed additives out of the three tested in this study significantly reduced feed intake and body weight gain of broiler chickens.
The tannin-produced shifts in the plasma metabolome and caecal microbiota may have been two reasons for the productive performance depression.
Further dose-response trials can help the poultry industry to better elucidate the role of tannins as feed supplements for broiler chickens.
Introduction
The poultry industry has been endeavouring to handle the withdrawal of antibiotics used for growth promotion purposes (AGPs). Facing this challenge has become imperative for the European poultry companies as the European Union total ban of AGPs has been in force since 1 January 2006 (Reg. 2003/1831/EC). In this context, gut-health-oriented formulations represent a valuable tool for poultry producers. Besides the critical importance of feedstuff quality, feed processing, and nutritional value of diets (Choct Citation2009; Adedokun and Olojede Citation2019), the adoption of AGP alternatives is a practical strategy to bolster poultry performance and health by supporting the gastrointestinal (GI) ecosystem and functionality (Gadde et al. Citation2017). Among the vast array of feed additives, tannin-containing products have been arousing the attention of poultry nutritionists (Redondo et al. Citation2014).
Tannins are polyphenolic substances naturally present in a huge variety of terrestrial and sea plants. The simplest categorisation of such phytochemicals is into three classes: hydrolysable tannins (HT, terrestrial origin), condensed tannins, also known as proanthocyanidins (CT, terrestrial origin), and phlorotannins (PT, principally synthetised by brown macroalgae) (Huang et al. Citation2018; Guedes et al. Citation2019). Thousands of tannins have been identified so far, and their chemical structure varies according to the source (Xuan Cuong et al. Citation2019). Indeed, a specific chemical makeup characterises each of the above-mentioned classes (Huang et al. Citation2018). HT have a polyol core of D-glucose esterified with gallic acid (among other phenolic acids), whereas CT are made up of flavonoid monomers and PT are phloroglucinol polymers. In plants, tannins fulfil vital activities by participating in the cell structure and providing defence against harmful exogenous factors (e.g., pathogenic agents, insects, ingestion by animals) (Xuan Cuong et al. Citation2019). From a nutritional standpoint, tannins are commonly considered as protein-precipitants (Aura Citation2008; Huang et al. Citation2018) causing astringency, inhibition of enzyme activity, and an overall worsening of the digestive processes, with particular regard to the dietary protein fraction. Detrimental effects on the productive performance and animal health have been attributed to tannins, leading to brand them as anti-nutritional factors, particularly for monogastric farm animals (Jansman Citation1993; Mueller-Harvey Citation2006; Redondo et al. Citation2014; Huang et al. Citation2018). Nonetheless, over the last years, a growing body of research has been questioning the negative value of tannins for simple-stomached livestock. The animal physiological state, diet composition, type and concentration of tannins in the feed are factors that must be taken into consideration when evaluating the impacts of such compounds on animal growth and health (Huang et al. Citation2018).
Interestingly, tannins have been shown to have a broad spectrum of beneficial biological effects. Steiner (Citation1989) revealed that tannins have antibacterial and antiviral properties, which have subsequently been reviewed by Chung et al. (Citation1998) and Redondo et al. (Citation2014). Mounting evidence of valuable effects (e.g., cardioprotective, anti-inflammatory, anticarcinogenic, antioxidant and radical scavenging attributes) has been reported in human medicine (Chung et al. Citation1998; Redondo et al. Citation2014). These findings have supported the need for a re-evaluation of tannins in the animal nutrition field. A considerable amount of papers dealing with the inclusion of tannins in the feeding programs of broiler chickens has recently been published (Redondo et al. Citation2014; Huang et al. Citation2018). The beneficial modulation of the GI microbiota has been recognised as one of the most important effects of dietary tannins (Redondo et al. Citation2014). For instance, Singleton (Citation1981) declared that tannins suppress the growth of undesirable GI bacteria. In this regard, Tosi et al. (Citation2013) observed that chestnut tannins can hinder Clostridium perfringens colonisation of the chicken intestine, thereby alleviating the severity of necrotic enteritis lesions. However, the mechanisms behind the effects of these polyphenolic compounds on the growth performance and health of monogastric species remain fairly unclear (Huang et al. Citation2018). We hypothesised that a multidisciplinary approach combining animal performance evaluation and molecular analyses, assessing the systemic and intestinal biological effects of dietary tannins, may help to elucidate their mode of action. Therefore, this study sought to evaluate the impacts of three different tannin-based feed additives – already employed in commercial practices – on the productive performance and foot-pad conditions of meat-type chickens. We also attempted to interpret the performance data in light of the plasma metabolome and caecal microbiota composition.
Materials and methods
Animal husbandry and experimental diets
A total of 2,340 one-day-old male Ross 308 chicks, obtained from the same breeder flock and hatching session, were used. At the hatchery, the chicks were vaccinated against infectious bronchitis virus, Marek’s disease virus, Newcastle and Gumboro diseases, and coccidiosis. The birds were placed in an experimental poultry house and randomly divided into 4 groups (9 replicates/group; 65 birds/replicate) according to the dietary treatment. CON group was fed a commercial corn-wheat-soybean basal diet following a 4-phase feeding program (Table ). Treated groups received the same basal diet as CON, yet supplemented with the corresponding tannin-based product (i.e., A, B, or C) at the inclusion levels recommended by each of the three different manufacturers: 0.3% throughout the rearing cycle (A) or 0.13% in the starter and grower-I feeds and 0.12% in the grower-II and finisher feeds (B and C). The feed was provided in mash form and the birds were fed and watered ad libitum.
Table 1. Basal diet composition according to the feeding phase.
The replicates were distributed in 36 pens (5.9 m2/pen) arranged in randomised blocks to limit possible environmental effects. The concrete floor was covered with chopped straw (3-4 kg/m2) as bedding material. The pens were provided with two pan feeders (2 cm of front space/bird) and an independent drinking system (1 nipple/5 birds). An artificial photoperiod of 23 L:1D was employed during the first 7 and last 3 days of the trial, whereas 18 L:6D was used for the remaining time. The environmental temperature was settled according to the flock age, following the breeding company instructions. The animals were handled, raised, and processed in compliance with the European legislation (Dir. 2007/43/EC; Reg. 2009/1099/EC; Dir. 2010/63/EU). Twice a day, the general flock conditions, temperature, lighting, water, feed, litter, and mortality were monitored. The trial lasted 49 d when broilers were processed in a commercial slaughterhouse.
Analysis of the tannin-based feed additives
The tannic and polyphenolic composition of the three supplements was determined by means of HPLC-MS analysis using LCMS-2020 (Shimadzu, Kyoto, Japan) equipped with a MS and a DAD detector. A C18 GEMINI column 5 μL particle size, 250 × 4.6 mm (Phenomenex, Torrance, CA, USA) was used. Briefly, the samples were solubilised in HPLC grade water and filtered through PTFE 0.2 µm. A mobile phase composed by formic acid 10 mM (solvent A) and methanol (solvent B) was used. The following gradient elution was applied: from 0 to 2 min, 5% B; from 2 to 10 min, 5–15% B; from 10 to 15 min, 15–25% B; from 15 to 20 min, 25–30% B; from 20 to 60 min, 30–80% B; from 60 to 70 min, 80–85% B; from 70 to 75 min, 85–5% B, followed by a re-equilibration of the column for 5 min to the initial conditions. The flowrate was 0.8 mL/min. The injection volumes were 10.0 μL. MS analyses were performed using an electrospray (ESI) interface operating both in positive and in negative mode. The following conditions of ESI interface were used: drying gas flow, 10 mL/min; nebulising gas flow, 1.5 L/min; gas drying temperature, 350 °C.
Performance and foot-pad lesion measurements
The broilers were weighed on a pen basis at housing (0 d), at each diet switch (10, 21, and 30 d), and at slaughter (49 d), whereas mortality was recorded daily. Body weight (BW), daily weight gain (DWG), daily feed intake (DFI), feed intake (FI), and feed conversion ratio (FCR) were calculated accordingly.
At processing in a commercial plant, the experimental groups were clearly identified and separately kept. Incidence and severity of foot-pad dermatitis (FPD) were macroscopically assessed on all the birds (1 foot/bird) by means of a 3-point scale: score 0, no lesion; score 1, mild lesions (≤ 0.8 cm); score 2, severe lesions (> 0.8 cm) (Ekstrand et al. Citation1998).
Sampling of plasma and caecal contents
At slaughter, the blood and caecal content were retrieved from 9 birds/group (i.e., 1 bird/replicate), selected according to a similar body weight. Blood samples were collected from the wing vein as previously described (Zampiga et al. Citation2018). Briefly, the blood was collected into 4 mL lithium-heparin vials and centrifuged (4,000 × g for 15 min at 4 °C) to obtain the plasma that was subsequently transferred into 1.5 mL vials and stored at -80 °C until metabolomics analysis. From the same chickens, the GI tract was dissected out and the content of both caeca was collected into 15 mL sterile plastic tube. The caecal content was stored at -80 °C until DNA extraction.
Metabolomic analysis
Following Zhu et al. (Citation2020), the plasma samples were prepared for proton nuclear magnetic resonance (1H-NMR) analysis by centrifuging 1 mL of each sample for 15 min at 18,630 g and 4 °C. A total of 700 μL of supernatant were added to 100 μL of a D2O solution of 2,2,3,3-D4-3-(trimethylsilyl)-propionic acid sodium salt (TSP) 10 mM, used as NMR chemical-shift reference, buffered at pH 7.00 ± 0.02 by means of 1 M phosphate buffer. 10 μL of NaN3 (2 mmol/L) was also added to avoid microbial proliferation. Finally, the sample was centrifuged again at the above conditions.
1H-NMR spectra were recorded at 298 K with an AVANCE™ III spectrometer (Bruker, Milan, Italy) operating at a frequency of 600.13 MHz. Following Zhu et al. (Citation2019), signals from broad resonances originating from large molecules were suppressed by a CPMG-filter composed by 400 echoes with a τ of 400 μs and a 180° pulse of 24 μs, for a total filter of 330 ms. The water residual signal was suppressed by means of presaturation. This was done by employing the cpmgpr1d sequence, part of the standard pulse sequence library. Each spectrum was acquired by summing up 256 transients using 32,000 data points over a 7184 Hz spectral window, with an acquisition time of 2.28 s. According to Zhu et al. (Citation2018), the recycle delay was set to 5 s. 1H-NMR spectra were baseline-adjusted by means of the peak detection according to the ‘rolling ball’ principle (Kneen and Annegarn Citation1996) implemented in the baseline R (R Core Team Citation2020). To make points pertaining to the baseline randomly spread around zero, a linear correction was then applied to each spectrum. Differences in water content among samples were taken into consideration by probabilistic quotient normalisation (PQN) (Dieterle et al. Citation2006) applied to the entire spectra array. Signals were assigned by comparing their chemical shift and multiplicity with Chenomx software library (Chenomx Inc., Edmonton, Canada, ver. 10). Integration of the signals was performed for each molecule by means of rectangular integration.
DNA extraction and sequencing of the caecal samples
The DNA was extracted from each caecal sample using a bead-beating procedure, as described by De Cesare et al. (Citation2017). Briefly, 0.25 g of caecal content were suspended in 1 mL lysis buffer (500 mM NaCl, 50 mM Tris-Cl, pH 8.0, 50 mM EDTA, 4% SDS) with MagNA Lyser Green Beads (Roche, Milan, Italy) and homogenised on the MagNA Lyser (Roche, Milan, Italy) for 25 sec at 6.500 xg. Samples were then heated at 70 °C for 15 min, followed by centrifugation to separate the DNA from bacterial cellular debris. This process was repeated with a second 300 μl aliquot of lysis buffer. Samples were then subjected to 10 M v/v ammonium acetate (Sigma, Milan, Italy) precipitation, followed by isopropanol (Sigma, Milan, Italy) precipitation, 70% ethanol (Carlo Erba, Milan, Italy) washing and suspension in 100 uL 1X Tris-EDTA (Sigma, Milan, Italy). All samples were treated with DNase-free RNase (Roche, Milan, Italy) and incubated overnight at 4 °C, before being processed through the QIAmp® DNA Stool Mini Kit (Qiagen, Milan, Italy) according to manufacturer’s directions with some modifications. Lastly, DNA quantity and quality were assessed on a BioSpectrometer® (Eppendorf, Milan, Italy). Libraries were prepared following the 16S Metagenomic Sequencing Library Preparation protocol (Illumina, San Diego, CA), amplifying V3 and V4 hypervariable regions of the 16S rRNA gene in order to obtain a single amplicon of approximately 460 bp. Sequencing was performed in paired-end employing MiSeq System (Illumina, San Diego, CA) with MiSeq Reagent kit v2 500 cycles (Illumina, San Diego, CA), characterised by a maximum output of 8.5 Gb.
Statistical analysis of the performance data and FPD
Before performing statistics on the performance data, the mortality percentages were subjected to arcsine transformation. An ANOVA model was adopted to compare the means of the four groups, considering the dietary treatment as a factor and the replicate (i.e., each pen) as the experimental unit. Due to the remarkable differences in the chemical profile, as discussed below, and in the abovementioned inclusion levels, we did not carry out multiple comparisons between the three tannin-supplemented groups. However, the effect of supplementing the commercial basal diet – chosen as the reference – with the tannin-based feed additives was evaluated by computing the following orthogonal contrasts: CON vs. A, B, and C; CON vs. each tannin-supplemented group (i.e., CON vs. A, CON vs. B, and CON vs. C). FPD occurrence and severity were statistically evaluated by means of Pearson’s Chi-square test involving all the groups and using the individual animal as the experimental unit. The foregoing analyses were performed using stats (R Core Team Citation2020) and lsmeans (Lenth Citation2016) packages of R environment (R Core Team Citation2020). The significance level was set at .05.
Statistical analysis of the plasma metabolome
Statistical analysis of the plasma metabolome was conducted in R (R Core Team Citation2020). Prior to univariate analysis, the concentrations of molecules were transformed to normality by Box and Cox (Citation1964) transformation. Molecules differently concentrated between CON and the supplemented groups were investigated through one-way ANOVA, considering the dietary treatment as a factor and the individual sampled animal as the experimental unit. Later, t-test comparisons between CON and each tannin-supplemented group were carried out. To obtain an overview of the trends underlying the metabolome of the samples, robust principal component analysis (rPCA) models (Hubert et al. Citation2005) were setup on the molecules accepted by the above described univariate analyses. Each rPCA model was represented by a scoreplot and by a Pearson correlation plot. The former is the projection of the samples in the PC space, tailored to highlight the similarities of the samples. The latter highlights the relationships between the concentration of each molecule and the components of the model.
Bioinformatic analysis of the caecal microbiota
One caecal sample belonging to group A was omitted from the bioinformatic analysis because of a sequencing problem. A total of 2,355,661 reads were attributed to 1,863 amplicon sequence variants (ASVs) distributed among samples (Table SM_1). The relative rarefaction curves (Figure SM_1) show that all the samples tend to the plateau, thereby suggesting that the sequencing depth was adequate to describe the variability within the analysed microbial communities. The microbiota analysis was performed in DADA2 pipeline (Callahan et al. Citation2016) and the taxonomic categories were assigned by using Silva Database (release 138) as reference (Quast et al. Citation2013). Alpha (Shannon, Chao1, and InvSimpson indices) and beta diversity (calculated as Bray Curtis distance matrix), as well as the abundance of taxonomic categories, were analysed with PhyloSeq (McMurdie and Holmes Citation2013), Vegan (Dixon Citation2003), and car (Fox and Weisberg Citation2019) packages implemented in R (R Core Team Citation2020). Alpha diversity indices were analysed with an ANOVA model, considering the dietary treatment as a factor and the individual sampled animal as the experimental unit. Then, orthogonal contrasts were carried out as previously described. Beta diversity was analysed with a PERMANOVA model (‘Adonis’ procedure) including the dietary treatment as a factor. The differences in taxonomic abundances at phylum, family, genus, and species level between CON, A, B, and C groups were computed with DESeq2 package (Love et al. Citation2014) of R (R Core Team Citation2020). The analysis was based on negative binomial generalised linear models applying Wald test and Benjamini-Hochberg method for multiple testing correction (Love et al. Citation2014). The significance level was set at .05.
Results
Composition of the tannin-based feed additives
The chemical compounds supplied by the additives – according to their inclusion levels in diets A, B, and C – are given in Table SM_2. It can be underlined that gallic acid is the only molecule shared by all the products, albeit with different relative supplies depending on the phase of the grow-out period. In general, supplement B provides the lowest quantity of gallic acid. The chemical profile of product B considerably differs from those of A and C that, on the contrary, are very similar to each other. Indeed, 9 molecules are simultaneously present in additives A and C though some concentration differences. Castalagin and gallic acid are mainly provided by A, while C supplies larger quantities of the other compounds. For instance, the relative amount of castalin and glucose acid gallic diester is two-time greater in the latter commercial product.
Growth performance and FPD
At housing (0 d), the chicks of the four treatments had a comparable weight (Table ). At the end of the starter phase (10 d), BW and DWG of group C were significantly lower than those of CON (-8.4 and -0.9 g, respectively; p < .05). Conversely, CON and groups A and B showed similar BW and DWG. DFI and FI of the tannin-treated groups did not significantly differ from those of CON. In contrast, FCR significantly changed because of the dietary treatment: tannin-fed groups outnumbered CON by +2.5 to +3.7% (p < .01). Although groups A and C showed a meaningfully higher FCR (p < .05), the feed-to-gain ratio of group B only tended to be higher than that of CON (p = .066). The mortality percentage was not significantly affected by the dietary treatments from the starter phase onwards, excluding the last part of the trial (Table ).
Table 2. Productive performancea according to the feeding phase.
At the end of the grower-I period (21 d), BW, DWG, DFI, and FI of the tannin-supplemented groups were significantly lower than those of CON (p < .05 or p = .001). Birds belonging to group A averagely consumed 0.85 kg of feed and reached BW of 783 g, which were significantly lower than those of CON (0.89 kg and 817.2 g, respectively; p < .05 and p < .01). Comparably, chickens of group C performed worse than those of CON both in terms of BW (-40.9 g; p < .05) and FI (-0.05 kg; p = .001). On the other hand, broilers supplemented with product B consumed a smaller amount of feed than CON (-0.03 kg; p < .05), albeit not reaching a significantly lower BW. The dietary supplementation of the three additives did not significantly modify FCR compared to CON (Table ).
At the end of the second grower stage (30 d), the trends of BW, DWG, DFI, and FI were comparable to those of the previous feeding phase. BW of tannin-fed groups A and C was significantly lower than that of CON (1,553 vs. 1,490, and 1,486 kg, for CON vs. A, and C, respectively; p < .05). Group B consumed the same quantity of feed as CON (1.33 kg), while the other two groups showed a significantly lower FI than CON (-0.03 kg; p < .01). No significant effect of the tannin supplementations was detected for FCR (Table ).
At the conclusion of the grow-out period (49 d), the reduction in slaughter weight caused by supplements A and C was statistically relevant (3,599 vs. 3,494 and 3,472 kg, for CON vs. A and C, respectively; p < .05 and p < .01, respectively), whereas product B did not produce any significant effect. Likewise, groups A and C showed a markedly significant decrease in FI compared to CON (-0.16 kg; p = .001), while supplement B did not significantly affect this parameter. The dietary treatments did not substantially affect FCR (Table ).
Considering the entire fattening cycle (0-49 d), the differences between CON and tannin-fed groups are confirmed. The drop in FI was pronouncedly significant for groups A and C (-0.22 and -0.24 kg, respectively; p < .001). Similarly, the decrease in BW was significant (-105 and -127 g, for A and C, respectively; p < .05 and p < .01, respectively). On the other hand, group B displayed just a tendency to consume less feed than CON (-0.10 kg; p = .069). Lastly, FCR was not significantly modified by the tannin supplementation (Table ).
The dietary treatments did not affect the incidence and severity of FPD (Table ). The absence of foot-pad lesions ranged from 34 to 42%, whereas moderate and severe dermatitis from 49 to 52% and 8 to 16%, respectively. In general, the p-value largely exceeded .05.
Table 3. Incidence and severity of FPD at slaughter (49 d).
Plasma metabolome
To study the treatment-mediated changes in the plasma metabolome, 1H-NMR spectra were registered, and the 46 assigned molecules quantified (Table SM_3). The concentration of 2,3-butanediol, acetone, pyruvate, 2-oxoglutarate, ascorbate, glutamate, acetate, and dimethyl sulphone was significantly affected by the treatments (Table SM_3). These molecules served as a basis for the rPCA model (Figure ). The main principal component (PC 1) of the scoreplot accounts for 55.2% of the variance explained by the model and summarises the differences among the treatments. Samples of group A were characterised by lower PC 1 scores and tend to separately cluster from those of the other groups. It can be noticed that the separation of the two clusters is predominantly driven by dimethyl sulphone, more concentrated in group A, and by 2,3-butanediol, acetone, and pyruvate, more concentrated in the other groups.
Figure 1. rPCA model built on the metabolomic space constituted by the concentration of the molecules showing a significant difference among the dietary treatments (Ctrl = CON, A, B, and C). In the scoreplot (A), samples from the four groups are represented with different geometric shapes. The wide, empty circles represent the median of each group. The position of the samples along PC 1 is summarised in the boxplot (B). The loading plot (C) reports the correlations between the concentration of each metabolite and its importance over PC 1. Grey bars highlight significant correlations (p < .05).
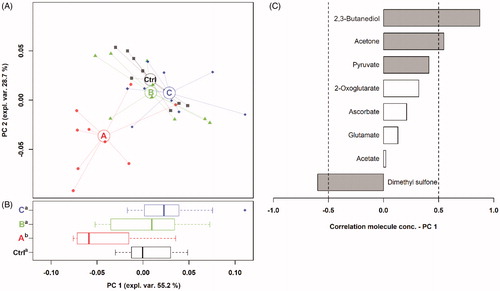
The differences between CON and each tannin-fed group are given in Table SM_3 and Figures SM_2-SM_4. The administration of additive A significantly decreased the concentration of fumarate, 2-oxoglutarate, pyruvate, and uridine, while increased that of choline, serine, threonine, and dimethyl sulphone compared to CON. Likewise, group B had lower 2-oxoglutarate and higher threonine than CON. The supplementation of product C reduced 2-oxoglutarate as well, whereas negatively affected the concentration of ascorbate and mannose and increased serine, dimethyl sulphone, and 2,3-butanediol compared to CON.
Caecal microbiota
The taxonomic assignment allowed to obtain 9 phyla, 16 classes, 56 families, and 116 genera. The most abundant phylum was Firmicutes (59%) followed by Bacteroidota (36%), Actinobacteriota (1.90%), and Cyanobacteria (1.33%). The most abundant families were Rikenellaceae (17.25%), Lachnospiraceae (16.06%), Barnesiellaceae (13.79%), and Ruminococcaceae (13.11%). The most abundant genera were Alistipes (15.80%), Barnesiella (12.93%), Faecalibacterium (7.98%), and Bacteroides (3.46%) (Figure SM_5).
Table shows the microbial diversity indices and the statistical differences between the dietary treatments. Although the dietary treatment did not influence Chao index, the supplementation of additive C tended to decrease such parameter compared to CON (p = .068). Shannon (p = .002) and InvSimpson (p < .001) diversity indices were significantly influenced by the dietary treatment (Table ). Indeed, significantly lower Shannon and InvSimpson indices were observed in group C compared to CON (p < .01), while group A showed a higher InvSimpson index than CON (p < .05). On the other hand, alpha diversity indices of group B were not significantly different compared to those of CON (Table ).
Table 4. Alpha diversity indices and ASV richness in the caecal content of broilers at slaughter (49 d).
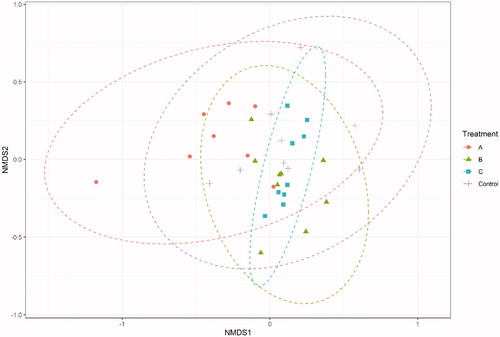
Moving to beta diversity, Adonis test revealed that the microbial composition of the samples was significantly affected by the dietary treatment (p = .001, R2 = 0.137). The homogeneity of dispersion between the groups was not significant, thus the result of Adonis test was not influenced by the different dispersion of microbial composition within the samples. Figure illustrates the non-metric multi-dimensional scaling (NMDS) plot obtained by using the Bray-Curtis distance matrix. Despite the samples belonging to the different dietary treatments are partially overlapping, a more distinct cluster of samples belonging to group C can be noticed.
Figure 2. NMDS plot on Bray-Curtis distances at the ASV level. Control was fed the basal diet, while the other treatments were supplemented with tannin additive A, B, and C, respectively.
The differences in the taxa composition at phylum, family, genus, and species level are given in Table . At phylum level, CON had a lower abundance of Actinobacteriota than A (adj p < .05) and C (adj p < .001) groups, while a higher abundance of Desulfobacterota than group A (adj p < .05) and a lower abundance of Bacteroidota than group C (adj p < .001). On the other hand, no difference was observed between CON and group B. At family level, CON had a higher abundance of Veillonellaceae than the tannin-supplemented groups (adj p < .001), a higher abundance of Selenomonadaceae than treatment A (adj p < .001) and a higher abundance of Peptostreptococcaceae than group C (adj p < .05). At genus level, CON exhibited a higher abundance of Megasphaera than the other groups (adj p < .001). Furthermore, a higher abundance of Megamonas and Bilophila (adj p < .001) and lower abundance of Merdibacter (adj p < .01) was observed in the CON group compared to the group A. Lastly, a higher abundance of GCA-900066575 (Lachnospiraceae) and Romboutsia (adj p < .01 and adj p < .05, respectively) and a concurrent lower abundance of Rikenella and Bifidobacterium (adj p < .01) was detected in CON compared to group C. At species level, CON exhibited a higher abundance of Megasphaera stantonii than the other groups (adj p < .001) and a higher abundance of Barnesiella viscericola compared to group C (adj p < .001).
Table 5. Contrasts between CON and tannin-supplemented groups (A, B, and C) at phylum, family, and genus level.
Discussion
The tannin-treated broilers suffered from a general reduction in feed consumption and weight gain. Remarkably, tannin supplements A and C adversely affected FI and BW in a similar way although their different inclusion levels. On the other hand, group B mainly showed a tendency to perform worse than CON, even though tannin additive B had the same supplementation level as C. Such discrepancies support the concept that not only the dosage in the diet but even the type of tannins has an effect on animal performance (Huang et al. Citation2018). It can be supposed that the higher the supply of castalagin and gallic acid (as for the supplemented diets A and C), the more pronounced the negative impacts on FI and BW of broilers. The reduction in feed intake and weight gain is in line with the results of earlier experiments assessing the administration of tannins to broilers. A decline in FI and BW was reported by two research groups testing different tannin compounds supplemented from 0.5 to 2.5% (Iji et al. Citation2004; Ebrahim et al. Citation2015). Interestingly, our results are similar to those of Ebrahim et al. (Citation2015) who utilised a tannin source containing high levels of gallic acid. On the other hand, Jamroz et al. (Citation2009) did not detect any negative effects of sweet chestnut extracts – which include both gallic acid and castalagin (Campo et al. Citation2016) – supplemented at dosages lower than 0.1%. Dietary tannins may also not reduce poultry performance (Huang et al. Citation2018), while even improvements in broiler growth have been attributed by Schiavone et al. (Citation2008) and Starčević et al. (Citation2015) to chestnut wood extract and tannic acid, respectively. Similar inconsistency can be found in studies involving pigs (Huang et al. Citation2018). These observations suggest that supplementing dietary tannins has controversial outcomes in growing monogastric livestock. It can be surmised that the inclusion levels recommended by the manufacturers of the tannin products tested in this trial are excessive and may have caused palatability alteration and antinutritive consequences, two side effects previously ascribed to tannins (Jansman Citation1993). Such hypothesis is primarily adequate for tannin supplements A and C as they produced the most evident impairments in FI and BW throughout the rearing period.
Our results indicate neither beneficial nor deleterious effects of the tested tannin supplements on foot-pad lesions of broiler chickens. This is not in agreement with earlier studies demonstrating a reduction in FPD of tannin-fed broilers (Sirri et al. Citation2011; Cengiz et al. Citation2017). We previously linked the improvement in foot-pad health to the tannin-mediated decrease in litter moisture (Sirri et al. Citation2011). The stool drying effect (Palombo Citation2006; Redondo et al. Citation2014) might be the key to clarify the indirect positive action of dietary tannins on poultry pododermatitis (Cengiz et al. Citation2017).
To the best of our knowledge, the present research should be unprecedented in dealing with the impacts of tannin-containing additives on the plasma metabolomic profile of chickens. The intestinal uptake of tannins and their subsequent effects on extra-gut organs of farm animals have been investigated (Jansman Citation1993). Nevertheless, only recently the scientific community has become aware of the prevalent fate of dietary tannins along the GI tract, namely their transformation performed by bacteria and endogenous digestive enzymes (Aura Citation2008; Marín et al. Citation2015). Most of the ingested phenolic compounds is modified at the intestinal level in order to become bioactive for the animal (Marín et al. Citation2015). Here, tannin supplement A triggered the biggest variation in the plasma metabolome, thereby possibly causing the greatest systemic effect. In general, the significant reduction in molecules involved in important energy pathways (e.g., fumarate, 2-oxoglutarate, and pyruvate) can be connected to the altered productive performance. The rise in 2,3-butanediol can also be a plausible cause for the performance depression. Indeed, in 1969, Yoshida et al. (as cited in Mathison et al. (Citation1981)) obtained a decrease in broiler performance by adding 2,3-butanediol to the diet. Unfortunately, apart from a recent article authored by Roper et al. (Citation2019), there is a gap in the literature regarding the effect of 2,3-butanediol on poultry. However, as this compound is a typical fermentation end-product of the enteric bacteria (National Center for Biotechnology Information Citation2020), an intriguing connection with the observed microbiota variations can spur future investigations. It can be hypothesised that the tannin-supported increase in serine and threonine occurred to remedy the compromised energy metabolism as they are glucogenic amino acids. Serine and threonine are also important endogenous precursors of glycine (Meléndez-Hevia et al. Citation2009) that, together with serine, is the first-limiting non-essential amino acid for broiler chickens (Ospina-Rojas et al. Citation2012). Besides the protein synthesis, these amino acids enter a wide range of biochemical processes (Siegert and Rodehutscord Citation2019). Thus, the rise in serine and threonine might be beneficial for broiler physiology. The increase in dimethyl sulphone – also known as methyl sulphonyl methane and commonly deriving from the dietary constituents and microbiota metabolism (Engelke et al. Citation2005) – can improve chicken health (Jiao et al. Citation2017; Abdul Rasheed et al. Citation2019) due to its antioxidant and anti-inflammatory effects (Marañón et al. Citation2008). The reduction in ascorbate, which is a renowned antioxidant compound endogenously synthetised by the avian kidney (Grollman and Lehninger Citation1957), can be interpreted as a consequence of the antioxidant and radical scavenging properties of tannins (Chung et al. Citation1998; Redondo et al. Citation2014).
It has been postulated that the GI microbiota benefits from dietary tannins (Redondo et al. Citation2014) with consequent advantages for host health (Van Hul et al. Citation2018). Surprisingly, tannin supplement C significantly reduced the alpha diversity of the caecal microbial community. This outcome is contrary to that of Díaz Carrasco et al. (Citation2018) who observed an increment in Shannon diversity index in response to a tannin dietary treatment. However, this discrepancy can be attributed to the differences in the additive composition, broiler genetic line, and trial duration (i.e., 49 vs. 30 d), as well as to the reutilisation of litter from a previous flock in the experiment conducted by Díaz Carrasco et al. (Citation2018). Such factors considerably affect the chicken GI microbiota (Cressman et al. Citation2020), thereby hindering the comparison between differently designed experiments. The microbial diversity reduction can be regarded as a negative consequence of dietary treatment C as the heterogeneity of the GI microbiota has been associated with its robustness and ability to support the gut health status (Yeoman and White Citation2014; van de Guchte et al. Citation2018). In accordance with previous studies (Díaz Carrasco et al. Citation2018; Tretola et al. Citation2019), a significant effect of dietary treatment C on the beta diversity was observed. This result confirms that tannins can affect the community structure of the chicken intestinal microbiota in a dose- and type-dependent way. We also found some changes in the abundance of certain bacterial taxa. The noteworthy decrease in Megasphera stantonii is shared by all the tannin-fed groups. Megasphera produces butyrate (Paradh Citation2015) that plays a key role in gut health promotion (Vital et al. Citation2017; Milani et al. Citation2017). This also applies to chickens, as it has recently been confirmed by Maki and Looft (Citation2018) who, for the first time, isolated Megasphaera stantonii from the caecal content of healthy chickens. Additionally, group A showed a significant decline in Megamonas that is able to foster the microbial production of short-chain fatty acids (SCFAs) in the chicken intestine (Sergeant et al. Citation2014; Chen et al. Citation2019). Supplement C decreased the abundance of Romboutsia that is also a butyrate-producer (Gerritsen Citation2015) and – in contrast to the findings of Díaz Carrasco et al. (Citation2018) – of a Lachnospiraceae member. Due to its SCFA-production capacity, Lachnospiraceae family, including Clostridia of the cluster XIVa, has been recognised as an essential component of healthy GI ecosystems in chickens (De Maesschalck et al. Citation2015; Stanley et al. Citation2016). The loss of several SCFA producer bacteria – mainly occurred in groups A and C – might be listed among the reasons for the growth performance decrease because these microorganisms have positively been related to broiler performance (Torok et al. Citation2011; Stanley et al. Citation2012). Further studies aimed at assessing the butyrogenic capacity of the caecal bacterial population and the SCFA level in the caecal content of broilers fed tannin-supplemented diets would be desirable to confirm our hypothesis.
Conclusions
The results of this study show that two tannin-based feed additives out of the three tested substantially impinged on feed consumption and growth of broiler chickens. The tested dietary tannins produced shifts in the plasma metabolome, which could be linked to an impaired energy metabolism. They also elicited microbiota-shaping properties, as confirmed by the reduction in the caecal microbial diversity and inhibition of some SCFA-producing caecal bacteria, which may have been additional reasons for the productive performance depression. Contrary to previous findings, no significant impact of dietary tannins on foot-pad lesions was detected, at least at the dosages used herein. Further standardised dose-response experiments could be the way forward to help the feed additive industry to supply optimised tannin-based products and provide appropriate recommendations regarding their inclusion levels in broiler chicken diets.
Ethical approval
This experiment was approved by the Ethical Committee of the University of Bologna (ID: 933/2018).
Supplemental Material
Download MS Word (1 MB)Acknowledgements
The authors acknowledge Stefano Pignata and Roberto Donatini (Dipartimento di Scienze e Tecnologie Agro-Alimentari, Alma Mater Studiorum - University of Bologna) for their technical support.
Disclosure statement
The authors declare that there is no conflict of interest.
Data availability statement
All data produced and analysed in the study have been included in this paper and its supplemental materials. The microbiota data set is available on Sequence Read Archive (SRA) with BioProject ID PRJNA658526.
Additional information
Funding
References
- Abdul Rasheed MS, Oelschlager ML, Smith BN, Bauer LL, Whelan RA, Dilger RN. 2019. Toxicity and tissue distribution of methylsulfonylmethane following oral gavage in broilers. Poult Sci. 98(10):4972–4981.
- Adedokun SA, Olojede OC. 2019. Optimizing gastrointestinal integrity in poultry: the role of nutrients and feed additives. Front Vet Sci. 5:348.doi: 10.3389/fvets.2018.00348.
- Aura A-M. 2008. Microbial metabolism of dietary phenolic compounds in the colon. Phytochem Rev. 7(3):407–429.
- Box GEP, Cox DR. 1964. An analysis of transformations. J R Stat Soc Ser B. 26(2):211–243.
- Callahan BJ, McMurdie PJ, Rosen MJ, Han AW, Johnson AJA, Holmes SP. 2016. DADA2: High-resolution sample inference from Illumina amplicon data. Nat Methods. 13(7):581–583.
- Campo M, Pinelli P, Romani A. 2016. Hydrolyzable tannins from sweet chestnut fractions obtained by a sustainable and eco-friendly industrial process. Nat Prod Commun. 11(3):409–415.
- Cengiz Ö, Köksal BH, Tatlı O, Sevim Ö, Ahsan U, Bilgili SF, Gökhan Önol A. 2017. Effect of dietary tannic acid supplementation in corn- or barley-based diets on growth performance, intestinal viscosity, litter quality, and incidence and severity of footpad dermatitis in broiler chickens. Livest Sci. 202:52–57.
- Chen Y, Ni J, Li H. 2019. Effect of green tea and mulberry leaf powders on the gut microbiota of chicken. BMC Vet Res. 15(1):77.
- Choct M. 2009. Managing gut health through nutrition. Br Poult Sci. 50(1):9–15.
- Chung K-T, Yee Wong T, Wei C-I, Huang Y-W, Lin Y, Chung T, Johnson MG. 1998. Tannins and Human Health: a review. Crit Rev Food Sci Nutr. 38(6):421–464.
- Cressman MD, Kers JG, Wang L, Yu Z. 2020. Genetics and other factors affecting intestinal microbiota and function in poultry. In: Ricke SC, editor. Improv gut Heal Poult. Sawston, Cambridge, UK: Burleigh Dodds Science Publishing; p. 165–188.
- De Cesare A, Sirri F, Manfreda G, Moniaci P, Giardini A, Zampiga M, Meluzzi A. 2017. Effect of dietary supplementation with Lactobacillus acidophilus D2/CSL (CECT 4529) on caecum microbioma and productive performance in broiler chickens. PLoS One. 12(5):e0176309.
- De Maesschalck C, Eeckhaut V, Maertens L, De Lange L, Marchal L, Nezer C, De Baere S, Croubels S, Daube G, Dewulf J, et al. 2015. Effects of Xylo-oligosaccharides on broiler chicken performance and microbiota. Griffiths MW, editor. Appl Environ Microbiol. 81(17):5880–5888.
- Díaz Carrasco JM, Redondo EA, Pin Viso ND, Redondo LM, Farber MD, Fernández Miyakawa ME. 2018. Fernández miyakawa ME. 2018. Tannins and bacitracin differentially modulate gut microbiota of broiler chickens. Biomed Res Int. 2018:1879168–1879111.
- Dieterle F, Ross A, Schlotterbeck G, Senn H. 2006. Probabilistic quotient normalization as robust method to account for dilution of complex biological mixtures. Application in 1H NMR metabonomics. Anal Chem. 78(13):4281–4290.
- Dixon P. 2003. VEGAN, a package of R functions for community ecology. J Veg Sci. 14(6):927–930.
- Ebrahim R, Liang JB, Jahromi MF, Shokryazdan P, Ebrahimi M, Li Chen W, Goh YM. 2015. Effects of tannic acid on performance and fatty acid composition of breast muscle in broiler chickens under heat stress. Ital J Anim Sci. 14(4):3956.
- Ekstrand C, Carpenter TE, Andersson I, Algers B. 1998. Prevalence and control of foot-pad dermatitis in broilers in Sweden. Br Poult Sci. 39(3):318–324.
- Engelke UFH, Tangerman A, Willemsen MAAP, Moskau D, Loss S, Mudd SH, Wevers RA. 2005. Dimethyl sulfone in human cerebrospinal fluid and blood plasma confirmed by one-dimensional (1)H and two-dimensional (1)H-(13)C NMR . NMR Biomed. 18(5):331–336.
- Fox J, Weisberg S. 2019. An R Companion to Applied Regression. 3rd ed. Thousand Oaks, CA: Sage.
- Gadde U, Kim WH, Oh ST, Lillehoj HS. 2017. Alternatives to antibiotics for maximizing growth performance and feed efficiency in poultry: a review. Anim Health Res Rev. 18(1):26–45.
- Gerritsen J. 2015. The genus Romboutsia: genomic and functional characterization of novel bacteria dedicated to life in the intestinal tract [dissertation]. Wageningen, The Netherlands: Wageningen University.
- Grollman AP, Lehninger AL. 1957. Enzymic synthesis of l-ascorbic acid in different animal species. Arch Biochem Biophys. 69(C):458–467.
- Guedes AC, Amaro HM, Sousa-Pinto I, Malcata FX, 2019. Algal spent biomass—A pool of applications. In: Pandey A, Chang J, Soccol CR, Lee D, Chisti Y, editors. Biofuels from Algae. 2nd ed. Amsterdam, The Netherlands: Elsevier; p. 397–433.
- Huang Q, Liu X, Zhao G, Hu T, Wang Y. 2018. Potential and challenges of tannins as an alternative to in-feed antibiotics for farm animal production. Anim Nutr. 4(2):137–150.
- Hubert M, Rousseeuw PJ, Vanden Branden K. 2005. ROBPCA: A new approach to robust principal component analysis. Technometrics. 47(1):64–79.
- Iji PA, Khumalo K, Slippers S, Gous RM. 2004. Intestinal function and body growth of broiler chickens on maize-based diets supplemented with mimosa tannins and a microbial enzyme. J. Sci. Food Agric. 84(12):1451–1458.
- Jamroz D, Wiliczkiewicz A, Skorupińska J, Orda J, Kuryszko J, Tschirch H. 2009. Effect of sweet chestnut tannin (SCT) on the performance, microbial status of intestine and histological characteristics of intestine wall in chickens. Br Poult Sci. 50(6):687–699.
- Jansman AJM. 1993. Tannins in feedstuffs for simple-stomached animals. Nutr Res Rev. 6(1):209–236.
- Jiao Y, Park JH, Kim YM, Kim IH. 2017. Effects of dietary methyl sulfonyl methane (MSM) supplementation on growth performance, nutrient digestibility, meat quality, excreta microbiota, excreta gas emission, and blood profiles in broilers. Poult Sci. 96(7):2168–2175.
- Kneen MA, Annegarn HJ. 1996. Algorithm for fitting XRF, SEM and PIXE X-ray spectra backgrounds. Nucl Instruments Methods Phys Res Sect B Beam Interact with Mater Atoms. 109–110:209–213.
- Lenth RV. 2016. Least-squares means: the r package lsmeans. J Stat Softw. 69(1):1–33.
- Love MI, Huber W, Anders S. 2014. Moderated estimation of fold change and dispersion for RNA-seq data with DESeq2. Genome Biol. 15(12):550.
- Maki JJ, Looft T. 2018. Megasphaera stantonii sp. nov., a butyrate-producing bacterium isolated from the cecum of a healthy chicken. Int J Syst Evol Microbiol. 68(11):3409–3415.
- Marañón G, Muñoz-Escassi B, Manley W, García C, Cayado P, de la Muela M, Olábarri B, León R, Vara E. 2008. The effect of methyl sulphonyl methane supplementation on biomarkers of oxidative stress in sport horses following jumping exercise. Acta Vet Scand. 50(1):45.
- Marín L, Miguélez EM, Villar CJ, Lombó F. 2015. Bioavailability of dietary polyphenols and gut microbiota metabolism: antimicrobial properties. Biomed Res Int. 2015:905215–905218.
- Mathison GW, Fenton M, Milligan LP. 1981. Utilization of 2,3-butanediol by sheep. Can. J. Anim. Sci. 61(3):649–656.
- McMurdie PJ, Holmes S. 2013. phyloseq: an R package for reproducible interactive analysis and graphics of microbiome census data. PLoS One. 8(4):e61217.
- Meléndez-Hevia E, de Paz-Lugo P, Cornish-Bowden A, Cárdenas ML. 2009. A weak link in metabolism: the metabolic capacity for glycine biosynthesis does not satisfy the need for collagen synthesis. J Biosci. 34(6):853–872.
- Milani C, Duranti S, Bottacini F, Casey E, Turroni F, Mahony J, Belzer C, Delgado Palacio S, Arboleya Montes S, Mancabelli L, et al. 2017. The First microbial colonizers of the human gut: composition, activities, and health implications of the infant gut microbiota. Microbiol Mol Biol Rev. 81(4):e00036–e00017.
- Mueller-Harvey I. 2006. Review Unravelling the conundrum of tannins in animal nutrition and health. J. Sci. Food Agric. 86(13):2010–2037.
- National Center for Biotechnology Information. 2020. PubChem Compound Summary for CID 262, 2,3-Butanediol. Bethesda (MD); [accessed 2020 Jul 19]. https://pubchem.ncbi.nlm.nih.gov/compound/2_3-Butanediol.
- Ospina-Rojas IC, Murakami AE, Eyng C, Nunes RV, Duarte CRA, Vargas MD. 2012. Commercially available amino acid supplementation of low-protein diets for broiler chickens with different ratios of digestible glycine + serine:Lysine. Poult Sci. 91(12):3148–3155.
- Palombo EA. 2006. Phytochemicals from traditional medicinal plants used in the treatment of diarrhoea: modes of action and effects on intestinal function. Phytother Res. 20(9):717–724.
- Paradh AD. 2015. Gram-negative spoilage bacteria in brewing. In: Hill AE, editor. Brewing microbiology. Amsterdam, The Netherlands: Elsevier; p. 175–194.
- Quast C, Pruesse E, Yilmaz P, Gerken J, Schweer T, Yarza P, Peplies J, Glöckner FO. 2013. The SILVA ribosomal RNA gene database project: improved data processing and web-based tools. Nucleic Acids Res. 41(Database issue):D590–D596.
- R Core Team. 2020. R: A language and environment for statistical computing. Vienna, Austria: R Foundation for Statistical Computing.
- Redondo LM, Chacana PA, Dominguez JE, Fernandez Miyakawa ME. 2014. Perspectives in the use of tannins as alternative to antimicrobial growth promoter factors in poultry. Front Microbiol. 5:118.
- Roper JM, Smith BL, Caverly Rae JM, Huang E, Walker CA, McNaughton JL, Chen A, Reidinger KS. 2019. Nutrient composition and safety evaluation of simulated isobutanol distillers dried grains with solubles and associated fermentation metabolites when fed to male Ross 708 broiler chickens (Gallus domesticus). PLoS One. 14(7):e0219016.
- Schiavone A, Guo K, Tassone S, Gasco L, Hernandez E, Denti R, Zoccarato I. 2008. Effects of a natural extract of chestnut wood on digestibility, performance traits, and nitrogen balance of broiler chicks. Poult Sci. 87(3):521–527.
- Sergeant MJ, Constantinidou C, Cogan TA, Bedford MR, Penn CW, Pallen MJ. 2014. Extensive microbial and functional diversity within the chicken cecal microbiome. PLoS One. 9(3):e91941.
- Siegert W, Rodehutscord M. 2019. The relevance of glycine and serine in poultry nutrition: a review. Br Poult Sci. 60(5):579–588.
- Singleton VL. 1981. Naturally occurring food toxicants: phenolic substances of plant origin common in foods. In: Chichester CO, Mrak EM, Stewart GF, editors. Advances in food research. Vol. 27. Amsterdam, The Netherlands: Elsevier; p. 149–242.
- Sirri F, Pignata S, Franchini A, Meluzzi A. 2011. Sweet chestnut tannin supplementation as a way to reduce the incidence of foot pad dermatitis of broiler chickens. Poster session presented at: 18th Eur Symp Poult Nutr; Oct 31 - Nov 04; Cesme-Izmir, Turkey.
- Stanley D, Denman SE, Hughes RJ, Geier MS, Crowley TM, Chen H, Haring VR, Moore RJ. 2012. Intestinal microbiota associated with differential feed conversion efficiency in chickens. Appl Microbiol Biotechnol. 96(5):1361–1369.
- Stanley D, Hughes RJ, Geier MS, Moore RJ. 2016. Bacteria within the gastrointestinal tract microbiota correlated with improved growth and feed conversion: challenges presented for the identification of performance enhancing probiotic bacteria. Front Microbiol. 7:187.
- Starčević K, Krstulović L, Brozić D, Maurić M, Stojević Z, Mikulec Ž, Bajić M, Mašek T. 2015. Production performance, meat composition and oxidative susceptibility in broiler chicken fed with different phenolic compounds. J Sci Food Agric. 95(6):1172–1178.
- Steiner PR. 1989. Tannins as specialty chemicals: an overview. In: Hemingway RW, Karchesy JJ, Branham SJ, editors. Chem Significance Condens Tann. Boston (MA): Springer; p. 517–523.
- Torok VA, Hughes RJ, Mikkelsen LL, Perez-Maldonado R, Balding K, MacAlpine R, Percy NJ, Ophel-Keller K. 2011. Identification and characterization of potential performance-related gut microbiotas in broiler chickens across various feeding trials. Appl Environ Microbiol. 77(17):5868–5878.
- Tosi G, Massi P, Antongiovanni M, Buccioni A, Minieri S, Marenchino L, Mele M. 2013. Efficacy test of a hydrolysable tannin extract against necrotic enteritis in challenged broiler chickens. Ital J Anim Sci. 12(3):e62.
- Tretola M, Maghin F, Silacci P, Ampuero S, Bee G. 2019. Effect of supplementing hydrolysable tannins to a grower–finisher diet containing divergent PUFA levels on growth performance, boar taint levels in back fat and intestinal microbiota of entire males. Animals. 9(12):1063.
- van de Guchte M, Blottière HM, Doré J. 2018. Humans as holobionts: implications for prevention and therapy. Microbiome. 6(1):81.
- Van Hul M, Geurts L, Plovier H, Druart C, Everard A, Ståhlman M, Rhimi M, Chira K, Teissedre P-L, Delzenne NM, et al. 2018. Reduced obesity, diabetes, and steatosis upon cinnamon and grape pomace are associated with changes in gut microbiota and markers of gut barrier. Am J Physiol Metab. 314(4):E334–E352.
- Vital M, Karch A, Pieper DH. 2017. Colonic butyrate-producing communities in humans: an overview using omics data. mSystems. 2(6):e00130.
- Xuan Cuong D, Xuan Hoan N, Huu Dong D, Thi Minh Thuy L, Van Thanh N, Thai Ha H, Thi Thanh Tuyen D, Xuan Chinh D. 2019. Tannins: extraction from plants. In: Aires A, editor. Tannins - structural properties, biological properties and current knowledge. London, UK:IntechOpen.
- Yeoman CJ, White BA. 2014. Gastrointestinal tract microbiota and probiotics in production animals. Annu Rev Anim Biosci. 2:469–486.
- Zampiga M, Laghi L, Petracci M, Zhu C, Meluzzi A, Dridi S, Sirri F. 2018. Effect of dietary arginine to lysine ratios on productive performance, meat quality, plasma and muscle metabolomics profile in fast-growing broiler chickens. J Anim Sci Biotechnol. 9:79.
- Zhu C, Faillace V, Laus F, Bazzano M, Laghi L. 2018. Characterization of trotter horses urine metabolome by means of proton nuclear magnetic resonance spectroscopy. Metabolomics. 14(8):106.
- Zhu C, Laghi L, Zhang Z, He Y, Wu D, Zhang H, Huang Y, Li C, Zou L. 2020. First steps toward the giant panda metabolome database: untargeted metabolomics of feces, urine, serum, and saliva by 1H NMR. J Proteome Res. 19(3):1052–1059.
- Zhu C, Li C, Wang Y, Laghi L. 2019. Characterization of yak common biofluids metabolome by means of proton nuclear magnetic resonance spectroscopy. Metabolites. 9(3):41.