
 ?Mathematical formulae have been encoded as MathML and are displayed in this HTML version using MathJax in order to improve their display. Uncheck the box to turn MathJax off. This feature requires Javascript. Click on a formula to zoom.
Abstract
This experiment was conducted to evaluate the effects of dietary digestible sulphur amino acids (DSAAs) level on growth performance, blood metabolites, and liver functional enzymes of broilers during 1–11 days of age. Additionally, DSAAs requirement was determined from dose nutrient response data. A total of 432 1‐day‐old male Ross 308 broilers were allocated to six dietary treatments, graded levels of supplementary DL-Met (+0.8 g/kg per level) while Cys was equal across groups, led to levels of 0.62, 0.70, 0.78, 0.86, 0.94 and 10.2% DSAAs, with six replicates and 12 birds each. Increasing levels of dietary DSAAs enhanced live body weight (LBW), weight gain (WG), feed efficiency (FE), European Production Efficiency Factor (EPEF), and relative breast weight (RBW), although there was no effect on feed intake. At the end of the starter period, a linear increase in blood serum total protein and albumin concentration was concomitant with decreasing in triglyceride, whole cholesterol, high‐density lipoprotein, low‐density lipoprotein, creatinine, and aspartate aminotransferase concentration when dietary DSAAs level was increased. The DSAAs requirements estimated by linear broken-line (LBL) fit model to optimise LBW, WG, FE, EPEF and RBW were 0.80, 0.81, 0.93, 0.95 and 0.93%, although the estimated values by the quadratic broken line fit model were 14.32, 19.93, 16.85, 23.68 and 5.79% higher than those, respectively. It is concluded, a minimum of 0.95% DSAAs concentration in broiler starter diet is suggested to optimise growth performance. Estimation of DSAAs requirement depended on what production parameter and regression model are taken considered for optimisation.
A minimum of 0.95% digestible sulphur amino acids level is suggested in the broiler starter diet to optimise growth performance.
Highlights
Introduction
Dietary protein and amino acids (AAs) levels play a vital role in poultry nutrition to improve growth performance and animal welfare (Zarghi et al. Citation2020a). The efficient utilisation of protein in the diet depends on the amount, composition, and digestibility of dietary AAs (Akbari Moghaddam Kakhki et al. Citation2016). Diet formulation based on digestible AAs not only reduces feed cost and supplies the proper requirements of birds but also reduces environmental pollution due to decrease nitrogen excretion (Dersjant and Peisker Citation2011).
Methionine (Met) is an essential sulphur-containing AA that plays many roles in living systems and has a significant role in various biological processes such as; protein synthesis, convert to other sulphur-containing AAs, methyl donor for methylation, intermediates in metabolic pathways, synthesis of polyamines (Vazquez-Anon et al. Citation2006; Faridi et al. Citation2016), and provided a methyl group by sulphur-adenosyl methionine for epinephrine, carnitine, choline, and creatine synthesis (Schutte et al. Citation1997). Methionine and cystine (Cys) be considered to be the principal sulphur amino acids (SAAs). Methionine can be converted to Cys. This occurs through the transsulphuration pathway in which the sulphur of Met is transferred to serine, thereby yielding Cys. Therefore, it can be determined SAAs requirement by using graded levels of Met in the diet without supplementation of Cys (Suzuki et al. Citation2020). It has been well documented that broiler diets based upon soybean meal as the primary protein source are deficient in the SAAs (Ahmed and Abbas Citation2011; Goulart et al. Citation2011; Faridi et al. Citation2016). Various levels of Met (ranging from 0.3–1.2%) in the starter diet of broilers have been reported by researchers. Whatever, it has been suggested that commercial broiler does not need more than 0.50% Met in starter diets for optimum growth performance (Jankowski et al. Citation2014). In an experiment which studied the effect of dietary 0.32, 0.38, 0.44, and 0.50% DL-Met levels with a constant level of L-Cys (0.40%) on slow and fast-growing broilers, only feed conversion ratio was improved with the highest level of Met and weight gain was not affected (Kalinowski et al. Citation2003).
Given this background, the present study was conducted to evaluate the growth performance, blood metabolites, and liver functional enzymes of broiler chicks responses to dietary digestible sulphur amino acid (DSAAs) level during the starter period (1–11 days of age). Additionally, we hypothesised that it is possible to find an optimal inclusion level of DSAAs for broilers during the starter period by regression models that allows maximum growth performance from DL-Met supplementation.
Material and methods
The experiment was conducted with the approval of the Animal Care Committee of the Ferdowsi University of Mashhad, Mashhad, Iran (Approval no: 356/493/2019).
Birds, housing, experimental design and diets
This experiment was done at the Poultry Research Station and Animal Nutrition Laboratory at the Ferdowsi University of Mashhad (Mashhad, Iran). A total of 432 one-day-old male Ross 308 broilers were obtained from a local hatchery. Chicks were randomly distributed to 36 floor pens (12 chicks each; 0.1 m2/bird). Each pen was equipped with one pan feeder and two nipple waterer. The pen floor was covered with wood shavings. The lighting program was 21 L: 3 D during the whole experimental period. Birds and housing facilities were inspected three times daily.
The experimental diet formulation was based on the recommendations of Ross (Aviagen Citation2019) for the starter period, except for DSAAs (Met + Cys). Ingredient and nutrient compositions of basal diet are presented in Table . The experiment was conducted in a complete randomised design, with six treatments, and six replicates of 12 birds. The experimental treatments comprised mash diets containing six levels of DSAAs, namely 0.62, 0.70, 0.78, 0.86, 0.94, and 1.02%. The diets were produced by taking a batch of the basal diet (lowest DSAAs concentration), divided into six equal portions, added DL-Met (99% purity) on top of each portion, and mixed to make the experimental diets. Protein, AAs, and digestible AAs of feed ingredients were analysed using NIR by Evonik Co., Tehran, Iran. The supplemental DL-Met and analysed nutrient composition in experimental diets are shown in Table . Birds were fed during the starter period (1-11 days of age). All birds had free access to mash feed and water throughout the experiment period.
Table 1. Ingredients and nutrient composition of the basal diet.a
Table 2. Supplemental DL-Met and analysed nutrient composition in experimental diets.a
Growth performance trait
All birds (pen groups) were weighed at the initial experiment and day 11 after 4 hr feed withdrawal. Feed consumption was measured by weighing the offered feeds during and residual feed at the end of the experiment. Daily weight gain, daily feed intake, and feed efficiency (adjusted for mortality and calculated as total gain including the weight of lost birds divided by total feed intake) were measured during 1–11 days of age. The European Production Efficiency Factor (EPEF) was calculated as follows (Zarghi et al. Citation2020b):
Sampling procedures
On day 11 of age, one bird from each pen (6/treatment) was randomly selected, and a 2 mL blood sample was collected from the heart into a non‐heparinized tube. After allowing for the completion of clotting, blood samples were centrifuged at 1,900 g for 10 min at 4 °C to extract serum. Subsequently, serum samples were frozen at −20 °C for later analysis.
On day 11 of age, one bird from each pen (6/treatment) after 4 hr of feed withdrawal but had free access to drinking water was randomly selected, weighed, and compassionately slaughtered. The carcases were eviscerated manually and obtained by removing the head, feathers, feet, visceral organs, and gastrointestinal tract. The whole carcase was weighed and cut according to the procedure (Zarghi et al. Citation2020a). Carcases and cut organs weighed by a digital weighing scale (0.01 g, model GF 400, A&D Weighing).
Blood biochemical parameters
Before testing, serum samples were removed from the freezer, thawed, and warmed to room temperature. Serum triglyceride (TG), whole cholesterol, high‐density lipoprotein (HDL), low‐density lipoprotein (LDL), total fat (TF), uric acid (UA), creatinine, total protein (TP), albumin (Alb), alanine aminotransferase (ALT), aspartate aminotransferase (AST), and alkaline phosphatase (ALP) concentrations were measured by a multi‐test automatic random‐access system auto‐analyser (Cobas Bio, Roche).
Statistical analysis
All data were analysed for normality using SAS software through Univariate plot normal procedure (SAS Citation2003). Then, data were analysed using the general linear model of SAS with dietary treatments as independent variables. Linear and quadratic polynomial models were analysed to describe the relationships between dietary DSAAs levels and variables. The DSAAs requirement for optimal growth performance parameters was determined by the utilisation of analysed diet DSAAs levels using non-linear (NLIN) procedures, through linear (LBL) and quadratic broken‐lines (QBL) regression analysis as described by Robbins et al. (Citation2006). The iterative procedure makes repeated estimates for coefficients and minimises residual error until the best-fit lines are achieved: one line with a slope of zero and the other with a marked slope. The two lines are fitted to the values using the following equations:
where X = Independent variable, R = Requirement, Y = Dependent variable, L = Theoretical maximum, I = 1 (if X < R) or I = 0 (if X > R), and U = Constant rate. The coefficient of determination (R2) was determined as follows: R2 = 1− (Residual sum of squares/Corrected total sum of squares).
Results
Growth performance
The results for growth performance indices are presented in Table . There were linear (p < .01) responses to starter diet DSAAs levels for live body weight (LBW), average daily weight gain (WG), feed efficiency (FE), and European Production Efficiency Factor (EPEF). The results showed, birds fed the diet containing 0.94% DSAAs, performed the highest LBW, WG, and EPEF, which were 16.59, 21.28, and 39.82% higher than those fed a non-Met supplemented diet (0.62% DSAAs), respectively. Feed efficiency was highest in the birds fed the starter diet with 1.02% DSAAs level, and it was 22.0% higher than those fed non-Met supplemented diet. There was no significant effect (p > .05) of the dietary DSAAs level on feed intake (FI). The average daily DSAAs intake, according to the feed consumption data and diets AAs analysis information, for the birds fed diets with 0.62, 0.70, 0.78, 0.86, 0.94, and 1.02% DSAAs levels were 192, 227, 240, 286, 302 and 321 mg/bird, respectively.
Table 3. Effect of dietary digestible sulphur amino acids (DSAAs) level on growth performance, EPEF and daily DSAAs intake in Ross 308 male broiler chicks during starter period.a
Carcase and visceral organ relative weight
The relative carcase and organs weight (g/100 LBW) of birds sampled on d 11 are given in Table . Relative breast weight (RBW) linearly increased with increasing dietary DSAAs levels (p <.01). Breast relative weight was highest in the birds fed the diet with 0.94% DSAAs level, and it was absolutely 3.83% higher than those fed non-Met supplemented diet (17.84% vs. 13.99% RBW). However, the relative weight of carcase, legs (thigh + drumstick), frame (carcase without breast and legs), visceral organs, and dressing (skin + feather) also left-wing feather length were not affected by dietary DSAAs level.
Table 4. Effect of dietary digestible sulphur amino acids (DSAAs) level on carcass and cut relative weight (g/100 g of live body weight) in male broiler chicks on day 11.a
Blood biochemical parameters
The effect of dietary DSAAs level on blood metabolites and liver functional enzymes are shown in Table . By increasing dietary DSAAs levels, linearly decreased serum TG, whole cholesterol, HDL, LDL, creatinine (p <.01), and ALP (p <.05) concentration. But, serum TP (p <.01) and Alb (p <.05) concentration linearly increased. Serum UA concentration decreased by increasing dietary DSAAs level up to 0.86% and over that increased (quadratic effect, p <.05). The partial correlation coefficients and probability values between growth performance traits with blood serum metabolites and liver functional enzymes have shown in Table . Daily WG and FE showed a negative correlations with serum concentration of TG (–0.44 and −0.34), whole cholesterol (–0.44 and −0.49), HDL (–0.40 and −0.51), LDL (–0.39 and −0.44), and positive correlation with serum TP concentration (+0.27 and +0.36). Similarly, daily WG showed a negative correlations with AST (–0.33) and ALP (–0.44) concentration. Blood metabolites and liver functional enzymes partial correlation with RBW was not significant except observed a negative correlation with HDL (–0.38) and AST (–0.45) concentrations.
Table 5. Effect of dietary digestible sulphur amino acids (DSAAs) level on blood metabolites and liver functional enzymes in male broiler chicks on day 11.a
Table 6. Partial correlation coefficients (above) and probability values (below) between growth performance traits with blood serum constituents of Ross 308 male broiler chicks on day 11.
Estimated DSAA requirements
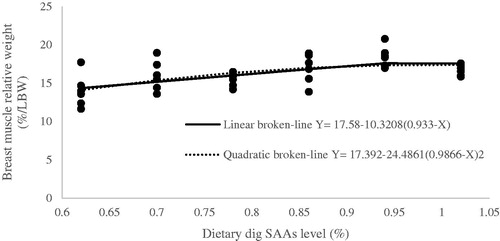
The DSAA requirement for the optimisation growth performance indices was estimated by LBL, and QBL fit models are shown in Figures . The DSAAs requirement estimated by LBL fit models to optimise LBW, WG, FE, EPEF, and RBW were 0.80 ± 0.035%, 0.81 ± 0.059%, 0.93 ± 0.105%, 0.95 ± 0.094%, and 0.93 ± 0.091%, respectively. The estimated values of DSAAs requirement for optimised FE, EPEF, and RBW were approximately near together (0.93–0.95%) and strain recommendation (0.94%), but the estimated values for optimised LBW and WG were 14.42% and 16.21% lower than those, respectively. The DSAAs requirement estimated by QBL fit models to optimise LBW, WG, FE, EPEF, and RBW were 0.91 ± 0.097%, 0.98 ± 0.172%, 1.08 ± 0.337%, 1.17 ± 0.536%, and 0.99 ± 0.163%, respectively. All dose responses estimated with QBL fit model were higher than values estimated with the LBL fit model. Feed intake responses did not fit with LBL and QBL models to optimised dietary DSAAs level.
Figure 1. Fitted broken-line plot of 11d live body weight (LBW) of broiler chickens as a function of dietary dig SAAs level (% of diet). The break point occurred at 0.796 ± 0.0353, p <.001, R2 = 0.48 and 0.910 ± 0.0907, p <.001, R2 = 0.46 with linear and quadratic broken line, respectively.
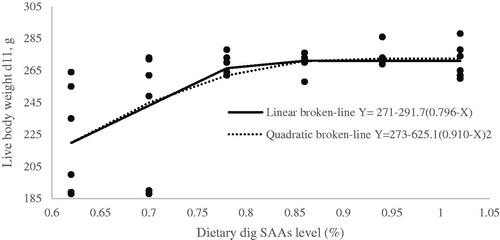
Figure 2. Fitted broken-line plot of average daily weight gain (WG) during starter period (0–11d of age) as a function of dietary dig SAAs level (% of diet). The break point occurred at 0.8129 ± 0.0587, p <.002, R2 = 0.32 and 0.9754 ± 0.1716, p <.002, R2 = 0.31 with linear and quadratic broken line, respectively.
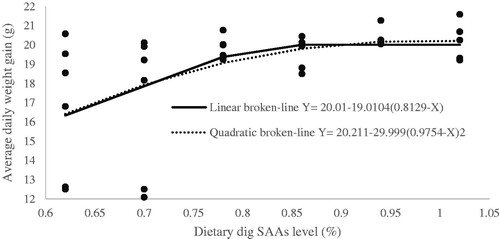
Figure 3. Fitted broken-line plot of feed efficiency during starter period (0–11d of age) as a function of dietary dig SAAs level (% of diet). The break point occurred at 0.9264 ± 0.1051, p <.004, R2 = 0.31 and 1.0815 ± 0.3368, p <.004, R2 = 0.30 with linear and quadratic broken line, respectively.
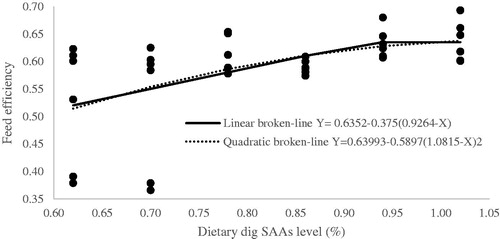
Figure 4. Fitted broken-line plot of European Production Efficiency Factor during starter period (0–11d of age) as a function of dietary dig SAAs level (% of diet). The break point occurred at 0.9461 ± 0.094, p <.001, R2 = 0.36 and 1.1699 ± 0.536, p <.001, R2 = 0.25 with linear and quadratic broken line, respectively.
EPEF: European Production Efficiency Factor is calculated as [viability d 1–11 (%) × BW d11 (kg) × 100] / [age (d) × FCR d 1–11].
![Figure 4. Fitted broken-line plot of European Production Efficiency Factor during starter period (0–11d of age) as a function of dietary dig SAAs level (% of diet). The break point occurred at 0.9461 ± 0.094, p <.001, R2 = 0.36 and 1.1699 ± 0.536, p <.001, R2 = 0.25 with linear and quadratic broken line, respectively.EPEF: European Production Efficiency Factor is calculated as [viability d 1–11 (%) × BW d11 (kg) × 100] / [age (d) × FCR d 1–11].](/cms/asset/17c79ae1-bc0a-4f72-a794-0d673246c773/tjas_a_1847606_f0004_b.jpg)
Figure 5. Fitted broken-line plot of breast muscle relative weight during starter period (0–11d of age) as a function of dietary dig SAAs level (% of diet). The break point occurred at 0.933 ± 0.091, p <.001, R2 = 0.58 and 0.9866 ± 0.163, p <.001, R2 = 0.35 with linear and quadratic broken line, respectively.
Discussion
Growth performance
Our observation in the current experiment showed, LBW, WG, and EPEF values were linearly improved by increasing diet DSAAs level up to 0.94%, surplus DSAAs concentration did not more improve those, but the FE value linearly improved by increasing diet DSAAs level up to 1.02% (Table ). In agreement with our result, the beneficial effect of supplemental Met to broiler diets have been demonstrated in many experiments (Ahmed and Abbas Citation2011; Conde-Aguilera et al. Citation2013; Drażbo et al. Citation2015; Rehman et al. Citation2019). Many researchers approved dietary deficiency (Conde-Aguilera et al. Citation2016; Brede et al. Citation2018) and or oversupply (Xie et al. Citation2004; Dilger and Baker Citation2007) of SAAs leads to unsuitable performance. Conde-Aguilera et al. (Citation2013) reported that dietary SAAs levels had significant effects on protein synthesis that lead to enhance weight gain and feed efficiency.
Feed intake was not significantly affected by the increasing starter diet DSAAs level (Table ). There are contradictory results on the effect of SAA on feed consumption. For example, our result resembles who observed no effect of diet Met levels on feed intake in broiler chickens (Dilger and Baker Citation2007; Goulart et al. Citation2011; Rehman et al. Citation2019; Zarghi et al. Citation2020b). In contrast, reported Met deficiencies depressed the FI in broilers (Conde-Aguilera et al. Citation2013). Bunchasak and Keawarun (Citation2006) reported that dietary Met deficiencies depressed the FI of broiler chicks due to AA imbalances. It can be assumed that, under AA imbalances, chicks lose the potential to adjust FI to satisfy their requirements; the main positive effect of Met supplementation may come from its improvement of FI via the AA balance (Bunchasak Citation2009). A decrease in the concentration of a limiting AA in specific regions of the brain is followed by behavioural effects, especially a decrease in feed intake (Gietzen, Citation1993). Gietzen et al. (Citation1986) reported that the concentration of norepinephrine in the prepyriform cortex might be associated with the initial feed intake response of animals to imbalanced AA diets. They speculated that specific neurotransmitters had a role in regulating of feed intake in response to the ingestion of imbalanced diets.
Carcase and visceral organ relative weight
This experiment demonstrates that increasing diet DSAAs level up to 1.02% improved breast growth (Table ). Our finding confirms previous studies, which reported Met supplementation improves protein synthesis and muscularity, where dietary supplementation of Met has a significant influence on breast weight (Schutte et al. Citation1997; Nukreaw et al. Citation2011; Yoo et al. Citation2017; Rehman et al. Citation2019). Del Vesco and Gasparino (Citation2013) reported insulin-like growth factor-1 (IGF-1) gene expression in the liver was higher in animals fed extra Met. Feeding high compared to low Met diets caused changes in gene expression in breast muscle of chickens and increased the expression of the anabolic factors IGF-1, while it decreased the expression of metabolites which are involved in protein degradation (Wen et al. Citation2014).
Dietary DSAAs levels did not affect the relative weight of the whole carcase, legs (thigh + drumstick), frame, and visceral organs. This difference may relate to independent methionine supplementation responses between different organs (Ahmed and Abbas Citation2011). The dressing (skin + feather) percentage was not significantly affected by the supplemental Met (Table ). In agreement with our result, Kalinowski et al. (Citation2003) have reported, the Cys requirement for slow-feathering broilers was less than that for fast-feathering. However, the Met requirement was similar among different feathering types. Additionally, the lack of feather development during the starter period may have reduced the need for Cys, particularly (Dozier and Mercier Citation2013).
Blood biochemical parameters
In the current experiment, a linear increment in blood serum TP and Alb concentration was observed by increasing dietary DSAAs level (Table ). The serum TP concentration positively correlated with WG and FE (Table ). In agreement with our result, Emadi et al. (Citation2010) reported, feeding low AA diets seemed to be associated with a reduction in serum TP and Alb concentration in broiler chickens. In contrast, Hind et al. (Citation2008) reported that the level of Met did not have any effect on serum TP and Alb concentration. Albumin is a major protein in serum. It is synthesised exclusively in the liver before being secreted into the circulation. Like to skeletal muscle protein, albumin synthesis is stimulated by dietary AAs and protein levels (Wada et al. Citation2017). The anabolic effect of Met is partly due to increased substrate supply at the sites of protein synthesis. However, recent insights have highlighted its action as a signal molecule in regulating protein metabolism (Majdeddin et al. Citation2019). In fast-growing broilers, Met supplementation promotes anabolism and reduces catabolic processes, favouring muscle protein synthesis (Zeitz et al. Citation2019). One of the reasons for the reducing serum TP and Alb concentration in the birds fed a diet with lower DSAAs level in our experiment may be related to its decomposition for supplying AA requirements.
The current experiment showed a linear reduction in serum TG, whole cholesterol, HDL, LDL, and creatinine concentration by increasing dietary DSAAs level (Table ). Additionally, higher growth performance in birds was associated with a lower rate of TG and cholesterol synthesis (Table ). Among the AAs, sulphur AAs have the highest potential for adjustment the fat metabolism. Indeed, the addition of Met has been correlated with the tendency to less lipogenesis (Rostagno et al. Citation1995). Methionine plays an essential role in lipid metabolism as a precursor for L-carnitine (Sigolo et al. Citation2019). L-carnitine has hypolipidemic effects, lead to reduce blood concentrations of whole cholesterol, TG, free fatty acids, and VLDL (Diaz et al. Citation2000).
In this experiment, blood serum UA concentration varied in a quadratic manner by increasing dietary DSAAs level, the lowest blood serum UA concentration observed in the birds fed a diet with 0.86% DSAAs concentration (Table ). Uric acid is the end product of AA degradation (Hosseintabar et al. Citation2015). The amino terminus of each AA must be removed in AA catabolism because nitrogenous compounds are not utilised in energy transduction pathways, and amino group accumulation can be very toxic (Namroud et al. Citation2008; Zarghi et al. Citation2020a). Therefore, blood UA levels can serve as an indicator of body AA utilisation, higher UA concentrations in the blood are indicative of lower retention of nitrogen in the body and that excessive deamination may have occurred. Blood serum UA is indicative of the rate of AA utilisation in broilers fed adequate or deficient diets (Zarghi et al. 2020a,b).
Our result in this experiment demonstrated the significant effect of increasing dietary DSAAs level on liver functional enzymes. Blood serum AST concentration linearly decreased by increasing DSAAs levels (Table ). Weight gain and RBW were negatively correlated with AST concentration (Table ). Sulphur-containing AAs (Met + Cys) may improve antioxidant properties by participating in the production of GSH (Afkhami et al. Citation2020). Antioxidants could alleviate the adverse effects of stress and declined liver functional enzymes (Kanani et al. Citation2016). Reported that diets formulated on the digestible AA basis (Rezaeipour et al. Citation2016) and Met supplementation (Attia et al. Citation2005) reduce liver functional enzymes concentration. The liver as the main organ in body metabolism is sensitive to nutritional modifications. The blood serum liver functional enzymes concentration is usually considered as an important index for understanding the liver health (Corduk Citation2007).
Estimated DSAA requirements
In our study, the DSAAs requirements estimated by the linear broken-line fit model for optimise LBW, WG, FE, EPEF and RBW were 0.80, 0.81, 0.93, 0.95 and 0.93%, respectively (Figures ). Aviagen (Citation2019) recommends 0.94% DSAAs and 0.51% Met in practical starter diet for Ross broilers (DSAAs/dig Lys ratio of 0.73). Dietary DSAAs requirements estimated for growth performance measurements agree with those previously published for broilers during the same age period (Sklan and Noy Citation2003; Goulart et al. Citation2011). Our result in this experiment approved that, estimation of AA requirements depends on what production parameter is taken into consideration for optimising. The DSAAs requirements estimated for optimising EPEF, FE, and RBW were higher than the value estimated for LBW and WG. In agreement with our result, the researcher reported that the SAA requirement is higher for obtaining maximum FE and breast meat yield than for WG (Schutte and Pack 1995; Baker et al. Citation1996; Mack et al. Citation1999; Kalinowski et al. Citation2003; Garcia and Batal Citation2005; Lumpkins et al. Citation2007). This would be even more prominent with modern high breast meat yielding broiler strains (Majdeddin et al. Citation2019). The optimal daily DSAAs consumption/bird was computed using the average daily feed intake data (32 g/b/d) and the estimated dietary DSAAs levels for optimal growth performance responses by LBL fit models. Daily DSAAs requirement for that optimised WG, FE, EPEF, and RBW were estimated 260, 296, 302, and 298 mg/d, respectively. Agreement with our result, the optimum DSAAs in the starter diet determined for male broilers corresponded to DSAAs intakes of 296-306 mg/d (Dozier and Mercier Citation2013).
In the current study, the optimal estimated DSAAs to digestible lysine ratio for LBW, WG, FE, EPEF, and RBW were 0.62, 0.64, 0.72, 0.74, and 0.73, respectively. The ideal AA profile (SAAs/Lys ratio) in broiler chick starter diets according to the most recently reported data are summarised 0.70-0.78 (Atencio et al. Citation2004; Goulart et al. Citation2011; Dozier and Mercier Citation2013; Spek Citation2018; Aviagen Citation2019). Conversely, reported a DSAAs/Lys ratio at 0.63-0.66 for broilers from 4 to 15 d of age, for BW gain and FE (Knowles and Southern Citation1998). Our result in this study approved, broiler chickens Ross nutrition specification manual recommended a ratio of DSAAs/dig Lys of 0.72 for the starter period. Atencio et al. (Citation2004) reported a ratio of DSAAs/dig Lys for optimised WG and FE of 0.70 in broiler chickens diets during the starter period. Similarly, Goulart et al. (Citation2011) reported a ratio of DSAAs/dig Lys of 0.73–0.75 for maximum growth and feed efficiency (Spek Citation2018).
The quadratic broken-line fit model estimated higher requirements than the straight broken-line model for all response criteria. The values estimated by the QBL fit model for LBW, WG, FE, EPEF, and RBW were 14.32, 19.93, 16.85, 23.68, and 5.79% higher than those estimated by the LBL fit model, respectively (Figures ). In agreement with our results in this study, reported that the method of statistical evaluation could influence the estimation of an AA requirement (Taghinejad-Roudbaneh et al. Citation2011; Citation2013). The most common statistical models used to determine AA requirements are the broken-line (one-slope), two slopes, quadratic, and ascending quadratic with plateau models (Vedenov and Pesti Citation2008; Taghinejad-Roudbaneh et al. Citation2013). The result of this experiment closed with the results of other researchers that found quadratic procedure estimates were higher for all protein sources when compared with the straight broken-line models (Barbour et al. Citation1993; Taghinejad-Roudbaneh et al. Citation2011; Citation2013).
Conclusions
The outcomes of the present study showed blood parameters are a suitable indicator of physiological and nutritional status, and their changes have the potential of being used to elucidate the impact of nutritional factors. However, dietary DSAAs level of 0.81% (DSAAs/dig Lys ratio 0.63) was sufficient for the support gain of broilers during the starter period (1–11 days of age). The higher dietary DSAAs levels of 0.93–0.95% (DSAAs/dig Lys ratio 0.73–0.74) were obtained for maximised FE, EPEF, and RBW. The DSAAs requirements estimated by the QBL fit model to optimise production parameters were higher than those estimated by LBL fit model. Overall, estimation of DSAAs requirement depended on what production parameter and regression model are taken considered for optimisation. A minimum of 0.95% DSAAs level in broiler starter diet for optimal growth performance be recommended.
Ethical approval
The experiment was conducted with the approval of the Animal Care Committee of the Ferdowsi University of Mashhad (Mashhad, Iran).
Acknowledgements
The authors greatly appreciate our colleagues from the Poultry Research Station and Animal Nutrition Laboratory for their valuable help, critiques, and suggestions and the Iran branch of Evonik Co. for the feedstuffs amino acid analysis.
Disclosure statement
No potential conflict of interest was reported by the authors.
Additional information
Funding
References
- Afkhami M, Kermanshah H, Majidzadeh Heravi R. 2020. Evaluation of whey protein sources on performance, liver antioxidants and immune responses of broiler chickens challenged with ethanol. J Anim Physiol Anim Nutr. 104(3):898–908.
- Ahmed EM, Abbas TE. 2011. Effects of dietary levels of methionine on broiler performance and carcass characteristics. Int J Poult Sci. 10(2):147–151.
- Akbari Moghaddam Kakhki R, Golian A, Zarghi H. 2016. Effect of digestible methionine + cystine concentration on performance, egg quality and blood metabolites in laying hens. Br Poult Sci. 57(3):403–414.
- Atencio A, Albino LFT, Rostagno HS, Vieites FM. 2004. Methionine + cystine requirement of males broilers from 1 to 20, 24 to 38 and 44 to 56 days of age. R Bras Zootec. 33(5):1152–1166.
- Attia Y, Hassan R, Shehatta M, Abd-El-Hady SB. 2005. Growth, carcass quality and serum constituents of slow growing chicks as affected by betaine addition to diets containing 2. Different levels of methionine. Int J Poult Sci. 4(11):856–865.
- Aviagen 2019. Ross broiler: nutrition specification. Huntsville (AL): Aviagen.
- Baker DH, Fernandez SR, Webel DM, Parsons CM. 1996. Sulfur amino acid requirement and cystine replacement value of broiler chicks during the period three to six weeks posthatching. Poult Sci. 75(6):737–742.
- Barbour G, Latshaw JD, Bishop B. 1993. Lysine requirement of broiler chicks as affected by protein source and method of statistical evaluation. Br Poult Sci. 34(4):747–756.
- Brede A, Wecke C, Liebert F. 2018. Does the Optimal Dietary Methionine to Cysteine Ratio in Diets for Growing Chickens Respond to High Inclusion Rates of Insect Meal from Hermetia illucens? Animals. 8(11):187.
- Bunchasak C, Keawarun N. 2006. Effect of methionine hydroxy analog‐free acid on growth performance and chemical composition of liver of broiler chicks fed a corn–soybean based diet from 0 to 6 weeks of age. Anim Sci J. 77(1):95–102.
- Bunchasak C. 2009. Role of dietary methionine in poultry production. Jpn Poult Sci. 46(3):169–179.
- Conde-Aguilera JA, Cholet JCG, Lessire M, Mercier Y, Tesseraud S, van Milgen J. 2016. The level and source of free-methionine affect body composition and breast muscle traits in growing broilers1. Poult Sci. 95(10):2322–2331.
- Conde-Aguilera JA, Cobo-Ortega C, Tesseraud S, Lessire M, Mercier Y, Van Milgen J. 2013. Changes in body composition in broilers by a sulfur amino acid deficiency during growth. Poult Sci. 92(5):1266–1275.
- Corduk M, Ceylan N, Ildiz F. 2007. Effect of dietary energy density and Lcarnitine supplementation on growth performance, carcass traits and blood parameters of broiler chickens. S Afr J Anim Sci. 37(2):65–73.
- Del Vesco AP, Gasparino E. 2013. Production of reactive oxygen species, gene expression, and enzymatic activity in quail subjected to acute heat stress. J. Anim. Sci. 91(2):582–587.
- Dersjant LY, Peisker M. 2011. A review on recent findings on amino acids requirements in poultry studies. Iran J Appl Anim Sci. 1:73–79.
- Diaz M, Lopez F, Hernandez F, Urbina JA. 2000. L-carnitine effects on chemical composition of plasma lipoproteins of rabbits fed with normal and high cholesterol diets. Lipids. 35(6):627–632.
- Dilger RN, Baker DH. 2007. DL-Methionine is as efficacious as L-methionine, but modest L-cystine excesses are anorexigenic in sulfur amino acid-deficient purified and practical-type diets fed to chicks. Poult Sci. 86(11):2367–2374.
- Dozier WA, Mercier Y. 2013. Ratio of digestible total sulfur amino acids to lysine of broiler chicks from 1 to 15 days of age. J Appl Poult Res. 22(4):862–871.
- Drażbo A, Kozłowski K, Chwastowska-Siwiecka I, Sobczak A, Kwiatkowski P, Lemme A. 2015. Effect of different dietary levels of DL-methionine and the calcium salt of DL-2-hydroxy-4-[methyl] butanoic acid on the growth performance, carcass yield and meat quality of broiler chickens. European Poult Sci. 79:114.
- Emadi M, Kaveh K, Bejo MH, Ideris A, Jahanshiri F, Ivan M, Alimon RA. 2010. Growth performance and blood parameters as influenced by different levels of dietary arginine in broiler chickens. J Anim Veter Adv. 9(1):70–74.
- Faridi A, Gitoee A, Sakomura NK, Donato DCZ, Angelica Gonsalves C, Feire Sarcinelli M, Bernardino de Lima M, France J. 2016. Broiler responses to digestible total sulphur amino acids at different ages: a neural network approach. J Appl Anim Res. 44(1):315–322.
- Garcia A, Batal A. 2005. Changes in the digestible lysine and sulfur amino acid needs of broiler chicks during the first three weeks posthatching. Poult Sci. 84(9):1350–1355.
- Gietzen DW. 1993. Neural mechanisms in the responses to amino acid deficiency. J Nutr. 123(4):610–625.
- Gietzen DW, Leung PMB, Rogers QR. 1986. Norepinephrine and amino acids in prepyriform cortex of rats fed imbalanced amino acid diets. Physiol Behav. 36(6):1071–1080.
- Goulart CC, Costa FGP, Silva JHV, Souza JG, Rodrigues VP, Oliveira CFS. 2011. Requirements of digestible methionine + cystine for broiler chickens at 1 to 42 days of age. R Bras Zootec. 40(4):797–803.
- Hind AA, Elagib H, Mohammad E. 2008. The effect of methionine and energy level on hematological indices in broiler under hot climate. Res J Poult Sci. 2(1):15–20.
- Hosseintabar B, Dadashbeiki M, Bouyeh M, Seidavi A, van den Hoven R, Gamboa S. 2015. Effect of different levels of L-carnitine and lysine-methionine on broiler blood parameters. Rev MVZ Córdoba. 20(3):4698–4708.
- Schutte JB, Pack M. 1995. Sulfur Amino Acid Requirement of Broiler Chicks from Fourteen to Thirty-Eight Days of age. 1. Performance and carcass yield. Poult Sci. 74(3):480–487.
- Jankowski J, Kubińska M, Zduńczyk Z. 2014. Nutritional and immunomodulatory function of methionine in poultry diets–a review. Ann Anim Sci. 14(1):17–32.
- Kalinowski A, Moran ET, Jr, Wyatt CL. 2003. Methionine and cystine requirements of slow-and fast-feathering broiler males from three to six weeks of age. Poult Sci. 82(9):1428–1437.
- Kanani PB, Daneshyar M, Najafi R. 2016. Effects of cinnamon (Cinnamomum zeylanicum) and turmeric (Curcuma longa) powders on performance, enzyme activity, and blood parameters of broiler chickens under heat stress. Poult Sci J. 4(1):47–53.
- Knowles T, Southern L. 1998. The lysine requirement and ratio of total sulfur amino acids to lysine for chicks fed adequate or inadequate lysine. Poult Sci. 77(4):564–569.
- Lumpkins BS, Batal AB, Baker DH. 2007. Variations in the digestible sulfur amino acid requirement of broiler chickens due to sex, growth criteria, rearing environment, and processing yield characteristics. Poult Sci. 86(2):325–330.
- Mack S, Bercovici D, De Groote G, Leclercq B, Lippens M, Pack M, Schutte JB, Van Cauwenberghe S. 1999. Ideal amino acid profile and dietary lysine specification for broiler chickens of 20 to 40 days of age. Br Poult Sci. 40(2):257–265.
- Majdeddin M, Golian A, Kermanshahi H, Michiels J, De Smet S. 2019. Effects of methionine and guanidinoacetic acid supplementation on performance and energy metabolites in breast muscle of male broiler chickens fed corn-soybean diets. Br Poult Sci. 60(5):554–563.
- Namroud NF, Shivazad M, Zaghari M. 2008. Effects of fortifying low crude protein diet with crystalline amino acids on performance, blood ammonia level, and excreta characteristics of broiler chicks. Poult Sci. 87(11):2250–2258.
- Nukreaw R, Bunchasak C, Markvichitr K, Choothesa A, Prasanpanich S, Loongyai W. 2011. Effects of methionine supplementation in low-protein diets and subsequent re-feeding on growth performance, liver and serum lipid profile, body composition and carcass quality of broiler chickens at 42 days of age. J Poult Sci. 48(4):229–238.
- Rehman AU, Arif M, Husnain MM, Alagawany M, El-Hack A, Mohamed E, Taha AE, Elnesr SS, Abdel-Latif MA, Othman SI. 2019. Growth performance of broilers as influenced by different levels and sources of methionine plus cysteine. Animals. 9(12):1056.
- Rezaeipour V, Alinejad H, Asadzadeh S. 2016. Growth performance, carcass characteristics and blood metabolites of broiler chickens fed diets formulated on total or digestible amino acids basis with bovine bile salts powder and soybean oil. J Cent Eur Agric. 17(2):272–284.
- Robbins KR, Saxton AM, Southern LL. 2006. Estimation of nutrient requirements using broken-line regression analysis. J Anim Sci. 84(suppl_13):E155–E165.
- Rostagno H, Pupa J, Pack M. 1995. Diet formulation for broilers based on total versus digestible amino acids. J Appl Poult Res. 4(3):293–299.
- SAS 2003. User's guide: Statistics, Version 9.1. Vol. 2. S.A.S Institute Cary, NC.
- Schutte JB, De Jong J, Smink W, Pack M. 1997. Replacement value of betaine for DL-methionine in male broiler chicks. Poult Sci. 76(2):321–325.
- Sigolo S, Deldar E, Seidavi A, Bouyeh M, Gallo A, Prandini A. 2019. Effects of dietary surpluses of methionine and lysine on growth performance, blood serum parameters, immune responses, and carcass traits of broilers. J Appl Anim Res. 47(1):146–153.
- Sklan D, Noy Y. 2003. Crude protein and essential amino acid requirements in chicks during the first week posthatch. Br Poult Sci. 44(2):266–274.
- Spek JW. 2018. Standardized ileal digestible methionine and cysteine requirement for broilers. CVB Documentation Report no. 63. Wageningen Livestock Research. p. 50.
- Suzuki R, Pacheco L, Dorigam J, Denadai J, Viana G, Varella H, Nascimento C, Van Milgen J, Sakomura N. 2020. Stable isotopes to study sulfur amino acid utilization in broilers. Animal. 14(S2):S286–S8.
- Taghinejad-Roudbaneh M, Babaee MJ, Afrooziyeh M, Alizadeh B. 2013. Estimation of dietary threonine requirement for growth and immune responses of broilers. J Appl Anim Res. 41(4):474–483.
- Taghinejad-Roudbaneh M, Nazeradl K, Taghavi MA, Afrooziyeh M, Zakerii A. 2011. Estimation of dietary lysine requirement based on broken line and quadratic model analyses with the use performance and immune responses criterion. J Appl Anim Res. 39(4):367–374.
- Vazquez-Anon M, Gonzalez-Esquerra R, Saleh E, Hampton T, Ritcher S, Firman J, Knight CD. 2006. Evidence for 2-hydroxy-4 (methylthio) butanoic acid and DL-methionine having different dose responses in growing broilers. Poult Sci. 85(8):1409–1420.
- Vedenov D, Pesti GM. 2008. A comparison of methods of fitting several models to nutritional response data. J Anim Sci. 86(2):500–507.
- Wada Y, Takeda Y, Kuwahata M. 2017. Potential role of amino acid/protein nutrition and exercise in serum albumin redox state. Nutrients. 10(1):17–27.
- Wen C, Wu P, Chen Y, Wang T, Zhou Y. 2014. Methionine improves the performance and breast muscle growth of broilers with lower hatching weight by altering the expression of genes associated with the insulin-like growth factor-I signalling pathway. Br J Nutr. 111(2):201–206.
- Xie M, Hou SS, Huang W, Zhao L, Yu JY, Li WY, Wu YY. 2004. Interrelationship between methionine and cystine of early Peking ducklings. Poult Sci. 83(10):1703–1708.
- Yoo J, Yi YJ, Wickramasuriya SS, Kim E, Shin TK, Cho HM, Kim N, Heo JM. 2017. Evaluation of sulphur amino acid requirement of male Korean native ducklings from hatch to 21 day of age. Br Poult Sci. 58(3):272–277.
- Zarghi H, Golian A, Nikbakhtzade M. 2020a. Effect of dietary digestible lysine level on growth performance, blood metabolites and meat quality of broilers 23–38 days of age. J Anim Physiol Anim Nutr. 104(1):156–165.
- Zarghi H, Golian A, Tabatabaei Yazdi F. 2020b. Effect of dietary sulphur amino acid levels and guanidinoacetic acid supplementation on performance, carcase yield and energetic molecular metabolites in broiler chickens fed wheat-soy diets. Ital J Anim Sci. 19(1):951–959.
- Zeitz JO, Mohrmann S, Käding SC, Devlikamov M, Niewalda I, Whelan R, Helmbrecht A, Eder K. 2019. Effects of methionine on muscle protein synthesis and degradation pathways in broilers. J Anim Physiol Anim Nutr. 103(1):191–203.