
 ?Mathematical formulae have been encoded as MathML and are displayed in this HTML version using MathJax in order to improve their display. Uncheck the box to turn MathJax off. This feature requires Javascript. Click on a formula to zoom.
Abstract
There has been a significant decrease in genetic diversity on a global scale for several livestock species, including beef cattle. Therefore, the aim of this study was to deliver fine-scale analysis of the genomic structure and to describe the diversity status of six beef cattle breeds, with a specific focus on genomic inbreeding and the trend of effective population size. The genome-wide data of 639 animals belonging to cosmopolitan (Aberdeen Angus, Charolais, Hereford and Limousin) and local (Piedmontese and Romagnola) cattle breeds were included due to their importance for the local and global beef industry in Europe. In addition, the local dual-purpose Slovak Pinzgau was used to extend the study due to increasing interest from beef cattle breeders in Slovakia. The results showed that more than 3% of the Aberdeen Angus, Hereford and Romagnola genomes, less than 1% of the Limousin, Charolais and Slovak Pinzgau genomes and 0.38% of the Piedmontese genome could have been significantly affected by the mating of relatives over the last three generations. The estimates of effective population size indicated a linear decline within each of the analysed populations. The decrease was mainly evident in populations of the Slovak Pinzgau (7.39 animals per generation), Limousin, Piedmontese and Charolais cattle (average 5 animals per generation). Due to the fact that the decrease in effective population size may be accompanied by a decrease in breed competitiveness with regard to a changing production environment, genetic diversity should be continuously monitored to preserve the long-term potential of the analysed breeds.
Decreased diversity across beef breeds is evident
Monitoring genetic diversity is needed to prevent inbreeding depression
Use of genomic data can increase the accuracy of breeding schemes
Highlights
Introduction
In recent decades, there has been a significant decline in livestock genetic diversity for several species, including cattle (Kasarda et al. Citation2017, Citation2019; Kukučková et al. Citation2017). This genetic erosion is most likely a consequence of the specialisation of production favouring the world’s most popular and high-producing breeds. It should be stressed that an intense selection of specific sire lines or maternal families continually leads to a reduction in genetic diversity even today. Consequently, monitoring genetic diversity has a crucial role in the sustainable management of breeding programmes, especially local breeds of dairy and beef cattle.
Nowadays, single nucleotide polymorphism (SNP) microarrays are the most popular and cost-effective tool to identify the genetic predisposition of individuals as well as populations with regard to preserving the gene pool of valuable local animal genetic resources throughout the world. Based on the fact that SNP microarrays capture information about thousands of genetic markers distributed throughout the genome, they can provide comprehensive insight into the genomic structure and diversity status of a particular population. Moreover, the rapid advances in genome sequencing and high-throughput DNA techniques have led to new and more accurate measures of genetic diversity, coancestry and genomic inbreeding (Neuditschko et al. Citation2012; Ferenčaković, Hamzić, et al. Citation2013; Ferenčaković, Sölkner, et al. Citation2013; Coates et al. Citation2018). Most of the methodological approaches for identifying and estimating genetic relationships within and across populations are based on genome-wide average of the estimated number of identity-by-descent (IBD) or alternatively identity-by-state (IBS) fragments among individuals. Particular fragments located in the genome of two or more individuals are IBS if they have identical nucleotide sequence. If such genomic fragments come from a common ancestor without recombination, then they are also IBD because of the common ancestral origin in individuals. Due to factors such as genetic drift, mating of close relatives or selection, IBD alleles in a homozygous state that have accumulated in a particular area of a genome form continuous homozygous stretches with various length described as runs of homozygosity (ROHs) (Mastrangelo et al. Citation2017). In cattle, a ROH with a specific length can reflect the proportion of shared autozygosity inherited from different generations of common ancestors in the past (Howrigan et al. Citation2011; Curik et al. Citation2014). Given this feature, the identification of ROH distributions in the genome is recognised as a key reference method, mainly for calculating genomic inbreeding (FROH) (McQuillan et al. Citation2008).
Genetic distances as the molecular equivalent of the relatedness coefficient are usually expressed as differences between populations in term of the number of mutations or differences in allele frequencies. The genetic distance matrix concerning the identification of paternal lines or maternal families can be depicted simply by coordinate analysis (discriminant analysis of principal components [DAPC] method) or construction of phylogenetic trees resulting from an IBD matrix, Nei’s genetic distances or Wright’s FST index (Neuditschko et al. Citation2012; Chang et al. Citation2015). Cluster analysis represents another way to determine genetic differentiation within and across populations. It allows determining the membership probability of each individual to particular populations or breeds and identifying the degree of admixture among them at the genomic level. Segments of individual genomes that belong to each cluster are usually estimated by a Bayesian algorithm, which allows applying different model-based clustering approaches (with or without admixture, spatial correlation, a priori information of population origin, etc.) (Toro et al. Citation2014; Jombart and Collins Citation2015). Concerning inter-population genetic diversity, genomic-based signatures of recent or ongoing selection and overall breeding history of particular populations, it is also necessary to understand the level of linkage disequilibrium (LD). The extent of LD patterns in the genome may also be used to infer the ancestral and recent effective population size (NeLD) (Flury et al. Citation2010).
Current genetic studies are predominantly focussed on cosmopolitan dairy cattle breeds. Nevertheless, the availability of shared genomic data from various resources allows researchers to apply sophisticated methodologies on other breeds that are the main interest for cattle breeders’ society. Such studies significantly augment knowledge about the regional and global state of cattle biodiversity. This information is crucial to conserve specific genomic segments of breeds while simultaneously improving their performance. Aberdeen Angus, Charolais, Hereford, Limousin, Romagnola and Piedmontese breeds were selected due to their importance for the local and global beef industry and comparison of the gene pool among them. In addition, the local dual-purpose Slovak Pinzgau breed was used to extend the study based on the increasing interest of the Slovakian cattle industry in beef production with higher added value in the form of labelled production. Because of the lack of young fattening cattle in Slovakia, extensive import from countries with a long tradition in the production of young cattle for contract fattening is realised. Due to this, ‘new’ breeds are imported into Slovakia (e.g. Piedmontese and Romagnola). The novelty of the study lies in the fact that this is one of the first studies concerning the gene pool of various beef breeds at the genome-wide level in Slovakia as well as in the Central and Eastern Europe.
This study aimed to deliver fine-scale analysis of the genomic structure and to describe the diversity status of six beef cattle breeds, with a specific focus on genomic inbreeding and the trend of effective population size.
Materials and methods
Analysed populations and quality control of SNP data
For this study, the genome-wide data of 639 animals belonging to seven breeds (Aberdeen Angus, Charolais, Hereford, Limousin, Piedmontese, Romagnola, Slovak Pinzgau) were selected. The dataset comprised new and previously published data. The sample size of each breed and genotyping data sources is provided in Table . The obtained genome-wide data consisted of representative animals; closely related animals were avoided if possible.
Table 1. Source of genome-wide data and sample size of analysed breeds.
The quality control of genotyping data was performed with PLINK 1.9 software (Chang et al. Citation2015). In first step, the consensus map file was prepared to consistently merge datasets from different sources (Table ). Overall, 36909 SNP common loci were available before SNP pruning. Only autosomal SNPs with known chromosomal positions according to the latest bovine genome assembly (ARS-UCD1.2) were left for analyses. The minimum call rate for animals and SNP loci was set to 90%. According to previous studies, the level of minor allele frequency (MAF) can bias subsequent analyses (e.g. Qanbari et al. Citation2010); hence, the MAF threshold was set to 1%. After SNP pruning, the final dataset consisted of 36842 SNP high-informative markers and 634 animals.
Genomic autozygosity and inbreeding coefficient
The observed (Ho) and expected (He) heterozygosity and average frequency of minor allele across SNPs was calculated with PLINK 1.9 software (Chang et al. Citation2015). This software was also used to scan the ROH distribution across the genome of analysed breeds. The ROH stretches were defined as regions with a minimum of 30 SNPs in a run, a minimum length of run 1000 kilobase pairs (kbp), the maximum distance between consecutive SNPs in a window 1000 kbp and a lower density limit of 1 SNP per 100 kbp. The ROH distribution was evaluated separately for five classes, depending on the ROH length (1–2 megabase pair [Mbp], 2–4 Mbp, 4–8 Mbp, 8–16 Mbp and > 16 Mbp). For the class ROH > 16 Mbp, one heterozygous call was allowed. Missing genotypes were enabled for ROH 4–8 Mbp (1 call), ROH 8–16 Mbp (2 calls) and ROH > 16 Mbp (4 calls). The total length of detected ROHs, average ROH length (Mbp) and the sum of all ROHs were calculated separately for each length category and population. Subsequently, the autosome-specific proportion of ROHs longer than 1 Mbp for each breed was determined by the R package detectRUNS (Biscarini et al. Citation2018).
The genomic inbreeding coefficient (FROH) – defined as the proportion of the genome expressed by ROHs with a specific minimum length relative to the total autosomal genome covered by SNP markers (McQuillan et al. Citation2008) – was calculated according to the formula:
where
is the total length of ROHs in the genome of an individual that contains a specific number of continuous homozygous SNPs and
is the length of the autosomal genome expressed by all SNPs. Ferenčaković, Hamzić, et al. (Citation2013) demonstrated that the bovine 50k genotyping microarray is not adequately sensitive to accurately estimate the inbreeding level based on the ROHs 1–4 Mbp. Thus, genomic inbreeding was only calculated for three categories defined by the ROHs with a minimum length of 4, 8 and 16 Mbp (FROH4-8Mb, FROH8-16Mb and FROH>16Mb, respectively).
LD and effective population size
The level of LD across syntenic SNP pairs was expressed by the parameter (Hill and Robertson Citation1968), based on the Pearson’s product-moment correlation coefficient calculated between frequencies of genotypes of two loci using an algorithm implemented in the SNeP programme (Barbato et al. Citation2015). This approach does not require phasing of haplotypes prior to LD analysis and is much more efficient in case of high-density SNP data or whole-genome sequences. LD values obtained by this approach are identical to the results produced by the analysis of phased haplotype frequencies.
The effective size of a real population X (NeLD) with known LD values for a certain interval length was defined as the size of a hypothetical ideal population that in equilibrium would have the same level of LD for the same interval length as found in the real finite population (Makina et al. Citation2015). Ne estimation was based on its functional relationship [E()≈f(c, NeLD)], with
and the recombination rate (c) expressed as the physical position (distance) of SNP markers in the genome (1 centimorgan [cM] ∼ 1 Mbp). This relationship can be presented as follows:
where α is a factor that considers the occurrence of mutations, k is a factor for the inheritance model (e.g. k = 4 in case of biallelic loci), ng is the sample size of gametes (twice the number of individuals selected from the population) and c is the genetic distance between two loci in Morgans. Assuming constant linear growth of NeLD with time (t) represented by past generations, the historical effective population size can be expressed as a function of time and physical genetic distance between two loci (Hayes et al. Citation2003). Longer genetic distances are usually used to estimate the NeLD in recent generations. The NeLD estimates for first nine generations are not considered reliable (Corbin et al. Citation2012); hence, the recent effective population size (NeLD0) and its confidence interval were calculated by linear regression of NeLD estimates for 10–60 generations ago (NeLD10 to NeLD60).
Genomic structure and differentiation within and across populations
The genetic structure of populations and genetic relationships on an intra- as well as inter-population level were estimated based on calculation of Wright’s FST index (Weir and Cockerham Citation1984), Nei’s genetic distances Da (Nei Citation1972), DAPC (Jombart and Ahmed Citation2011) and a model-based Bayesian clustering approach (Pritchard et al. Citation2000). Before analysis of genetic differentiation within and across populations, LD-based pruning was done to remove SNP loci that were in LD with each other using PLINK’s pairwise threshold model (indep-pairwise 50 5 0.05). This procedure removed 29580 SNP loci that exceeded an r2 threshold of 0.05, after which 7108 remained for subsequent analyses.
Wright’s FST index was used mainly to estimate the genetic differentiation degree among analysed populations. Generally, the FST index is a measure of population fragmentation expressing the reduction of heterozygosity in subpopulations due to genetic drift. The FST index can be defined as the correlation between gametes within subpopulations proportional to randomly selected gametes in the total population:
where HT is expected heterozygosity of the total population and HS is the average expected heterozygosity in subpopulations. The FST index calculation was supported by bootstrapping (1000 replications) implemented in the R package StAMPP (Pembleton et al. Citation2013).
Nei’s genetic distance was defined by Nei (Citation1972) as the difference in genetic constitution between the two populations. This theory assumes that if two populations with a small genetic distance between them are similar, they originated with high probability from common ancestors. Nei’s genetic distances among analysed populations were calculated with the StAMPP package (Pembleton et al. Citation2013).
DAPC implemented in the Adegenet package (Jombart and Ahmed Citation2011) was used to determine the degree of genetic differentiation among populations. This multivariate method is usually used to identify and describe clusters that produce genetically related individuals. If the information of the individual’s membership to a certain group or population is unknown, DAPC allows estimating the individual’s origin using a Bayesian-based algorithm. Moreover, this approach allows estimating the probability of an individual’s membership to a particular population and determining the proportion of individual alleles in the population structure. In this study, DAPC was based on the predefined populations according to the animal’s origin. The optimal number of principal components (PCs) reflecting the highest proportion of variance in the database was tested based on the α-score (Jombart and Collins Citation2015).
The model-based Bayesian clustering approach implemented in Structure 2.3.6 (Pritchard et al. Citation2000) was used to analyse the systematic difference in allele frequencies among breeds due to different ancestry and to infer the optimal number of clusters represented by all animals in relation to the individual admixture proportion. The default parameters of an admixture model and correlated allele frequencies based on burn-in period of 10000 followed by 100000 Markov chain Monte Carlo (MCMC) iterations were run to perform analysis. The maximum number of clusters was set to 10, where each run was repeated 10 times. The optimal value of K was selected based on the log probability of delta K using the web-based platform Structure Harvester, according to Evanno et al. (Citation2005).
Results and discussion
Analysed populations and quality control of SNP data
After quality control of SNP data, the database included genotypes for 36842 SNP markers covered 2.50 gigabase pairs (Gbp) of the autosomal genome, with an average spacing of 67.95 ± 72.03 kbp. The expected high genotyping call rate at level 99.54% is consistent with previous studies in cattle (e.g. McClure et al. Citation2018; Sasaki et al. Citation2018) and reflects the fact that the applied microarray is primarily intended to genotype highly informative SNP loci that are uniformly distributed across the genome of major cattle breed types. It has been shown that a bovine microarray can be partially suitable for genotyping genetically related non-model species, but with a significant decrease in the number of successfully genotyped SNPs (Decker et al. Citation2009; Kharzinova et al. Citation2015; Kasarda et al. Citation2017; More et al. Citation2019).
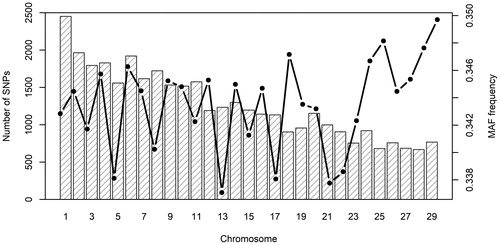
The distribution of SNP loci, as well as MAF frequency, was non-uniform across the autosomal genome (Figure ). The highest number of markers was found on BTA 1 (2452), while the lowest was indicated for autosome 28 (669). Even if the MAF of SNP loci varied across autosomes, the average MAF (0.34 ± 0.13) was relatively homogenous among the analysed breeds and ranged from 0.24 ± 0.15 (Romagnola) to 0.34 ± 0.14 (Charolais). These values are consistent with previous studies in beef cattle (Gautier et al. Citation2010, Mastrangelo et al. Citation2018).
Figure 1. Distribution of single nucleotide polymorphisms (SNPs) (left y axis) and average minor allele frequency (MAF) frequency (right y axis) across autosomes.
The observed (Ho) and expected (He) heterozygosity were calculated to describe the genetic diversity level and quantify the degree of increase in homozygosity. The observed average Ho (0.33 ± 0.16) and He (0.38 ± 0.18) indicated a slight decrease in genetic diversity across the analysed populations. These data were also confirmed with the average Wright’s FIS index (0.08 ± 0.05). A closer look at the populations showed that the decrease of diversity was more evident in Charolais cattle (FIS = 0.16 ± 0.02), while the Piedmontese revealed the highest level of genetic variability (FIS = −0.02 ± 0.02) (Table ). The lower genome-wide genetic diversity observed for cosmopolitan cattle compared to local ones may be a result of more intense selection pressure on particular genotypic combinations controlling desired phenotypic traits and generally higher genomic uniformity of cosmopolitan breeds (Kukučková et al. Citation2017). The state of genome-wide genetic diversity in the analysed breeds should be continuously monitored to avoid a reduction in reproductive ability, response to selection and adaptation potential to changing environmental conditions in the future.
Table 2. Genetic diversity indices for each breed.
Genomic autozygosity and inbreeding coefficient
Distribution of ROH stretches in the genome
ROHs were identified in the genome of all analysed animals in the database. A detailed description of the ROH number and length for each category and breed is given in Table . The highest level of homozygosity was found in the Hereford population, where the ROH stretches covered on average 15.84% (average 396.29 Mbp) of the autosomal genome. On the other hand, the lowest proportion of ROHs was identified in the Piedmontese genome, where the homozygous stretches accounted for only 1.48% (average 36.91 Mbp). The proportion of ROHs detected corresponds to the average number of ROHs within breeds. The highest ROH number was found in the Hereford cattle (70.06), whereas the lowest was identified in Piedmontese cattle (7.83). The observed proportion of genomic autozygosity, mainly in the case of Aberdeen Angus and Hereford, corresponds to previous studies in beef cattle (Purfield et al. Citation2012; Zavarez et al. Citation2015; Lashmar et al. Citation2018). However, such a relatively high proportion of ROHs has been found in several dairy breeds (Purfield et al. Citation2012; Kim et al. Citation2015; Mastrangelo et al. Citation2016). In both dairy and beef cattle, the high level of genomic autozygosity is most likely a result of the intensive selection and repeated use of sires or animals from the same paternal line or maternal families in breeding practice (Peripolli et al. Citation2018). A higher level of genomic autozygosity in Hereford and Angus among cosmopolitan breeds may be the result of historical constitution of particular populations, island origin and thus low genetic fragmentation of founder population (Wright Citation1940). The lower level of observed genomic autozygosity in Limousin and Charolais cattle is mainly comparable to dual-purpose breeds (Marras et al. Citation2015; Szmatoła et al. Citation2016; Kukučková et al. Citation2017).
Table 3. The length (Mbp) and number (in brackets) of homozygous stretches for each run of homozygosity (ROH) category and breed.
Figure illustrates the distributions of ROH stretches (%) with a minimum length of 1 Mbp for each autosome. The results showed that the ROHs distribution, like MAF frequency, is not uniform and depends on the analysed breed. In Aberdeen Angus, Hereford and Romagnola cattle, the largest proportion of ROHs from all stretches detected was found on BTA1 (6.62%, 6.28% and 7.44%, respectively), in Limousin and Piedmontese cattle on BTA12 (9.86% and 9.69%, respectively), in Charolais cattle on BTA6 (6.19%) and in Slovak Pinzgau cattle on BTA26 (9.40%). Given that ROH stretches arise as a result of selection pressure, when only individuals with the desired phenotype are selected for breeding – and thus certain genotype combinations are indirectly selected – the different proportion of ROHs in the genome is most likely a result of different breeding strategies used in grading-up for each breed. In addition to these breed-specific ROH stretches, there were common signals of selection in beef cattle on BTA2, BTA6, BTA7, BTA13 and BTA20 close to the genes responsible for coat colour, muscle development, double muscling, meat tenderness and intramuscular fat content (Moravčíková et al. Citation2019).
Figure 2. Autosome-specific proportion of run of homozygosity (ROH) stretches with a minimum length 1 megabase pair (Mbp).
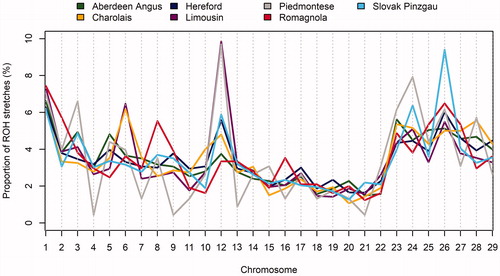
Figure shows the differences in the number of ROH stretches (4–8 Mbp, 8–16 Mbp and > 16 Mbp), depending on the length of the genome covered. The results indicate that the number and length of the genome vary considerably, depending on the breed as well as the evaluated animal. Mészáros et al. (Citation2015) reported that such a difference between individuals is most likely a consequence of their distances from common ancestors.
Figure 3. Relationships between the number and length of run of homozygosity (ROH) stretches (4–8 Mbp, 8–16 Mbp and > 16 Mbp). Mbp: megabase pair.
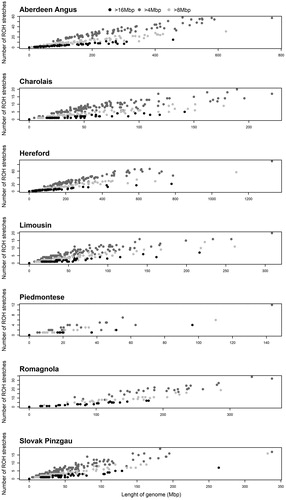
Overall, across all ROH length categories, there were 15008 ROH stretches in the Aberdeen Angus, 18154 stretches in the Hereford, 5010 in the Limousin, 6103 in the Charolais, 540 in the Piedmontese, 5184 in the Slovak Pinzgau and 2910 in the Romagnola genome. One of the most commonly used applications of this analysis is the determination of ancestral or recent inbreeding in a population (Curik et al. Citation2014). Very long autozygous stretches originate from common ancestors born a few generations ago, while short ROHs are likely derived from more distant ancestors or founders of a given breed. However, short ROH stretches can sometimes persist in the population for a very long time mainly due to a low recombination rate (Curik et al. Citation2017). Howrigan et al. (Citation2011) also found that the expected length of autozygous stretches follows an exponential distribution, with a mean equal to 1/2 g Morgans (g is the number of generations from a common ancestor). In cattle, Ferenčaković, Sölkner, al. (2013) revealed that ROH > 1 Mbp date back ∼ 50 generations, > 2 Mbp ∼ 25 generations, > 4 Mbp ∼ 12.5 generations, > 8 Mbp ∼ 6 generations and > 16 Mbp reflects ∼ 3 generations of ancestors.
Across the analysed breeds, the total length of ROH mainly comprised short fragments (1–2 Mbp): Aberdeen Angus – 31.76%, Hereford – 37.82%, Limousin – 40.80%, Charolais – 41.44%, Piedmontese – 42.04%, Slovak Pinzgau – 39.64% and Romagnola – 37.59%. The ROH stretches with length 4–8 Mbp accounted for on average 16.94 ± 1.58% from all of the identified stretches for a particular length category. The lowest proportion across all stretches detected occurred for the longest ROH stretches (> 16 Mbp): Aberdeen Angus – 1.64%, Hereford – 1.98%, Limousin – 2.08%, Charolais – 1.65%, Piedmontese – 2.22%, Slovak Pinzgau – 2.45 and Romagnola – 3.13%. The obtained results showed that on average more than 3% of the Aberdeen Angus, Hereford and Romagnola genomes, up to 1% of the Limousin, Charolais and Slovak Pinzgau genomes and 0.38% of the Piedmontese genome could have been significantly affected by the mating of relatives over the last three generations.
Genomic inbreeding
Assuming that the ROH stretches with different lengths represent genomic autozygosity derived from ancestors coming from different generations (Curik et al. Citation2014), the inbreeding coefficient was calculated for each individual separately based on three ROH length categories (FROH4-8Mb, FROH8-16Mb, FROH>16Mb). Table summarises FROH statistics for individual breeds and length categories. On average, ROH stretches with length 4–8 Mbp accounted for 5.72%, while ROHs > 16 Mbp covered 1.91% of the scanned autosomal genomes. The obtained average value of genomic inbreeding showed that the selection was most intense in the population of Aberdeen Angus, Hereford and Romagnola cattle (recent genomic inbreeding at level 3.5%). These results are comparable with previous studies of Purfield et al. (Citation2012) and Peripolli et al. (Citation2017), who found a similarly high intensity of inbreeding in these breeds. This outcome is the result of non-random preferential mating of sires representing competitive lineages and thus higher probability of co-selection of close relatives in subsequent generations.
Table 4. Genomic inbreeding (%) derived from run of homozygosity (ROH) stretches with different length (4–8 Mbp, 8–16 Mbp and > 16 Mbp) for each breed.
On the other hand, there was a relatively good trend of recent inbreeding (up to 1%) for the Limousin, Charolais and Slovak Pinzgau cattle (Table ). The lowest level of genomic inbreeding was found in Piedmontese cattle (FROH>16Mb = 0.38%). This finding confirms the previous study of Marras et al. (Citation2015), who reported that the majority of the autozygosity of the Piedmontese genome originated from remote ancestors, so the current population is not significantly affected by the increase in inbreeding.
LD and effective population size
Previous studies have indicated that markers with a very low frequency of minor allele may bias LD estimates (Qanbari et al. Citation2010). Therefore, the LD extent was expressed by the parameter which is less sensitive to differences in allele frequencies (Bohmanova et al. Citation2010). Considering that
has limited parametric space and point estimates of effective population size are infinite if
is equal to 0 or 1 (Uimari and Tapio Citation2011), only
values in the range 0.01–0.99 were used to estimate LD and NeLD.
The density of SNP markers in the database was consistent with previous studies that have assessed LD in cattle based on the 50k SNP microarray (Sargolzaei et al. Citation2008). However, the average distance between adjacent SNPs was higher compared to other studies (Flury et al. Citation2010; Beghain et al. Citation2013) mainly due to the reduced total number of SNP markers after SNP pruning. Descriptive statistics of the observed LD level for each population are shown in Table .
Table 5. Average level of linkage disequilibrium in the genome of the studied breeds.
Aberdeen Angus had the highest average value, whereas the Slovak Pinzgau cattle had the lowest observed value (Table ). The obtained LD values between adjacent SNP markers across evaluated breeds were lower compared to other breeds: for example, Swiss Eringer (0.24; Flury et al. Citation2010), Holstein (0.2; Bohmanova et al. Citation2010) or Blonde d´Aquitaine (0.21; Beghain et al. Citation2013). Although the highest proportion of markers with
> 0.3 was found in the Charolais genome (8.71%), this value was significantly lower compared to other breeds: for example, Brown Swiss (31.49%) or Nelore (21.51%) (Kasarda et al. Citation2016). The low level of LD in the genome of the studied breeds may be a consequence of more frequent use of natural services compared to cosmopolitan dairy or dual-purpose breeds. This phenomenon was previously demonstrated in the artificially unselected Italian breed Cinisara (Mastrangelo et al. Citation2014).
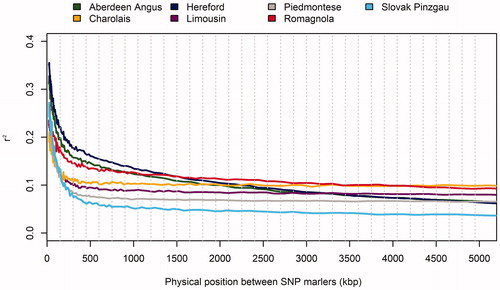
To determine the effect of inter-marker physical distance on LD, all values were analysed according to their physical position in the genome depending on the autosome and the breed. All pairs of SNP markers were ordered into 100 groups according to the distance between them, from 50 to 5000 kbp (bin size 50 kbp). Figure shows a rapid decrease in
values depending on the increasing inter-marker distance. The variability of the LD values within the chromosomes was relatively high, especially in the case of shorter distances (about 250 kb). Arias et al. (Citation2009) found that the recombination distance in the bovine genome decreases directly in proportion to the length of the chromosomes. This phenomenon suggests that the recombination rate increases in proportion to the length of the chromosomes. In other words, longer chromosomes will show lower LD compared with shorter ones (Lee et al. Citation2011). Many studies have also confirmed a decrease in LD depending on genetic distance (Flury et al. Citation2010; Qanbari et al. Citation2010; Kasarda et al. Citation2016).
Figure 4. The relationship between linkage disequilibrium (LD) and inter-marker distance.
The level of LD between markers located close to each other in the genome is usually used to estimate the trend of ancient Ne (50 kb ∼ 150 generations ago), while LD between markers separated by a much higher distance reflects the current effective population size (4000 kb ∼ 12.5 generations ago). However, estimation of NeLD more than 60 generations ago based on the inter-marker physical distances (1 Mbp = 0.01 Morgans) may be significantly biased (Flury et al. Citation2010).
For all evaluated breeds, there was a linear decrease in effective population size over the last 60 generations (average R2 of 0.99) (Figure ). The significant decrease was mainly evident in populations of the Slovak Pinzgau (7.39 animals per generation), Limousin, Piedmontese and Charolais cattle (average 5 animals per generation). In Romagnola, there was a decrease of 2.5 animals per generation. The lowest decrease was detected in the Hereford (1.5 animals per generation) and Aberdeen Angus (1.9 animals per generation) populations.
Figure 5. The trend of effective population size for the analysed breeds over the last 60 generations.
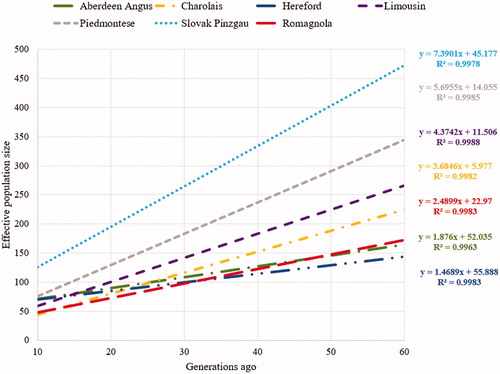
The estimates of current effective population size (Aberdeen Angus, Ne = 52.04; Hereford, Ne = 55.89; Limousin, Ne = 11.51; Charolais, Ne = 5.98; Piedmontese, Ne = 14.06; Romagnola, Ne = 22.97; and Slovak Pinzgau, Ne = 45.18) indicate that the analysed populations are at risk of significant loss of genetic diversity. According to Franklin (Citation1980), populations with less than 50 animals may be considered to be at immediate risk of extinction. Other authors also refer to this value as the threshold for long-term survival of animal populations. For example, Meuwissen (Citation2009) and FAO (Citation2015) stated that a minimum effective population size of 100 individuals is needed to ensure its long-term viability. Specifically, small populations are subject to a much faster loss of genetic variability due to inbreeding or genetic drift compared to populations with high numbers of individuals. In addition, the significant decrease in effective population size as one of the most important genetic diversity parameters may be accompanied by a decrease in breed competitiveness with regard to a changing production environment. Therefore, in order to preserve the long-term genetic potential of the analysed breeds, it is necessary to continuously monitor the trend of effective population size and level of genomic inbreeding.
Genomic structure and differentiation within and across populations
Wright’s FST index and Nei’s genetic distances, which are the most commonly used parameters in population genetics to evaluate the relationships on inter-population levels, were calculated to determine the degree of genetic similarity among the analysed breeds. The low average value of genetic distances observed among populations (Da = 0.07 ± 0.02) indicates a decrease in the genetic differentiation degree among the studied breeds. While particular breeds formed genetically differentiated groups (Figure ), analysis of genetic differentiation based on the Wright’s statistics confirmed that all evaluated populations of cattle may be considered as separate, i.e. genetically differentiated groups (p < .0001). Simply put, genetically similar groups show less variable FST values, while in groups with different genotype frequencies, the FST value increase (Barendse et al. Citation2009). The observed FST values ranged from 0.04 to 0.13 (Table ).
Figure 6. Genetic differentiation within and between evaluated populations based on discriminant analysis of principal components (DAPC) (A), first discriminant function of DAPC (B) and individual membership probabilities suggested by a model-based Bayesian clustering approach (C).
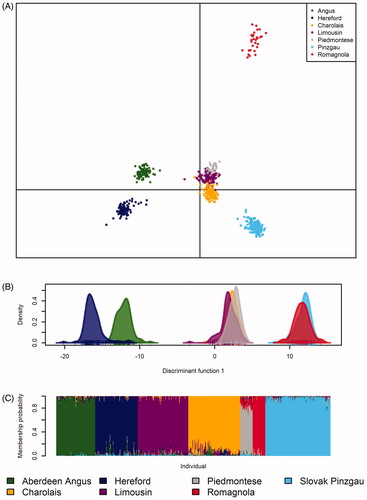
Table 6. Genetic relationships among populations based on the Wright’s statistics (under the diagonal) and Nei’s genetic distances (above the diagonal).
The highest genetic similarity was found between Limousin and Charolais cattle (Table ), two breeds with a French origin. The origin of the Charolais breed is derived from the autochthonous regional breed of yellow cattle distributed mainly in the Charolles area, surrounded by the Seine, Loire, Rhône and Allier Rivers. Although Charolais cattle were originally horned, in recent years selection has focussed on breeding genetically hornless animals. The Limousin breed originated in the Limousin and Marche regions of southwestern France. Since 1900, Limousin have been bred in the direction of beef cattle, with a high slaughter yield, feed conversion efficiency, growth and muscle development. Limousin muscling is intermediate to that of British cattle breeds such as Aberdeen Angus and Hereford and the extreme double muscling found in the European Belgian Blue and Piedmontese breeds. After Charolais, the Limousin cattle is the second most common breed used for commercial crossbreeding in Slovakia.
The high genetic similarity between the Piedmontese and Charolais populations is most likely explained by the fact that in the 19th century Charolais bulls were used in the grading up of Piedmontese cattle (Cattle Network – EAAP Working Group Citation2005). The Piedmontese cattle come from north-western Italy, from the Savoy Alps. The character that has determined the recent genetic evolution of the Piedmontese breed is the development of the so-called ‘double-muscle’ factor, i.e. extremely developed muscular masses not only in the thigh or the buttocks but also in the neck. Due to this factor, Piedmontese cattle have gained the attention of beef cattle breeders around the world, including in North and South America. The Piedmontese breed showed partially higher level of genetic similarity with Slovak Pinzgau cattle compared to the other analysed breeds. The Slovak Pinzgau cattle is one of two national Slovakian cattle breeds and therefore is considered to be an important animal genetic resource. The Slovak Pinzgau belongs to the group of Alpine cattle breeds and is bred mainly for its good longevity, fertility and adaptability on poor production conditions.
The analyses showed that Romagnola and Hereford breeds may be considered the most genetically differentiated populations. In addition, as can be seen in Figure , Romagnola was the most genetically distant group in this study. The Romagnola breed, which is from the Emilia-Romagna region of Italy, belongs to the Podolic group of grey cattle. The Romagnola have mainly been used as a draft breed, but since the mechanisation of agriculture in the mid-20th century, it has been bred mainly for beef production.
There was relatively high genetic distance between the Aberdeen Angus and Hereford cattle, both of which originated from the UK. The Hereford is the most widespread beef cattle breed throughout the world. The Hereford breed originated in the county of Herefordshire, in the West Midlands of England. Many Hereford lines have been used for cross-breeding with other breeds to increase economically desired traits. These endeavours have led to changes in the breed’s genome. However, some lines have been kept separate, and these have retained traits of the earlier breed, such as hardiness and thriftiness. The original Hereford is now treated as an animal genetic resource of value for genetic conservation. The Aberdeen Angus breed, a Scottish breed of small beef cattle, was developed in the early part of the 19th century from the polled and predominantly black cattle of Aberdeenshire and Angus in north-eastern Scotland. Due to easy calving, excellent maternal characteristics, good fertility, longevity and resistance to harsh climatic conditions, it has spread throughout the world.
Relationships among individuals at the intra- and inter-population levels were also evaluated by DAPC. This method is considered to be suitable, especially in the case of a high-density genotyping microarrays, because it allows the analysis of multidimensional data through several dimensions. This method has been successfully applied in various studies focussed on the assessment of population structure in model and non-model animal species (Kasarda et al. Citation2017; Kukučková et al. Citation2017; Moravčíková et al. Citation2017). In the first step of DAPC, 1000 PCs and 10 discriminant functions were used. Subsequently, the test of optimal PC number using α-score (Jombart and Collins Citation2015) was performed to successfully classify individuals into clusters. The results of this analysis showed that the first 60 PCs, which corresponded to 50.13% of the total variability in the dataset, were sufficient to explain genetic relationships among the analysed breeds. The six discriminant functions described 35.51% of the total variability conserved across animals. The first two principal components (PC1 = 10.86% and PC2 = 7.27%) and the first discriminant function are presented in Figure for visualisation. DAPC demonstrated the distribution of individuals into clusters based on their geographical origin, except Piedmontese cattle (Figure ). Consistent with expectations, the high degree of genetic similarity was found between the Charolais and Limousin populations with a French origin and Aberdeen Angus and Hereford cattle from the UK, respectively. The Slovak Pinzgau and Romagnola populations formed separate genetic groups. The Piedmontese population was clustered together with Charolais and Limousin cattle (Figure ) probably as a consequence of cross-breeding between cosmopolitan and local breeds in Italy (Mastrangelo et al. Citation2018).
The Bayesian clustering and the method proposed by Evanno et al. (Citation2005) – which evaluates the second order of change of the likelihood with respect to ΔK – confirmed the local maxima of K = 7, consistent with previous approaches (Figure ). The model-based Bayesian clustering approach confirmed that the frequency of alleles varied consistently within each population and individual membership probabilities reflected the origin and unique gene pool of each breed. The membership probability was less than 95% in Hereford, Limousin, Charolais and Piedmontese genomes (Table ). The analysis revealed the Aberdeen Angus as the breed with the highest contribution to the genetic makeup of Hereford cattle (2.5%). The Limousin cattle gene pool was most affected by Charolais cattle (1.5%) most likely as a result of similar geographical origin. The highest proportion of admixture was found in the Piedmontese genome, where Romagnola cattle was recognised as the breed with the highest contribution to its gene pool (11.6%).
Table 7. The membership proportion of individual breeds.
Conclusions
Current genetic studies are predominantly oriented towards cosmopolitan dairy cattle breeds. Nevertheless, the availability of shared genomic data sources allows researcher to apply sophisticated analyses on other breeds that are the main focus of interest for cattle breeders’ society to enlarge knowledge of the regional and global state of cattle biodiversity and to conserve specific genomic segments in breeds while simultaneously improving their performance.
The observed proportion of genome autozygosity corresponded to recent genomic inbreeding, which are expected to be about 3.5% in populations of Aberdeen Angus, Hereford and Romagnola as a result of non-random preferential mating of sires representing competitive lineages and thus higher probability of co-selection of close relatives in subsequent generations. In the Limousin, Charolais and Slovak Pinzgau breeds, there was a good trend of inbreeding (up to 1%) , with the Piedmontese cattle presenting the lower value (0.38%). However, the trend of effective population size across all breeds has declined over time. Over the past 60 generations, there has been a significant decrease in the number of animals. This decline has been most significant in the Limousin, Piedmontese, Charolais and Romagnola cattle, all of which have a current effective population size of less than 25 individuals. For the Hereford, Aberdeen Angus and Slovak Pinzgau breeds, the analysis revealed an effective population size of approximately 50 individuals. One of the reasons for this significant decrease in the effective size of the populations in the current generation is most likely the repeated use of animals from the preferred paternal lines in breeding practice to keep only desired phenotypic traits. It also follows that in order to preserve the gene pool of these breeds for future generations, it is necessary to continually monitor them. Genetic differentiation analysis confirmed that all evaluated populations may be considered genetically unique, i.e. genetically differentiated groups. In the context of gene flow among populations, an observed degree of genetic admixture may be attributed to common geographical origin of particular breeds.
Ethical approval statement
All institutional and international guidelines for the animal hair samples collection were followed.
Disclosure statement
The authors state that they have no conflict of interest.
Additional information
Funding
References
- Arias JA, Keehan M, Fisher P, Coppieters W, Spelman R. 2009. A high density linkage map of the bovine genome. BMC Genet. 10:1471–2156.
- Barbato M, Orozco-terWengel P, Tapio M, Bruford MW. 2015. SNeP: a tool to estimate trends in recent effective population size trajectories using genome-wide SNP data. Front Genet. 6:109.
- Barendse W, Harrison B, Bunch R, Thomas M, Turner L. 2009. Genome wide signatures of positive selection: the comparison of independent samples and the identification of regions associated to traits. BMC Genomics. 10:178.
- Beghain J, Boitard S, Weiss B, Boussaha M, Gut I, Rocha D. 2013. Genome-wide linkage disequilibrium in the Blonde d'Aquitaine cattle breed. J Anim Breed Genet. 130:294–302.
- Biscarini F, Cozzi P, Gaspa G, Marras G. 2018. detectRUNS: detect runs of homozygosity and runs of heterozygosity in diploid genomes. CRAN (The Comprehensive R Archive Network).
- Bohmanova J, Sargolzaei M, Schenkel FS. 2010. Characteristics of linkage disequilibrium in North American Holsteins. BMC Genomics. 11:421.
- Cattle Network – EAAP Working Group. 2005. Rome (Italy): EAAP; [accessed 2019 Oct 10]. http://www.cattlenetwork.net/Breeds/piemontese.htm
- Chang CC, Chow CC, Tellier LC, Vattikuti S, Purcell SM, Lee JJ. 2015. Second-generation PLINK: rising to the challenge of larger and richer datasets. Gigascience. 4:7.
- Coates DJ, Byrne M, Moritz C. 2018. Genetic diversity and conservation Units: dealing with the species-population continuum in the age of genomics. Front Ecol E. 6:165.
- Corbin LJ, Liu AYH, Bishop SC, Woolliams JA. 2012. Estimation of historical effective population size using linkage disequilibrium with marker data. J Anim Breed Genet. 129:257–270.
- Curik I, Ferenčaković M, Sölkner J. 2014. Inbreeding and runs of homozygosity: a possible solution to an old problem. Livestock Sci. 166:26–34.
- Curik I, Ferenčaković M, Sölkner J. 2017. Genomic dissection of inbreeding depression: a gate to new opportunities. R Bras Zootec. 46:773–782.
- Decker JE, Pires JC, Conant GC, McKay SD, Heaton MP, Chen K, Cooper A, Vilkki J, Seabury CM, Caetano AR, et al. 2009. Resolving the evolution of extant and extinct ruminants with high-throughput phylogenomics. Proc Natl Acad Sci U S A. 106:18644–18649.
- Evanno G, Regnaut S, Goudet J. 2005. Detecting the number of clusters of individuals using the software STRUCTURE: a simulation study. Mol Ecol. 14:2611–2620.
- FAO. 2015. The Second Report on the State of the World’s Animal Genetic Resources for Food and Agriculture. Rome (Italy): FAO Commission on Genetic Resources for Food and Agriculture Assessments; [accessed 2019 Oct 10]. http://www.fao.org/3/a-i4787e/index.html
- Ferenčaković M, Hamzić E, Gredler B, Solberg TR, Klemetsdal G, Curik I, Sölkner J. 2013. Estimates of autozygosity derived from runs of homozygosity: empirical evidence from selected cattle populations. J Anim Breed Genet. 130:286–293.
- Ferenčaković M, Sölkner J, Curik I. 2013. Estimating autozygosity from high-throughput information: effects of SNP density and genotyping errors. Genet Sel Evol. 45:42.
- Flury C, Tapio M, Sonstegard C, Drogemuller C, Leeb T, Simianer H, Hanotte O, Rieder S. 2010. Effective population size of an indigenous Swiss cattle breed estimated from linkage disequilibrium. J Anim Breed Genet. 127:339–347.
- Franklin IR. 1980. Evolutionary change in small populations. In: Soule ME, Wilcox BA, editors. Conservation biology: an evolutionary-ecological perspective. Sunderland (MA): Sinauer Associates; p. 135–149.
- Gautier M, Laloë D, Moazami-Goudarzi K. 2010. Insights into the genetic history of French cattle from dense SNP data on 47 worldwide breeds. PLoS One. 5:e13038.
- Hayes BJ, Visscher PM, McPartlan HC, Goddard ME. 2003. Novel multilocus measure of linkage disequilibrium to estimate past effective population size. Genome Res. 13:635–643.
- Hill WG, Robertson A. 1968. Linkage disequilibrium in finite populations. Theor Appl Genet. 38:226–231.
- Howrigan DP, Simonson MA, Keller MC. 2011. Detecting autozygosity through runs of homozygosity: A comparison of three autozygosity detection algorithms. BMC Genomics. 12:460.
- Jombart T, Ahmed I. 2011. Adegenet 1.3-1: new tools for the analysis of genome-wide SNP data. Bioinformatics. 1:3070–3071.
- Jombart T, Collins C. 2015. A tutorial for discriminant analysis of principal components (DAPC) using adegenet 2.0.0. London (UK): MRC Centre for Outbreak Analysis and Modelling.
- Kasarda R, Moravčíková N, Candrák J, Mészároš G, Vlček M, Kukučková V, Kadlečík O. 2017. Genome-wide mixed model association study in population of Slovak Pinzgau cattle. Agric Conspec Sci. 82:267–271.
- Kasarda R, Moravčíková N, Kadlečík O, Trakovická A, Žitný J, Terpaj VP, Mindeková S, Neupane Mlyneková L. 2019. Common origin of local cattle breeds in western region of Carpathians. Danubian Anim Genet Resour. 4:84–90.
- Kasarda R, Moravčíková N, Mészároš G, Trakovická A, Kadlečík O. 2016. Genetic divergence of cattle populations based on genomic information. Sci Agric Bohem. 47:113–117.
- Kharzinova VR, Sermyagin AA, Gladyr EA, Okhlopkov IM, Brem G, Zinovieva NA. 2015. A study of applicability of SNP chips developed for Bovine and Ovine species to whole-genome analysis of Reindeer Rangifer tarandus. J Hered. 106:758–761.
- Kim J, Cho S, Caetano-Anolles K, Kim H, Ryu YC. 2015. Genome-wide detection and characterization of positive selection in Korean native black pig from Jeju Island. BMC Genet. 16:3.
- Kukučková V, Moravčíková N, Ferenčaković M, Simčič M, Mészáros G, Sölkner J, Trakovická A, Kadlečík O, Curik I, Kasarda R. 2017. Genomic characterization of Pinzgau cattle: genetic conservation and breeding perspectives. Conserv Genet. 18:893–910.
- Lashmar SF, Visser C, van Marle-Köster E, Muchadeyi FC. 2018. Genomic diversity and autozygosity within the SA Drakensberger beef cattle breed. Livest Sci. 212:111–119.
- Lee SH, Cho YM, Lim D, Kim HC, Choi BH, Park HS, Kim OH, Kim S, Kim TH, Yoon D, et al. 2011. Linkage disequlibrium and effective population size in Hanwoo Korean cattle. Asian Australas J Anim Sci. 24:1660–1665.
- Makina SO, Muchadeyi FC, van Marle-Köster E, Taylor JF, Makgahlela ML, Maiwashe A. 2015. Genome-wide scan for selection signatures in six cattle breeds in South Africa. Genet Sel E. 47:1–14.
- Marras G, Gaspa G, Sorbolini S, Dimauro C, Ajmone-Marsan P, Valentini A, Williams JL, Macciotta NP. 2015. Analysis of runs of homozygosity and their relationship with inbreeding in five cattle breeds farmed in Italy. Anim Genet. 46:110–121.
- Mastrangelo S, Ciani E, Ajmone Marsan P, Bagnato A, Battaglini L, Bozzi R, Carta A, Catillo G, Cassandro M, Casu S, et al. 2018. Conservation status and historical relatedness of Italian cattle breeds. Genet Sel Evol. 50:35.
- Mastrangelo S, Saura M, Tolone M, Salces-Ortiz J, Di Gerlando R, Bertolini F, Fontanesi L, Sardina MT, Serrano M, Portolano B. 2014. The genome-wide structure of two economically important indigenous Sicilian cattle breeds. J Anim Sci. 92:4833–4842.
- Mastrangelo S, Tolone M, Di Gerlando R, Fontanesi L, Sardina MT, Portolano B. 2016. Genomic inbreeding estimation in small populations: evaluation of runs of homozygosity in three local dairy cattle breeds. Animal. 10:746–754.
- Mastrangelo S, Tolone M, Sardina MT, Sottile G, Sutera AM, Di Gerlando R, Portolano B. 2017. Genome-wide scan for runs of homozygosity identifies potential candidate genes associated with local adaptation in Valle del Belice sheep. Genet Sel Evol. 49:84.
- McClure MC, McCarthy J, Flynn P, McClure JC, Dair E, O'Connell DK, Kearney JF. 2018. SNP Data Quality Control in a National Beef and Dairy Cattle System and Highly Accurate SNP Based Parentage Verification and Identification. Front Genet. 9:84.
- McQuillan R, Leutenegger A, Abdel-Rahman R, Franklin C, Pericic M, Barac-Lauc L, Smolej-Narancic N, Janicijevic B, Polasek O, Tenesa A, et al. 2008. Runs of homozygosity in European populations. Am J Hum Genet. 83:359–372.
- Mészáros G, Boison SA, Pérez O'Brien AM, Ferenčaković M, Curik I, Da Silva MVB, Utsunomiya YT, Garcia JF, Sölkner J. 2015. Genomic analysis for managing small and endangered populations: a case study in Tyrol Grey cattle. Front Genet. 6:173.
- Meuwissen THE. 2009. Genetic management of small populations: a review. Acta Agric Scand Sect Anim Sci. 59:71–79.
- Moravčíková N, Kasarda R. Kadlečík 2017. The degree of genetic admixture within species from genus Cervus. Agric For. 63:137–143.
- Moravčíková N, Kasarda R, Vostrý L, Krupová Z, Krupa E, Lehocká K, Olšanská B, Trakovická A, Nádaský R, Židek R, et al. 2019. Analysis of selection signatures in the beef cattle genome. Czech J Anim Sci. 64:491–503.
- More M, Gutiérrez G, Rothschild M, Bertolini F, de León FAP. 2019. Evaluation of SNP genotyping in alpacas using the bovine HD genotyping beadchip. Front Genet. 10:361.
- Nei M. 1972. Genetic distance between populations. Am Nat. 106:283–285.
- Neuditschko M, Khatkar MS, Raadsma HW. 2012. NetView: a high-definition network-visualization approach to detect fine-scale population structures from genome-wide patterns of variation. PLoS One. 7:e48375.
- Pembleton LW, Cogan NO, Forster JW. 2013. StAMPP: an R package for calculation of genetic differentiation and structure of mixed-ploidy level populations. Mol Ecol Resour. 13:946–952.
- Peripolli E, Munari DP, Silva MVGB, Lima ALF, Irgang R, Baldi F. 2017. Runs of homozygosity: current knowledge and applications in livestock. Anim Genet. 48:255–271.
- Peripolli E, Stafuzza NB, Munari DP, Lima ALF, Irgang R, Machado MA, Panetto JCDC, Ventura RV, Baldi F, da Silva MVGB. 2018. Assessment of runs of homozygosity islands and estimates of genomic inbreeding in Gyr (Bos indicus) dairy cattle. BMC Genomics. 19:34.
- Pritchard JK, Stephens M, Donnelly P. 2000. Inference of population structure using multilocus genotype data. Genetics portions from molecular data. Mol Biol E. 15:1298–1311.
- Purfield DC, Berry DP, McParland S, Bradley DG. 2012. Runs of homozygosity and population history in cattle. BMC Genet. 13:70.
- Qanbari S, Pimentel EC, Tetens J, Thaller G, Lichtner P, Sharifi AR, Simianer H. 2010. The pattern of linkage disequilibrium in German Holstein cattle. Anim Genet. 41:346–356.
- Sargolzaei M, Schenkel FS, Jansen GB, Schaeffer LR. 2008. Extent of linkage disequilibrium in Holstein cattle in North America. J Dairy Sci. 91:2106–2117.
- Sasaki S, Yoshinari K, Uchiyama K, Takeda M, Kojima T. 2018. Relationship between call rate per individual and genotyping accuracy of bovine single-nucleotide polymorphism array using deoxyribonucleic acid of various qualities. Anim Sci J. 89:1533–1539.
- Szmatoła T, Gurgul A, Ropka-Molik K, Jasielczuk I, Ząbek T, Bugno-Poniewierska M. 2016. Characteristics of runs of homozygosity in selected cattle breeds maintained in Poland. Livest Sci. 188:72–80.
- Toro MA, Villanueva B, Fernández J. 2014. Genomics applied to management strategies in conservation programmes. Livest Sci. 166:48–53.
- Uimari P, Tapio M. 2011. Extent of linkage disequilibrium and effective population size in Finnish Landrace and Finnish Yorkshire pig breeds. J Anim Sci. 89:609–614.
- Weir BS, Cockerham CC. 1984. Estimating F-statistics for the analysis of population structure. Evolution. 38:1358–1370.
- Wright S. 1940. Breeding structure of populations in relation to speciation. Am Nat. 74:232–248.
- Zavarez LB, Utsunomiya YT, Carmo AS, Neves HHR, Carvalheiro R, Ferenčaković M, Pérez O'Brien AM, Curik I, Cole JB, Van Tassell CP, et al. 2015. Assessment of autozygosity in Nellore cows (Bos indicus) through high-density SNP genotypes. Front Genet. 6:5–8.