
Abstract
This study aimed to evaluate consumers’ perception of beef appearance in two photographic camera configurations and the images’ relationships with the willingness to purchase (WTP) and consumer characterisation. Photographic surveys were used to evaluate the visual perception of beef colour, visible fat, and overall appearance. This information was then related to WTP and consumer segmentation. A cumulative model for perception, logistic regression for WTP, and cluster were used for data analysis. The automatic configuration reaches the highest probability in visible fat (p < .05) and overall appearance (p < .05) but not for colour (p > .05) compared to the manual configuration. Consumers’ WTP was affected by visible fat and overall appearance (p < .05) regardless of camera configuration (p > .05). The highest WTP probability (>.8) was scored on a hedonic scale for visual fat and overall appearance. The cluster analysis showed consumers’ preferences related to beef fat, colour, and WTP. This research could provide important information to the beef-chain system to anticipate beef consumer preferences. Additionally, the evaluation of beef consumers’ perception through image could be a practical tool to identify clusters and specific beef preferences to custom-make a beef with high acceptance probability.
Pictures anticipate the consumer’s perception.
Beef consumers focussed on visible fat and overall appearance to answer the purchase decision.
Beef fat, appearance, and colour differentiate consumer’s preferences.
HIGHLIGHTS
Introduction
The importance of beef as a nutritional food is based on its protein, fat, vitamin, and mineral content (Scollan et al. Citation2006) as part of a balanced diet. Cocking et al. (Citation2020) reported that European adults who consume between 75 and 211 g/d of meat could cover between 12% and 17% of their daily energy requirements, 29% and 41% of protein, 23% and 28% of monounsaturated fatty acids, 11% and 21% of polyunsaturated fatty acids, 4% and 38% of B vitamins, 5% and 50% of D vitamins, and from 16% and 13%, 27% and 23%, and 19%, and 36% of Fe, K, and Zn requirements respectively. However, the beef nutrient supply is not linearly related to consumers’ perception and expectations, as reported by Font-I-Furnols and Guerrero (Citation2014).
Consumers' perceptions and attitudes towards beef form a complex issue, and it is related to meat's intrinsic and extrinsic characteristics (Grunert et al. Citation2004). Regarding this, Henchion et al. (Citation2017) ranked beef consumers' perception in three groups: searching, experience, and credence attribute. The two-last consumer' perception groups are out of the scope of this research. On the contrary, searching attributes has a beneficial industry interest due to the relationship between beef and their influence on consumers' perceptions and purchasing decisions, especially concerning attributes related to colour, visible fat, and appearance (Troy and Kerry Citation2010; Font-i-Furnols and Guerrero Citation2014).
The beef colour attribute is related to muscle fibre type and myoglobin concentration (Joo et al. Citation2013). Muscle fibre has a low chance of modification (Aalhus et al. Citation2009). On the contrary, myoglobin's beef colour influence is associated with production systems, slaughter, and beef storage conditions (Troy and Kerry Citation2010). These aspects can be manipulated through the beef chain production.
According to Mancini and Hunt (Citation2005), there are three main colours depend on myoglobin oxidation and ligand in haem ring's sixth position. After slaughter and before the exposure of muscle to oxygen, the first state is a red-purple colour, called deoxy-myoglobin, produced as a result of no ligand at the sixth coordination haem site. The second myoglobin state is the oxymyoglobin state, caused by oxygen-binding in the haem group's sixth position, which produces a cherry colour that consumers interpret as fresh beef. The last condition is metmyoglobin. This state occurs because of iron oxidation and has a brown colour associated with spoiled beef (Troy and Kerry Citation2010).
Regarding consumer perception, the marbling score plays an important role, as reported by Henchion et al. (Citation2017). Beef intramuscular fat formation and composition are complex processes related to production systems, genetics, nutrition, age, slaughter, growth rate, and sex. All of these conditions modify the cellular processes of adipogenesis and lipogenesis and could be manipulated across rumen bio-hydrogenation and gene expression through diet in pre- and post- natal calf life (Ladeira et al. Citation2016). The balance in the lipogenesis/adipogenesis process attracts the researchers’ attention because it has an impact on visible fat (Torrescano-urrutia et al. Citation2017) and finally, in marbling score as indicated by Teixeira et al. (Citation2017) and Ladeira et al. (Citation2018).
The relationship between beef colour, visible fat, and beef appearance offers the possibility to use an image to capture consumer preferences and take actions to improve beef quality. In this context, Cortez-Passetti et al. (Citation2017) applied photographs to evaluate beef consumer acceptability/wholeness in an image sequence related to days of steak fabrication. They concluded that random image presentation could be an appropriate methodology for standardised consumer evaluation. Likewise, Chan et al. (Citation2013) indicated that consumer evaluation of the degree of beef doneness did not report differences between photographic and steak assessment and concluded that photographs could be a reproducible tool for doneness degree assessment due to the effect of doneness based on beef colour. Likewise, Giaretta et al. (Citation2018) and Morales et al. (Citation2013) reported successfully used photographic evaluations and image analysis as a rapid tool for marbling evaluation and consumer marbling perceptions, respectively.
Beef colour and visible fat are described as two of the principal beef attribute that consumers use to interpret beef freshness and participate in the psychologically-based consumer purchase decision (Font-i-Furnols and Guerrero Citation2014; Henchion et al. Citation2017). In this context, the possibility of application and validation of photography evaluation to identify and anticipate beef consumer preferences allows the opportunity of applying animal science manipulation through beef chain production to produce steak with a high likelihood of consumer acceptance.
Therefore, this study aimed to evaluate the consumer perception of beef appearance through photograph evaluation and their relationship with the probability of beef acceptance.
Materials and methods
The Ethics Committee approved the research protocol for Animal Research of Universidad de Antioquia in session 116/2018.
Consumers’ perceptions of beef quality
Animals and sample collection
In non-consecutive days, between 15 to 20 steers were chosen by convenience sampling and slaughtered until 200 steers were obtained for the final sample. After two days, carcases were shipped refrigerated to retail facilities where they were aged for six days at 4 °C and then divided into primary cuts.
Muscle samples of longissimus thoracis were collected individually. A total of 600 g of muscle were removed from the left carcase between the 12th and 13th rib. Each sample (one for each steer) was divided into five raw steaks (25 mm each) and trimmed of all subcutaneous and extraneous fat. One steak was chosen for a photograph (as described in the next section), and the others were stored at −80 °C in a vacuum package for posterior analyses.
Photography of raw steak samples and image processing
Photographs were taken using a D65 fluorescent light as standard illumination in this experiment. A Canon PowerShot SX60HS camera equipped with a 33 mm lens and mounted on a photographic stand was used for taking the steak images. The camera was fixed perpendicularly to the surface of the steak with a focal distance of 18 cm.
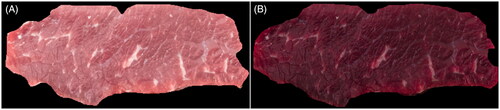
Each steak photograph was taken in two camera configurations (Figure ). The first photographic mode was an automatic camera configuration. This mode adjusted photographic parameters according to the fixed illumination. The second mode was a manual camera configuration with an ISO of 1600; this configuration was chosen because it allowed for better saturation of white pixels in the image, thus enhancing visual identification of marbling (Giaretta et al. Citation2018).
Figure 1. Manual (A) and Automatic (B) configuration camera mode.
The steak images were processed by ImageJ® software (Schneider et al. Citation2012). All pictures were handled to crop all subcutaneous fat that remained in the image, and the background was removed to standardise the pictures against a black background. The image analysis included the identification of values for red, green, and blue colour channels as indicated by Larraín et al. (Citation2008).
Evaluation of consumer’s perception
The study questioned consumers’ perceptions about steak colour that was evaluated as visual colour preference, visible fat related to the amount of intramuscular fat (marbling) observed in the picture, and the overall appearance evaluated as general approval of the image by the consumers. All perception variables were assessed via a modified 5-point Hedonic scale (AMSA Citation2016) which 1 was related to categories ‘Dislike very much’, 2 with ‘Dislike’, 3 ‘Neither Like or Dislike’, 4 ‘Like’, and 5 with ‘Like very much’. Consumers also were asked if they would be willing to buy the raw steak and could answer with a dichotomous yes or no response.
Intramuscular fat determination
After the photographic process, all samples were submitted to intramuscular fat determination based on the Soxhlet method using SoxtecTM (Anderson Citation2019) solvent extraction systems (FOSS Avanti automated extraction systems). Samples were thawed at 4 °C by 24 h. Later, each sample was ground and homogenised in a commercial food processor (HC150B 1720 ± 15% rpm). Subsequently, 3 g of homogenised samples were taken and submitted first to acid hydrolysis (Chloride acid 4 N) and then washed with hexane analytical grade. The extracted dry fat was used to estimate the intramuscular fat proportion in the sample.
Design and application of consumer’s perception survey
The survey was designed to capture relevant information regarding consumers’ socio-economic and demographic characteristics.
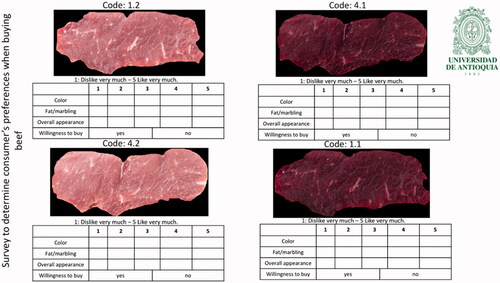
Each survey format had four beef pictures corresponding to randomly assigned two samples and two photographic camera configurations. Consumers evaluated their perceptions using a hedonic scale as described above. Each sample had been previously classified (Barragán-Hernández et al. Citation2019) as low-fat content (0.37% to 2.8%) or high-fat content (>2.8% to 5.9%). Therefore, the same survey evaluated a low- and high-fat sample in two photographic configurations (Figure ). All pictures were codified to prevent bias in the survey response.
Figure 2. Beef consumer visual perception format.
According to different consumer socioeconomic levels, the survey sample was estimated based on population reports (Mejía-Arango et al. Citation2016). This information allowed us to apply proportional stratified sampling (Alinda et al. Citation2016; Enciso et al. Citation2016), resulting in 400 surveys distributed over a range of population socioeconomic statuses.
Surveys were applied on non-consecutive days in order to maximise beef consumer representation (Xue et al. Citation2010). They were implemented in the retail meat area inside of market facilities to guarantee that the surveyed individual was a beef consumer (Enciso et al. Citation2016). Each surveyed individual was asked about their willingness to participate in the survey and provide informed consent. A beef by-product was given to the participant as compensation for participation in the study.
Data analysis for consumer’s perception
The survey responses were tabulated and stored on an Excel® spreadsheet for their review and data mining. Seven surveys were removed in which (data not presented) the consumers answered never consumed beef because of health issues and/or vegetarian-based beliefs in food consumption.
The hedonic data analysis was developed using an analysis of variance in a mixed model considering the photographic configuration (automatic and manual) as a fixed effect and the supermarket location and the consumer as a random effect. The analysis considered a cumulative model with logit link function for the hedonic response on an ordinal scale, where P(Yi ≤ j) calculates the likelihood that i belongs to j category or lower with i observations and j categories). This analysis was applied using the clmm function in the Ordinal package in the software R-Project (Christensen Citation2018).
Relationship among image perception, consumer characterization, and beef acceptance
Logistic regression evaluated the purchase decision (yes or no) and their relationship with pathographic camera configuration, visible fat, beef colour, and overall appearance. The analysis was developed using a generalised linear mixed-effect model and logit function as a residual link. The model considered the picture configuration mode and hedonic response related to visible fat and overall appearance as a fixed effect and the supermarket location and the surveyed individual as a random effect. The analysis examined a saturated model to assess the relevance of fixed effects and their interaction by estimating restricted maximum likelihood. Models were evaluated according to the likelihood ratio and the Akaike and Bayesian criteria (Zuur et al. Citation2009; Cayuela Citation2012). Logistic regression was develop using the glmer function in the lme4 package (Bates et al. Citation2015) in the software R-Project.
Data from camera configuration with a high rate of consumers’ perceptions and willingness to purchase were subjected to cluster analysis to segment beef consumer visual preference. The cluster analysis was performed using Hierarchical Clustering on Principal Components by HCPC function in the FactoMiner package (Lê et al. Citation2008). Clusters were applied as a fixed effect using an analysis of variance ANOVA to identify differences in image colour channels (red, green, and blue) and intramuscular fat percentage.
Results and discussion
Beef consumer’s perception
The effects associated with the likelihood of colour, visible fat, and overall appearance in consumers’ perceptions of beef based two photographic configurations are shown in Table . Beef colour consumer perception was similar (p > .05) between both picture configurations. Conversely, Automatic or Manual photographic configuration had a different effect (p < .05) on visible fat and overall appearance.
Table 1. Hedonic response probability and standard deviation for colour, visible fat, and overall appearance in consumers’ perceptions of beef shown in two photographic configurations.
The visible fat evaluations in the Automatic picture for Like very much and Like categories achieved the highest probability compare to the same classes in the manual camera configuration. Against this, the automatic camera configuration obtained the lowest cumulative probability in negative classifications Dislike very much and Dislike with 0.28 compared to 0.36 in the manual configuration. Consumers gave the highest rating in positive perception for the Automatic mode with 0.524 compared to 0.463 in the manual approach for overall appearance. The negative categories of perception Dislike very much, and Dislike received the lowest probability associated with the beef photos evaluated in the automatic mode with 0.306 probability against 0.36 in the manual mode.
Contrary to the results in this research, Carpenter et al. (Citation2001) reported that consumers discriminated against the beef colour when it is affected by packaging in different modified atmospheres. Better ratings for packaging that produced a cherry-red colour and lower rating for packing of the beef brown colour were found. Similarly, Cortez-Passetti et al. (Citation2017) stated that consumers could differentiate the effects of beef permanence in retail situations and the influence of cattle diet in the beef prone to spoilage through beef colour change and visual appearance over time.
The lack of differences in consumers' perceptions of beef colour regardless of photographic configuration could be associated with the absence of important variations in factors influencing beef colour, such as diet, slaughter, sex, and storage, as Mancini (Citation2009) reported. Likewise, Merlino et al. (Citation2018) confirmed that beef colour is not an important intrinsic clue when consumers purchase beef in reputable supermarkets or beef retailers due to the standardised manipulation process.
Visible beef fat was reported as an important beef searching attribute described by Henchion et al. (Citation2017). In this study, the automatic mode yielded the highest probability of better rate the visible beef fat and the overall appearance. Similar to this study, Flowers et al. (Citation2019) ranked both visual beef appearance and marbling as two of the most important attributes for European Union consumers in an online survey (n = 1,021) and taste panels (n = 95). In contrast to these results, Banović et al. (Citation2016) stated that beef images' consumer ratings were negatively affected by visible subcutaneous-fat and marbling.
Association among the perception, purchase decision, and consumer’s classification
The probability of purchase decisions associated with visible fat and overall appearance in the logistic regression model is presented in Figure . The photographic camera configuration did not affect (p > .05) the probability of consumer purchase decisions and ranged from 0.523 to 0.675 for both the automatic and manual camera modes.
Figure 3. Probability of purchase (no = 0, yes = 1) in the logistic regression model for visible fat and overall appearance in consumers’ perceptions of beef for two photographic configurations.
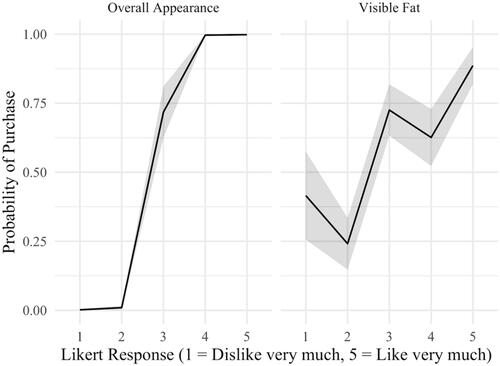
The perception of beef visible fat influenced (p < .05) the willingness to purchase as shown in the survey. The highest probability to buy (0.886) was related to the hedonic category Like very much. There was no difference between Like and Neither Like or Dislike with probabilities of 0.626 and 0.725, respectively. However, different with respect to the categories Dislike very much and Dislike in which the likelihood of purchase was 0.416 and 0.241, respectively. In contrast, Banović et al. (Citation2016) described the effects of visible fat on consumers' choices. They stated that beef with low-fat had a higher frequency of choice than high-fat beef. Morales et al. (Citation2013) reported that beef fat content had minimal influences on consumer preferences.
Overall beef appearance, regardless of photographic configuration mode, influenced (p < .05) the decision purchase. The Like very much and like hedonic categories reached the highest probability in the range of 0.996 to 0.998 without statistical difference. The opposite, categories associated with negative consumer perception, Dislike very much, and Dislike, were related to zero probability of willingness to purchase. Regarding this finding, Henchion et al. (Citation2017) stated that overall beef appearance appeared to be strongly related to beef colour and marbling and all of those parameters influenced consumers’ beef choices.
Flowers et al. (Citation2019) stated that consumers reported visual appearance as one of the most important clues about beef preference without considering the beef price. Likewise, Alinda et al. (Citation2016) reported beef consumers’ willingness to pay in an evaluation in Kampala and Uganda after confirming that fat content, lean colour, and fat colour significantly influenced the purchase model significantly. In the Australian beef consumer context, Ardeshiri and Rose (Citation2018) reported that white-fat, red meat colour, and some marbling were as intrinsic beef factors that influenced a decision to purchase model.
The cluster analysis showed that beef consumers were aggregated into three groups. Cluster 1 was generated by 33.3% of survey participants, and it was characterised by consumers unwilling purchase who had a negative perception of visual the beef appearance. Beef consumers defined the second cluster (36.8% of surveyed individuals) with a willingness to buy and positive perception in beef overall appearance and visible fat. In this cluster, beef colour was considered less important. The third cluster was generated by 29.8% of surveyed consumers who were willing to purchase based on overall appearance, colour, and as the last preference, visual fat attribute was considered (Figure ).
Figure 4. Consumers preference segmentation based on picture beef visual assessment.
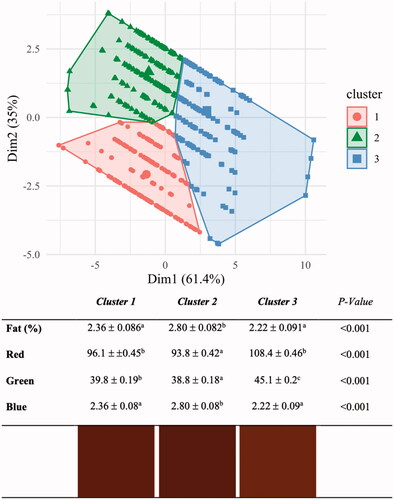
Unfavourable purchase decision in cluster 1 was related to adverse perceptions of visual dark beef qualification and low-fat proportion (2.36% ± 0.086%). On the other hand, cluster 2 associated visual dark beef preference and more intramuscular fat content (2.80% ± 0.082%) with a willingness to purchase the beef based on the assessed picture. Likewise, consumers grouped in cluster three stated a willingness to buy, but their beef visual preferences were associated with a lighter red beef colour and low intramuscular fat content (2.22% ± 0.091%).
Beef consumer segmentation could be associated with age, sex, income, health concerns, and beef intrinsic characteristics as indicated by Realini et al. (Citation2014). The same authors stated that Spanish beef consumers were grouped into three clusters: (1) Health-conscious consumers were characterised mostly by women, (2) lower visible beef fat and bright red beef colour in addition to priced-oriented consumers were associated with the young beef consumer and concerns about beef fat was associated with low-frequency beef consumer and was more motivated by the price rather than beef quality, and (3) quality-oriented consumers as characterised by high visible beef fat preference regardless the beef price.
In this research, clusters were associated with consumers socioeconomics features (data no show) related to sex (Chi2 = 5.014, df = 2, p-value =.08151), income (Chi2 = 18.365, df = 10, p-value =.04911), educational level (Chi2 = 9.7872, df = 10, p-value =.4594), beef frequency consumption (Chi2 = 7.2681, df = 4, p-value = .1224), occupation (Chi2 = 12.98, df = 10, p-value =.2248), and age (Kruskal–Wallis Chi2 =3.9099, df = 2, p-value =.1416). Consumers with income higher than 5–6 and > 6 times the minimum salary formed 37% and 72% of consumer grouped in cluster 2, respectively.
Conclusions
Pictures in automatic camera configuration were rated with high probability in visual beef attributes evaluation. This methodology allowed to understand the relationship between beef colour, visible fat, and overall appearance, and consumer purchase decision. Beef images with high probability in the hedonic evaluation in scale Like very much and Like, especially in attributes related to beef visible fat and overall appearance, received a high proportion of decisions in favour of purchasing.
The picture evaluation of consumers’ perceptions of beef appearance showed that consumers could be clustered into three groups related to unfavourable decisions to purchase and dark-red beef colour, favourable decision to purchase and dark-red beef colour, and high-fat beef or the lighter-red beef colour and low-fat beef.
This research could provide information to the beef-chain systems to direct primary beef production. Beef systems could practice animal science handling to ensure beef fat is higher than 2.8% and dark-red beef colour, beef fat is between 2.0%, and lighter-red beef colour is 2.2% according to consumer beef appearance preference. These conditions could support the consumers’ preferences for beef with a high probability of purchase and would support the beef per capita consumption.
Disclosure statement
No potential conflict of interest was reported by the author(s).
The research protocol was conducted followed the approval of the Ethics Committee of Universidad de Antioquia in session 116/2018.
Additional information
Funding
References
- Aalhus JL, Robertson WM, Ye J. 2009. Muscle fibre characteristic and their relation to meat quality. In: Richard M, Du M, editors. Applied muscle biology and meat science. Boca Raton (FL): CRC Press; p. 97.
- Alinda F, Kavoi M, Migisha J. 2016. Consumer willingness to pay for quality beef in Kampala, Uganda. J Agric Sci Technol. 17(2):59–77.
- AMSA. 2016. Research guidelines for cookery, sensory evaluation, and instrumental tenderness measurements of meat [Internet]. Champaign (IL): American Meat Science Association. http://www.meatscience.org.
- Anderson S. 2019. Soxtec: its principles and applications. In: Luthria DL, editor. Oil extraction and analysis: critical issues and competitive studies. New York (NY): Taylor & Francis; p. 11–24.
- Ardeshiri A, Rose JM. 2018. How Australian consumers value intrinsic and extrinsic attributes of beef products. Food Qual Prefer. 65(October):146–163.
- Banović M, Chrysochou P, Grunert KG, Rosa PJ, Gamito P. 2016. The effect of fat content on visual attention and choice of red meat and differences across gender. Food Qual Prefer. 52:42–51.
- Barragán-Hernández WÁ, Mahecha-Ledesma L, Angulo-Arizala J, Olivera-Angel M. 2019. Clasificación de la calidad de la carne bovina mediante el uso de infrarrojo por transmitancia y técnicas multivariadas. XV Encuentro Nacional y VIII Internacional de los Investigadores de las Ciencias Pecuarias (ENICIP). Rev Colomb Ciencias Pecu. 32(Supl):50.
- Bates D, Mächler M, Bolker B, Walker S. 2015. Fitting linear mixed-effects models using lme4. J Stat Softw. 67(1):1–48.
- Carpenter CE, Cornforth DP, Whittier D. 2001. Consumer preferences for beef color and packaging did not affect eating satisfaction. Meat Sci. 57(4):359–363.
- Cayuela L. 2012. Modelos lineales mixtos (LMM) y modelos lineales generalizados mixtos (GLMM) en R. Barcelona, España. https://www.docsity.com/es/modelos-lineales-mixtos-lmm-y-modelos-lineales-generalizados-mixtos-glmm-en-r/3990869/.
- Chan SH, Moss BW, Farmer LJ, Gordon A, Cuskelly GJ. 2013. Comparison of consumer perception and acceptability for steaks cooked to different endpoints: validation of photographic approach. Food Chem. 136(3–4):1597–1602.
- Christensen RHB. 2018. Ordinal – regression models for ordinal data. R package version 2018.8-25. https://cran.r-project.org/web/packages/ordinal/vignettes/clm_article.pdf.
- Cocking C, Walton J, Kehoe L, Cashman KD, Flynn A. 2020. The role of meat in the European diet: current state of knowledge on dietary recommendations, intakes and contribution to energy and nutrient intakes and status. Nutr Res Rev. 33(2):1–9.
- Cortez Passetti RAC, Torrecilhas JA, Ornaghi MG, Mottin C, de Oliveira CAL, Guerrero A, del Mar Campo M, Sañudo C, do Prado IN. 2017. Validation of photographs usage to evaluate meat visual acceptability of young bulls fi nished in feedlot fed with or without essential oils. Meat Sci. 123:105–111.
- Enciso K, Burkart S, Charrya A, Rodriguez CDP, Quiceno JJM, Ruiz LR, Solis JFG, Quilac NJV, Lopez NA, Velasco SM, et al. 2016. Consumer preferences and market segmentation for differentiated beef with less environmental impact. Paper presented at Conference on International Research on Food Security, Natural Resource Management and Rural Development organised by University of Natural Resources and Applied Life Sciences (BOKU Vienna), Austria. Vienna, Austria.
- Flowers S, McFadden BR, Carr CC, Mateescu RG. 2019. Consumer preferences for beef with improved nutrient profile. J Anim Sci. 97(12):4699–4709.
- Font-I-Furnols M, Guerrero L. 2014. Consumer preference, behavior and perception about meat and meat products: an overview. Meat Sci. 98(3):361–371.
- Giaretta E, Mordenti AL, Canestrari G, Brogna N, Palmonari A, Formigoni A. 2018. Assessment of muscle Longissimus thoracis et lumborum marbling by image analysis and relationships between meat quality parameters. PLoS One. 13(8):e0202535.
- Grunert KG, Bredahl L, Brunsø K. 2004. Consumer perception of meat quality and implications for product development in the meat sector-a review. Meat Sci. 66(2):259–272.
- Henchion MM, McCarthy M, Resconi VC. 2017. Beef quality attributes: a systematic review of consumer perspectives. Meat Sci. 128:1–7.
- Joo ST, Kim GD, Hwang YH, Ryu YC. 2013. Control of fresh meat quality through manipulation of muscle fiber characteristics. Meat Sci. 95(4):828–836.
- Ladeira MM, Schoonmaker JP, Gionbelli MP, Dias JCO, Gionbelli TRS, Carvalho JRR, Teixeira PD. 2016. Nutrigenomics and beef quality: a review about lipogenesis. IJMS. 17(6):918.
- Ladeira MM, Schoonmaker JP, Rodrigues LM, Swanson KC, Teixeira PD, Duckett SK, Gionbelli MP. 2018. Review: nutrigenomics of marbling and fatty acid profile in ruminant meat. Animal. 12(s2):s282–s294.
- Larraín RE, Schaefer DM, Reed JD. 2008. Use of digital images to estimate CIE color coordinates of beef. Food Res Int. 41(4):380–385.
- Lê S, Josse J, Husson F. 2008. FactoMineR: an R package for multivariate analysis. J Stat Software. 1(1):1–18. https://www.jstatsoft.org/v025/i01.
- Mancini RA. 2009. Meat color. In: Improving the sensory and nutritional quality of fresh meat.Great Abington, Cambridge:Woodhead Publishing Limited; p. 89–110. https://doi.org/http://dx.doi.org/10.1533/9781845695439.1.89.
- Mancini RA, Hunt MC. 2005. Current research in meat color. Meat Sci. 71(1):100–121.
- Mejía-Arango LJ, Estrada CM, Salcedo-Amaya GJ, Higuita JM, Granados JD. 2016. Informe de calidad de vida Medellín. Medellín:Medellín cómo vamos.p 317 .
- Merlino VM, Borra D, Girgenti V, Dal Vecchio A, Massaglia S. 2018. Beef meat preferences of consumers from Northwest Italy: analysis of choice attributes. Meat Sci. 143:119–128.
- Morales R, Aguiar APS, Subiabre I, Realini CE. 2013. Beef acceptability and consumer expectations associated with production systems and marbling. Food Qual Prefer. 29(2):166–173.
- Realini CE, Kallas Z, Pérez-Juan M, Gómez I, Olleta JL, Beriain MJ, Albertí P, Sañudo C. 2014. Relative importance of cues underlying Spanish consumers’ beef choice and segmentation, and consumer liking of beef enriched with n-3 and CLA fatty acids. Food Qual Prefer. 33:74–85.
- Schneider CA, Rasband WS, Eliceiri KW. 2012. NIH Image to ImageJ: 25 years of image analysis. Nat Methods. 9(7):671–675..
- Scollan N, Hocquette JF, Nuernberg K, Dannenberger D, Richardson I, Moloney A. 2006. Innovations in beef production systems that enhance the nutritional and health value of beef lipids and their relationship with meat quality. Meat Sci. 74(1):17–33.
- Teixeira PD, Coelho TC, Carvalho JRR, Oliveira DM, Paiva LV, Gionbelli M, Chalfun-Junior A, Ladeira MM, Chizzotti ML. 2017. Subspecies and diet affect the expression of genes involved in lipid metabolism and chemical composition of muscle in beef cattle. Meat Sci. 133(June):110–118.
- Torrescano-Urrutia GR, Sánchez-Escalante A, Vásquez-Palma MG, Francisco A, David R, Dino V, Investigación C, De Ciad AC, Hermosillo CP. 2017. Estimación Del Grado De Marmoleo De Canales De Bovino Sonorenses Utilizando Diferentes Metodologías: Análisis De Imagen, Evaluación Usda Y Extracción Con Solventes. Rev Ciencias Biológicas la Salud. 19(3):34–39.
- Troy DJ, Kerry JP. 2010. Consumer perception and the role of science in the meat industry. Meat Sci. 86(1):214–226.
- Xue H, Mainville D, You W, Nayga RM. 2010. Consumer preferences and willingness to pay for grass-fed beef: empirical evidence from in-store experiments. Food Qual Prefer. 21(7):857–866.
- Zuur AF, Ieno ENI, Walker NJ, Saveliev AA, Smith GM. 2009. Mixed effects models and extensions in ecology with R. New York:Springer Science + Business Media, LLC.