
 ?Mathematical formulae have been encoded as MathML and are displayed in this HTML version using MathJax in order to improve their display. Uncheck the box to turn MathJax off. This feature requires Javascript. Click on a formula to zoom.
Abstract
The aim of this study is to model the growth samples of four varieties (White, Black, Partridge, Franciscan) of Spanish Utrerana hen breed, which is endangered, by using Brody, Von Bertalanffy, Verhulst, Logistic and Gompertz models. For this purpose, a total of 16,235 weight data observations from 2004 animals reared in free range system were collected. Logistic was the best suited model for predicting the biological growth curve of White variety in both sexes, while Von Bertalanffy was the best fitting model for the rest of individuals of the breed, based on the 5 goodness-of-fit and flexibility criteria: Pseudo-R2, mean squared error, Akaike information criterion, Bayesian information criterion and the biological coherence of the estimated parameters. Black variety was the heaviest, with values of 2605.96 and 2032.61 g (for males and females, respectively) for a parameter, while White variety presented the lowest maturity weight (a = 2442.99 and 1874.24 g, for males and females, respectively). Conclusively, this growth characterisation is essential for the conservation of the Utrerana hen, to search for new market niches and a greater profitability to this differentiated product.
Non-linear models can explain the Utrerana hen growth.
Females reach maturity earlier than males.
Utrerana hen shows a strong sexual dimorphism.
Highlights
Introduction
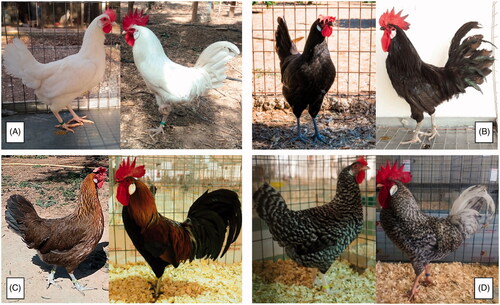
Utrerana hen is an endangered Mediterranean light breed created during the first half of the 20th century in Andalusia (southern Spain) (Orozco Citation1989). It has four different varieties: White, Black, Partridge and Franciscan (Figure ). Its initial productive orientation was as a laying hen, raised on family farms, but the birth of approximately 50% of males on each incubation batch has promoted the traditional use of the meat carcase of this breed for self-consumption (Campo Citation2007). Utrerana poultry breed has shown moderate genetic diversity among the individuals that compose the breed (Macrì et al. Citation2019). Moreover, Utrerana hen and its varieties can be considered as differentiated populations from other Spanish poultry breeds (Vega-Plá et al. Citation2019).
Figure 1. Hen and rooster of each Utrerana variety. A: White; B: Black; C: Partridge; D: Franciscan.
There is a growing interest among consumers in animal products obtained through sustainable production systems, the purpose of which is obtain quality food, with less impact on the environment and human health, considering animal welfare (Barba et al. Citation2016). Alternative forms of farming, involving local breeds, are necessary to avoid the loss of biodiversity, the disappearance of animal genetic resources, the search of economic sustainability and the linkage of population to rural areas (Alderson Citation2018; Toalombo et al. Citation2019). Utrerana breed is adapted to these systems due to its high rusticity and low disease prevalence (Del Castillo Citation1951). Native poultry breeds have a genome that makes them more resistant than commercial hybrid lines to conditions caused by climate change in a specific geographical area (Mpenda et al. Citation2019).
Within the cycle life of animals, the total growth duration can be divided in three phases: an acceleration phase, a deceleration phase, and a stabilisation phase for ripening (Nogales et al. Citation2017). So, growth pattern usually is typically fitted by models with sigmoidal structure. The study of the growth of a breed and how certain factors such as variety or sex influence it, is necessary to establish the potential for meat productivity (Sariyel et al. Citation2017). Growth can be explained through mathematical functions, which could also predict for the age of sexual maturity or the suitable age for commercial slaughter, while helping monitoring general health conditions and nutritional requirements (Kaplan and Gürcan Citation2018).
There are previous bibliographic references on the productive performance of the growth of some local Spanish breeds (Francesch Citation1998; Cubiló et al. Citation1999; Sánchez et al. Citation2000; Muriel Citation2003; Miguel et al. Citation2009; Franco et al. Citation2012; Cajal and Francesch Citation2014). Non-linear growth models (Brody, Von Bertalanffy, Verhulst, Logistic, Gompertz, and others) have been studied in other native breeds, geographically and genetically separated (Yang et al. Citation2006; Rizzi et al. Citation2013; Osei-Amponsah et al. Citation2014; Mata-Estrada et al. Citation2020). In the Utrerana poultry breed, research with the aim to describe the quality-related characteristics and the sensory preference of eggs has been performed (González Ariza, Arando Arbulu, et al. Citation2019, González Ariza, Navas González, et al. Citation2019, González Ariza et al. Citation2021).
Consequently, the present study aimed to determine the best fitting non-linear growth curve models for growth performance of the Utrerana poultry breed, and the characterisation of their biological curve while evaluating the relationship between body weight and age.
Materials and methods
Chicken flock and environmental conditions
The weight-age data for this study were obtained from 2004 individuals reared under free-range conditions during the years 2018 and 2019 in a public hatchery located at the Agropecuary Provincial Centre of Diputación of Córdoba, Spain.
The chickens were hatched during the first half in both years, since this breed describes seasonal laying patterns regarding the period of eggs (González Ariza, Navas González, et al. Citation2019). The chickens were sorted into incubation batches according to age in 20 batches. Feed and water were available ad libitum in all rearing phases (Table ). At hatching, the chicks were placed, sorted per incubation batch, in rearing rooms (5 birds/m2 with electric heaters (Copele LGA, Copele, Murcia, Spain) in each room). Animals had access to the outside (1 bird/m2) from 2 month of age on.
Table 1. Chemical composition of the compound feed used for feeding the chicken batches in the study.
Recording for the biological growth curve
The weights were individually measured: on hatching day, weekly during the first month of life, every 2 weeks from 1 to 3 months and every 28 days from the age of 3 months on. An electronic scale (measurement precision = 0,01 g; CSB-600C, Cobos, Barcelona, Spain) was used to measure weights below 600 g, while a suspended electronic scale (measurement precision = 5 g; Kern CH50K100, Kern & Sohn, Balingen, Germany) was used for animals which exceeded 600 g.
Curve fitting
The data file was purged as described by Lupi et al. (Citation2015). Finally, data of 98.5% of the total of animals were retained for this study. A total of 16,235 weights were kept. A slightly higher number of observations were sampled in females (56.04%) compared to males (44.96%), due to the fact that 749 males were used versus 1255 females in the present study (Table ).
Table 2. Number of animals (n) and weight observations (N) used for each variety in both sexes in the study.
Five non-linear functions were evaluated in the present study: Brody, Von Bertalanffy, Verhulst (a variation of Logistic model; frequently called as Logistic model in the literature), Logistic and Gompertz (). Data were processed with the non-linear regression procedure from the SPSS Statistics for Windows, Version 24.0, IBM Corp. (2016). The results for best-fitted model in each variety were compared with real weight data and animal ages.
The parameter a is defined as the asymptotic or maximum growth response of the adult bird. The parameter b is related to initial weight (hatch weight). The parameter k represents the relative growth rate (exponential growth rate) and indicate the maturity of individuals. Finally, the parameter m shapes the growth curve, thus determining its inflection point (Loaiza-Echeverri et al. Citation2013; Tariq et al. Citation2013; Lupi et al. Citation2015; Iqbal et al. Citation2019). For the choice of the best fit models for each variety and sex, the following criteria were used (Lupi et al. Citation2015; Pizarro Inostroza et al. Citation2020):
The use of the coefficient of determination (R2) in linear regression models determine the quality of the fit of the used model, but in non-linear regression models could overestimate higher values. So, the mathematical approach is Pseudo-R2 and is determined by:
where SS is the sum of squares.
The lowest mean square of the error (MSE) of the studied equation, as a measure that includes the variability of factors not considered by research.
The lowest value of the Akaike information criterion (AIC). This tool can consider changes in the fitness quality and the number of parameters between models:
The lowest value of Bayesian information criterion (BIC), that is a model-order selection criterion:
Biological coherence of the estimated parameters.
The five fitting models used in the present study were ranked considering the goodness-of-fit and flexibility criteria individually. The highest score in the rank was given to the model obtaining the most desirable value for each particular criterion.
Afterwards, as goodness-of-fit and flexibility criteria may differ in terms of which their most desirable values are and what their magnitude is, a combined selection index (ICO) was developed following the premises in Van Vleck (Citation1993) to summarise the position in the rank for each of the goodness-of-fit and flexibility criteria determined for each model. The combined index used (ICO) was as follows:
All criteria were given the same relevance in the ICO, hence, no coefficient was used, that is the proportion of 1:1:1:1 was followed. As a result, the models presenting greater ICO values were those presenting the best-fitting, explanatory and predictive properties for each variety and sex (Supplementary Tables S1, S2, S3, S4 and S5).
Results
A summary of biological curve shape parameters, fitness and accuracy statistics for the different models that were tested across the Utrerana breed and its varieties are shown in Supplementary Tables S1, S2, S3, S4 and S5. The White genotype, reported the best fitting values as verified with all models, excluding Brody model, which presents, in a generalised way, lower values for Pseudo-R2 across all varieties. Brody model overestimates asymptotic weight, in both sexes, however the rest of models showed convergence and very similar adjustment values. Except for White genotype, Von Bertalanffy model fitted growth data better than the rest of studied models. In the White variety, the Logistic model was the most suitable model. Supplementary Tables S6, S7, S8, S9 and S10 show the observed and predicted weights for the best fitting model for both sexes of Utrerana poultry breed and its varieties (Table ).
Table 3. Mathematical description of growth models, biological parameters and growth evaluators.
Table shows the estimated parameters for each variety and sex using the best fitting model in the study of the biological growth curve in Utrerana breed. Males showed a higher body weight in all growth stages, however these differences become clearly noticeable from 45 days of life, as can be seen in Figures and , where growth of Utrerana and its varieties are graphically represented.
Figure 2. Growth curves for both sexes of Utrerana poultry breed predicted with the best fitting model in comparison with the observed data.
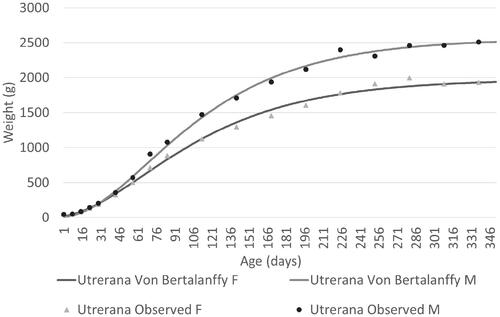
Figure 3. Growth curves for both sexes of Utrerana poultry breed predicted with the best fitting model in each variety in comparison with the observed data.
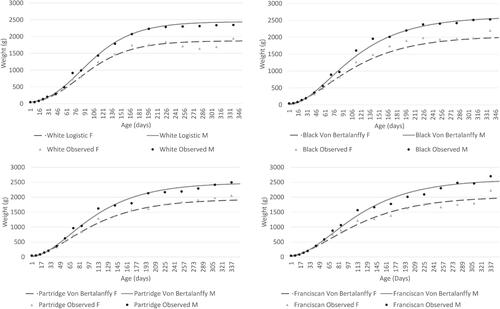
Table 4. Estimated parameters for the best-fitting model for both sexes of Utrerana poultry breed.
Discussion
Hatching weight predicted by the Logistic model in the White genotype (41.95 and 40.71 g for males and females, respectively) have higher accuracy respect to the measured hatching weight that the hatching weight predicted by Von Bertalanffy model in the rest of varieties (Table ). Predictions of hatching weight were between 6.90 and 41.95 g, so slightly some authors supported constraining hatching weight in order to improve fitting (R2) of the data. Barbato (Citation1990) reported that hatching weight should be measured, but not estimated, while others authors suggested to make a data correction: Mignon-Grasteau et al. (Citation1999) suggested to constrain hatching weight within two standard deviations of the mean and Pasternak and Shalev (Citation1994) suggested weighting hatching weight by the inverse of the variance.
Table 5. Estimated hatching weight, inflection weight and inflection age for the best-fitting model for both sexes of Utrerana poultry breed.
Utrerana is a slow-growing breed characterised by clear sexual dimorphism which became evident on the base of the body weight from 45 days onwards. Utrerana can be defined as a light breed because the early age of inflection in the growth curve, the high precocity and the low maturity weight of the individuals, compared with other chicken breeds. Males and females of the White genotype reported lower maturity weights, while for the rest of the varieties (Partridge, Franciscan and Black), both sexes reported more similar values (Table ). Maturity was reached later in the Franciscan genotype (k = 0.013 in males and k = 0.012 in females), while an earliest growth was reported for the White variety (k = 0.021 in males and k = 0.022 in females). A negative correlation between parameters a and k can be observed across the different varieties of the Utrerana breed. Some authors have suggested that there is a high probability that larger and heavier animals are less precocious than smaller and lighter ones (Bathaei and Leroy Citation1998).
Regarding other Spanish breeds, Francesch (Citation1998) collected weights of chickens of Empordanesa Roja, Penedesenca Negra and Prat Leonada breeds, from hatching to 20 weeks of age, obtaining values of 2840, 2660 and 2675 g, respectively. In addition, Cubiló et al. (Citation1999) reported values of 2482 g in Penedesenca Negra breed at 16 weeks. These weights are above those estimated for Utrerana breed for the same age. Although Utrerana poultry breed has been classified as a dual-purpose hen, a lower potential for meat-production than these other breeds has also been reported (Fernández et al. Citation2009). Sánchez et al. (Citation2000) using the Mos hen, a native breed with a clear orientation towards meat production reported higher values for chicken growth (4434 and 3641 g in males and females at 300 days of life).
Contrastingly, it has been reported weights of 1752.60 g (Black variety) and 1740.90 g (brunette variety) of weight in females at adulthood in Sobrarbe hen breed, weights of 2491.96 g in cocks at 32 weeks in Extremeña Azul breed, and values of k of 0.153 and a of 2660.91 g using the Gompertz model for cocks of Castellana Negra breed (Muriel Citation2003; Miguel et al. Citation2009; Cajal and Francesch Citation2014). These results agree with the findings of the present study. Sobrarbe, Extremeña Azul, Castellana Negra and Utrerana hen breeds have been genetically selected towards the egg production in extensive systems, great rusticity and resistance to extreme weather situations. Besides, Castellana Negra and Utrerana poultry breeds have a great geographical proximity and literature indicates that have a common genetic origin (Orozco Citation1989).
Predicted k parameters in the present study agree with those by other authors who used Von Bertalanffy models in slow-growing broilers and native creole chickens (Narinç et al. Citation2010; Mata-Estrada et al. Citation2020). Still these are slightly lower when compared with local breeds or slow-growing genotypes using Logistic and Gompertz models, respectively (Rizzi et al. Citation2013; Aksoy et al. Citation2021). However, Topal and Bolukbasi (Citation2008) obtained much higher values of k in fast-growing broilers using Von Bertalanffy model. The relative growth could be slower in native breeds than in fast-growing lines due to the lower productive selection and the environmental conditions of these breeds.
Inflection age estimated by Logistic model in local chicken of Ghana (Osei-Amponsah et al. Citation2014) are close to the values reported in the present study. Both sexes of Utrerana hen breed present similar results (<4 days between males and females) at the estimated inflection age, in contrast with the results obtained by Mata-Estrada et al. (Citation2020), who reported a difference between males and females of approximately 10 and 8 days for Von Bertalanffy and Logistic models. Therefore, the slaughter age for Utrerana breed must be similar in both sexes. In any case, in native breeds with low inflection weight, the slaughter age must be delayed until the birds reach a weight close to the weight at maturity, seeking in the chicken carcase a differentiated product for the market (Franco et al. Citation2012).
Regarding to the best models for describing growth on poultry, some authors suggested that Von Bertalanffy growth model was the best model to fit growth in local breeds (Yang et al. Citation2006; Mata-Estrada et al. Citation2020). Nevertheless, Atil et al. (Citation2007) suggested that logistic growth model reports the best fit in broilers when compared to Von Bertalanffy and Gompertz models. In any case, the results obtained in the present research are also agree with those reported by Narinç et al. (Citation2017), since they reported that Gompertz was a suitable model to fit the growth curve in slow-growing chickens.
Conclusions
The non-linear growth models used in this study are suitable to describe the biological growth of the Utrerana breed, with Logistic and Von Bertalanffy models standing out as the best fitting models in different Utrerana varieties, in accordance to the goodness-of-fit and flexibility criteria. Utrerana growth curves are very similar to the rest of light breeds, with a clear sexual dimorphism, hence, males of this breed could be profitable from a meat production point of view. The obtained results can be useful for making zootechnical decisions like determine a slaughter age, the nutritional requirements and control the health status of the batch and may support the breeding program for these endangered breeds. Finally, further studies are needed to estimate genetic parameters of the growth curve of this breed and make a genetic selection of individuals based on growth characteristics.
Ethical approval
The study follows the national guidelines and premises described in the Declaration of Helsinki. Protocols applicated were permitted by the regulations of the European Union (2010/63/EU) in their transposition to the Royal Decree-Law 53/2013 and its credited entity the Ethics Committee of Animal Experimentation from the University of Córdoba.
Supplemental Material
Download MS Word (19.7 KB)Supplemental Material
Download MS Word (18.4 KB)Supplemental Material
Download MS Word (18.2 KB)Supplemental Material
Download MS Word (18.9 KB)Supplemental Material
Download MS Word (18.8 KB)Supplemental Material
Download MS Word (17.6 KB)Supplemental Material
Download MS Word (18.3 KB)Supplemental Material
Download MS Word (20.3 KB)Supplemental Material
Download MS Word (19.3 KB)Supplemental Material
Download MS Word (19 KB)Disclosure statement
The authors declare no conflict of interest.
Additional information
Funding
Related Research Data
References
- Aksoy T, Çürek Dİ, Narinç D, Önenç A. 2021. Effects of season, genotype, and rearing system on broiler chickens raised in different semi-intensive systems: performance, mortality, and slaughter results. Trop Anim Health Prod. 53(1):1–11.
- Alderson GLH. 2018. Conservation of breeds and maintenance of biodiversity: justification and methodology for the conservation of animal genetic resources. Arch Zootec. 65(258):300–309.
- Atil H, Grossman M, Takma Ç. 2007. Comparison of growth curve models on average and individual body weights in chickens. Arch Fur Geflugelkunde. 71:1–5.
- Barba C, Fernández-Tomillo L, Jiménez R, Guzmán J, García A. 2016. Environmental ecological value and conservation of local sheep breeds endangered in Andalusia. Arch Zootec. 65(251):445–448.
- Barbato G. 1990. Selection for exponential growth rate at different ages: short term responses. Poult Sci. 69(1):14.
- Bathaei SS, Leroy PL. 1998. Genetic and phenotypic aspects of the growth curve characteristics in Mehraban Iranian fat-tailed sheep. Small Rumin Res. 29(3):261–269.
- Cajal JR, Francesch A. 2014. Productive characterization of Sobrarbe hen. Arch Zootec. 63(241):211–214.
- Campo JL. 2007. Las razas ganaderas de Andalucía. Vol. II. Sevilla, Spain: Consejería de Agricultura y Pesca. p. 433–439.
- Cubiló MD, Tor M, Hernández H, Francesch A. 1999. Comparative study of growth in cocks and capons of Penedesenca Negra breed. ITEA-Inf. 20(1):717–719.
- Del Castillo J. 1951. Las Gallinas Utreranas. Historia y descripción de esta nueva raza. Utrera, Spain: Ediciones Tipografía Moderna.
- Fernández M, Gómez M, Delgado JV, Adán S, Jiménez M. 2009. Guía de campo de las razas autóctonas españolas. Madrid, Spain: Ministerio de Medio Ambiente y Medio Rural y Marino; p. 683–684.
- Francesch A. 1998. Running of the local poultry breeds conservation in Catalonia. Arch Zootec. 47(178):141–148.
- Franco D, Rois D, Vázquez JA, Purriños L, González R, Lorenzo JM. 2012. Breed effect between Mos rooster (Galician indigenous breed) and Sasso T-44 line and finishing feed effect of commercial fodder or corn. Poult Sci. 91(2):487–498.
- González Ariza A, Arando Arbulu A, Navas González FJ, Ruíz Morales FA, León Jurado JM, Barba Capote CJ, Camacho Vallejo ME. 2019. Sensory preference and professional profile affinity definition of endangered native breed eggs compared to commercial laying lineages' eggs. Animals. 9(11):920.
- González Ariza A, Navas González FJ, Arando Arbulu A, Delgado Bermejo JV, Camacho Vallejo ME. 2021. Hen breed and variety factors as a source of variability for the chemical composition of eggs. J Food Compos Anal. 95:103673.
- González Ariza A, Navas González FJ, Arando Arbulu A, León Jurado JM, Barba Capote CJ, Camacho Vallejo ME. 2019. Non-parametrical canonical analysis of quality-related characteristics of eggs of different varieties of native hens compared to laying lineage. Animals. 9(4):153.
- Iqbal F, Eyduran E, Mikail N, Sarıyel V, Huma ZE, Aygün A, Keskin İ. 2019. A Bayesian approach for describing the growth of Chukar partridges. Europ Poult Sci. 83:1612–9199.
- Kaplan S, Gürcan EK. 2018. Comparison of growth curves using non-linear regression function in Japanese quail. J Appl Anim Res. 46(1):112–117.
- Loaiza-Echeverri AM, Bergmann JA, Toral FL, Osorio JP, Carmo AS, Mendonça LF, Moustacas VS, Henry M. 2013. Use of nonlinear models for describing scrotal circumference growth in Guzerat bulls raised under grazing conditions. Theriogenology. 79(5):751–759.
- Lupi TM, Nogales S, León JM, Barba C, Delgado JV. 2015. Characterization of commercial and biological growth curves in the Segureña sheep breed. Animal. 9(8):1341–1348.
- Macrì M, Martínez A, Landi V, Canales A, Arando A, Delgado J, Camacho M. 2019. Genetic diversity of Utrerana chicken breed. AICA. 13:52–59.
- Mata-Estrada A, González-Cerón F, Pro-Martínez A, Torres-Hernández G, Bautista-Ortega J, Becerril-Pérez CM, Vargas-Galicia AJ, Sosa-Montes E. 2020. Comparison of four nonlinear growth models in Creole chickens of Mexico. Poult Sci. 99(4):1995–2000.
- Mignon-Grasteau S, Beaumont C, Le Bihan-Duval E, Poivey JP, De Rochambeau H, Ricard FH. 1999. Genetic parameters of growth curve parameters in male and female chickens. Br Poult Sci. 40(1):44–51.
- Miguel JA, Asenjo B, Ciria J, Calvo JL. 2009. Growth modelling in three chicken genetics types and a commercial line sasso. Effect of the type of housing. ITEA-Inf. 105(1):7–16.
- Mpenda FN, Schilling MA, Campbell Z, Mngumi EB, Buza J. 2019. The genetic diversity of local African chickens: a potential for selection of chickens resistant to viral infections. J Appl Poult Res. 28(1):1–12.
- Muriel A. 2003. Primeros resultados de la producción de capones de la raza Extremeña Azul criados en libertad. ITEA-Inf. 24(1):229–231.
- Narinç D, Aksoy T, Karaman E, Curek D. 2010. Analysis of fitting growth models in medium growing chicken raised indoor system. Trends Anim Vet Sci J. 1:12–18.
- Narinç D, Narinç NÖ, Aygün A. 2017. Growth curve analyses in poultry science. Worlds Poult Sci J. 73(2):395–408.
- Nogales S, Calderón J, Lupi TM, Bressan MC, Delgado JV, Camacho ME. 2017. A comparison of the growth performance between cattle reared in conventional systems and in feral conditions. Livest Sci. 206:154–160.
- Orozco F. 1989. Razas de Gallinas Españolas. Madrid, Spain: S.A. Mundi-Prensa Libros; p. 111–123.
- Osei-Amponsah R, Kayang B, Naazie A, Arthur IM. 2014. Evaluation of models to describe temporal growth in local chickens of Ghana. Iran J Appl Anim Sci. 4:855–861.
- Pasternak H, Shalev BA. 1994. The effect of a feature of regression disturbance on the efficiency of fitting growth curves. Growth Dev Aging. 58(1):33–39.
- Pizarro Inostroza MG, Navas González FJ, Landi V, León Jurado JM, Delgado Bermejo JV, Fernández Álvarez J, Martínez MA. 2020. Software-automatized individual lactation model fitting, peak and persistence and Bayesian criteria comparison for milk yield genetic studies in Murciano-Granadina goats. Mathematics. 8(9):1505.
- Rizzi C, Contiero B, Cassandro M. 2013. Growth patterns of Italian local chicken populations. Poult Sci. 92:2226–2235.
- Sánchez L, Sánchez B, Fernández B. 2000. Preservation program of the Mos chicken breed in Galicia. Arch Zootec. 49(185):77–80.
- Sariyel V, Aygun A, Keskin I. 2017. Comparison of growth curve models in partridge. Poult Sci. 96(6):1635–1640.
- Tariq M, Iqbal F, Eyduran E, Bajwa M, Huma Z, Waheed A. 2013. Comparison of non-linear functions to describe the growth in Mengali sheep breed of Balochistan. Pak J Zool. 45:661–665.
- Toalombo PA, Navas-González FJ, Andrade-Yucailla VC, Trujillo JV, Martinez V, Delgado JV. 2019. Productive and organoleptic characterization of eggs from field hens in the sierra region of Ecuador. Arch Zootec. 68(263):412–415.
- Topal M, Bolukbasi ŞC. 2008. Comparison of nonlinear growth curve models in broiler chickens. J App Anim Res. 34(2):149–152.
- Van Vleck L. 1993. Selection index and introduction to mixed model methods. Boca Raton, FL: CRC Press; p. 481.
- Vega-Plá J, Martínez A, Delgado J, Arando A, Canales A, García N, Gómez-Carpio M, González A, Gonáalez-Felgueroso C, Landi V, et al. 2019. Genetic characterization of Spanish autochthonous chicken breeds using microsatellites. Poster session presented at 37th International Society for Animal Genetics Conference; July 7–12, Lleida, Spain.
- Yang Y, Mekki D, Liv S, Wang LY, Yu JH, Wang JY. 2006. Analysis of fitting growth models in Jinghai mixed-sex yellow chicken. Int J Poult Sci. 5:517–521.