
 ?Mathematical formulae have been encoded as MathML and are displayed in this HTML version using MathJax in order to improve their display. Uncheck the box to turn MathJax off. This feature requires Javascript. Click on a formula to zoom.
Abstract
Data about diet and digestion process of cattle are important for the fine-tuning of the diet and from an environmental point of view. Given the capacity of the near-infrared reflectance spectroscopy (NIRS) to provide easily, quickly and cheap data its ability in predicting dietary and faecal chemical composition, fibre-bound N and total-tract apparent digestibility (ttaD) of beef cattle were tested. The ttaD was estimated using the dietary and faecal undigestible neutral detergent fibre (uNDF) as an internal marker. A total of 172 pool faecal samples and 164 total mixed ration (TMR) samples were randomly collected 24 h post-feeding across the fattening groups of young males and females Charolaise beef cattle. Both TMR and faeces were analysed chemically and through visible/NIRS instrument. Calibration models were developed using a modified partial least squares (mPLS) regression analysis and tested by a leave-one-out cross-validation procedure and the best calibrations were selected based on various parameters including the coefficient of determination of calibration (R2CrV) and the residual predictive deviation (RPD). The overall composition of TMR and faeces were similar to that reported in literature and the coefficient of variation was higher than 12% for most of the parameters studied. The NIRS was able to accurately predict the ADF, nitrogen (N), and ash content in the TMR, whereas in faeces only the ADF prediction was acceptable. The ttaD and total-tract true digestibility of N using the uNDF as an internal marker were inaccurately predicted both in TMR and in faeces (R2CrV ≤0.66; RPD ≤ 1.71).
Near-infrared spectroscopy was not a suitable technology to predict total tract apparent digestibility.
NIRS was able to accurately predict the ADF, nitrogen and ash content in the TMR.
NIRS was able to accurately predict the ADF in faeces.
Highlights
Introduction
The ‘fine-tuning’ and adequacy of the beef cattle diet could be assessed directly in vivo by evaluation of animals’ growth performance, body conditions and faecal characteristics and in vitro through the chemical composition analysis of total mixed ration (TMR) and faeces. Indeed, faecal assessment is the most feasible evaluation to gather information about the diet digestive process effectiveness. It includes the observations of colour, consistency, undigested visible residues, pH and particle size distribution measurement (Kononoff et al. Citation2002; Righi et al. Citation2007; Leiber et al. Citation2015). Dietary and faecal fibre fractions are particularly important since they are related to dry matter (DM) intake, rumination behaviour, nutrient digestibility and passage rate. Moreover, fibre fractions bind the less digestible fractions of dietary nitrogen and include the undigested neutral detergent fibre (uNDF), which is a promising internal marker employed for the in vivo digestibility estimation (Cochran et al. Citation1986; Fustini et al. Citation2017). Indeed, the combined determination of the uNDF in diet and faeces allows the estimation of the total-tract apparent digestibility (ttaD) of several nutrients as demonstrated in cattle and sheep (Fondevila et al. Citation1995; Righi et al. Citation2016, Citation2017). The ttaD allows the estimation of nutrient utilisation when feed intake and faecal output is not provided (Sales and Janssens Citation2003). The in vivo digestibility estimation is one of the parameters describing diet utilisation efficiency which is a result of the interaction between the animal and diet. Indeed, it has been demonstrated in beef steers that 10% of the variation in residual feed intake (an expression of feed efficiency) is explained by the differences in digestion (Richardson and Herd Citation2004).
Nitrogen (N) bound to the fibre fractions (N-NDF and N-ADF) in faeces may be considered as undigested dietary N excreted as organic form. The N bound to the plant cell wall is in fact, poorly or not exploited by the microbial population (Kustantinah et al. Citation2020). Total faecal N is the total amount of N excreted in faeces including undigested dietary nitrogen, microbial and endogenous nitrogen secretion. Its concentration has been demonstrated to positively correlate with N intake in both dairy and growing cattle (Schuba et al. Citation2017).
The difference between the total faecal N content and the undigested dietary N (mainly fibre-bound N determined as N-NDF) allows also to estimate the amount of metabolic N (microbial N and endogenous N secretion) which represents the most soluble N excreted with faeces, chemically described by Van Soest (Citation1994) as N soluble in the neutral detergent solution (N-NDS). The faecal N-NDS is highly influenced by feed quality and digestibility (Schuba et al. Citation2017), and represents, from an agronomical point of view, the source of N rapidly mineralised in soil (Powell et al. Citation2017; Pagliari et al. Citation2020). In fact, decomposition of organic matter (OM) in soil (and consequently rates of organic C and N mineralisation) is affected by the biochemical fractions of decomposing material. Among these fractions, the soluble nutrients are relevant at the earlier decomposition stages while the structural carbohydrate at later ones (Van Kessel et al. Citation2000; Ruffo and Bollero Citation2003). The knowledge of these N fractions allows for a better synchronisation of N mineralisation in soil and crop N demand to maximise the economic effectiveness and reduce mineral N environmental losses (Clivot et al. Citation2017).
Chemical laboratory analyses performed on diets and faeces are reliable but laborious, expensive and time-consuming, whereas the feeding management decisions require quick and inexpensive results (Rahman et al. Citation2015). Near-infrared spectroscopy (NIRS) can overcome these problems being a fast, precise and non-destructive method to predict diets and faecal composition (Jancewicz, Swift, et al. Citation2017).
NIRS is extensively used to analyse the composition of diets, feedstuffs, forages (Rahman et al. Citation2015), pet food (Goi et al. Citation2019; Goi, Manuelian, et al. Citation2020; Goi, Simoni, et al. Citation2020), meat (De Marchi et al. Citation2007; De Marchi Citation2013; Prieto et al. Citation2017), milk and dairy products (Visentin et al. Citation2015) in terms of DM, OM, EE, CP, starch, NDF, ADF, ADL and ash in the different cases. It was also applied on faecal samples with promising prediction of feed intake, diet quality and digestibility in different livestock species (Dixon and Coates Citation2009; Tran et al. Citation2010; Decruyenaere et al. Citation2012; Tolleson and Schafer Citation2014; Lyons et al. Citation2016; Núñez-Sánchez et al. Citation2016; Jancewicz, Penner, et al. Citation2017; Johnson et al. Citation2017; Brogna et al. Citation2018). The NIRS digestibility prediction of DM, OM, CP, NDF, ADF, ADL and starch in faeces obtained using the total collection procedure as a reference method showed encouraging results on beef heifers and steers (Boval et al. Citation2004; Jancewicz et al. Citation2016; Jancewicz, Swift, et al. Citation2017). However, the literature on beef cattle lacks information regarding dietary and faecal N fractions as well as data concerning the NIRS prediction of nutrients ttaD calculated using the faecal uNDF.
Given the promising results of NIRS in predicting the above-mentioned parameters, we hypothesise a possible application of this technology to evaluate beef cattle diets and faeces. The aim of this study was to investigate the visible/NIRS potential in predicting fibre content, fibre-bound N and ttaD, using uNDF as marker, in dietary and faecal samples of Charolaise beef cattle.
Materials and methods
This study was part of the project ‘AntibioticFreeBeef’ which involved 1206 Charolaise beef cattle, 630 females and 576 males, born in semi-extensive farms and imported from France at an average age of 427 d. The trial does not require ethical approval; however, the experiment has been conducted in a responsible manner without disturbing the animals.
Samples’ collection and chemical analysis
A total of 172 pools of faecal samples were randomly selected across the growing groups of 5 farms located in the Veneto region (Northern Italy) over 1 year, together with 164 corresponding dietary samples, more in detail the number of collected samples was 32 from 3 farms, 28 and 48 from the remaining two farms. Particularly, faecal samples were collected and pooled 24 h post-feeding, at 15 and 30 d after arrival at each farm, from a clean floor from male (359.3 ± 49.07 of initial body weight [BW]) and female (352.2 kg ± 47.37 of initial BW) young Charolaise cattle to obtain 5 kg samples. Dietary samples – an adaptation TMR whose ingredients and chemical composition predicted by a ration formulation software are reported in Table – were collected from the feed bunk during the TMR delivery to obtain a 2 kg aliquot.
Table 1. Ingredients and estimated nutrient content of the adaptation diet supplied to beef cattle.
Both TMR and faecal samples have been dried at 55 °C for 72 h, then ground in a Cyclotec mill (Tecator, Herndon, VA) to pass a 1-mm screen. Subsequently, each sample was divided into two aliquots: one was subjected to chemical analysis and the other to spectrophotometric analysis. All the following described parameters were determined on both TMR and faecal samples. The DM content was measured by drying the sample at 103 °C overnight. The uNDF was determined through a 240 h in vitro fermentation using the procedure described in Righi et al. (Citation2017); the rumen fluid was collected at the slaughterhouse from the rumen of 4 cows and processed as described by Simoni, Temmar, et al. (Citation2020) and Simoni, Tsiplakou, et al. (Citation2020). The aNDF, ADF and ADL were analysed according to Van Soest (Citation1994). The aNDF was determined using heat-stable amylase but no sodium sulphite and expressed inclusive of the residual ash. Residual ash was not determined on fibre fractions with exception of ADL. The aNDF and ADF residues in the crucibles were collected and weighted for bound N determination. The N content was determined by the combustion digestion of the sample at 900 °C in excess of oxygen by Dumatherm® (Gerhardt GmbH & Co, Königswinter, Germany) as described by Mihaljev et al. (Citation2015).
The estimated total-tract apparent DMD (ttaDMDe), total-tract apparent NDFD (ttaNDFDe), total-tract apparent ADFD (ttaADFDe), total-tract apparent CPD (ttaCPDe), total-tract apparent N-NDFD (ttaN-NDFDe), total-tract apparent N-ADFD (ttaN-ADFDe) and total-tract apparent ash digestibility (ttaAshDe) were calculated using uNDF of TMR samples and the uNDF of the related faecal samples for each group as described by Righi et al. (Citation2016). The N-NDS was calculated as difference between the total N and N-NDF in faeces. The estimated total-tract true N digestibility (tttrueNDe) was calculated by the adaptation of the equation described by Fustini et al. (Citation2017) as follows:
NIRS spectra collection and calibration development
Visible/NIRS analysis was performed with NIRS DS2500 (FOSS, Electric A/S, Hillerød, Denmark). Thirty gram of dried and ground faecal samples were placed in a large glass FOSS cup (diameter 105 mm, depth 35 mm) at room temperature and scanned from 400 to 2500 nm wavelength with 0.5 nm increment. Each spectrum obtained was an average of 32 sub-spectra collected in different points during the automatic rotation of the cup and recorded as log(1/reflectance). The same procedure was carried out for the TMR samples. Chemometric analysis was performed using WinISI 4 software (Infrasoft International, Port Matilda, PA) through modified partial least squares (mPLS) regression analysis (Osborne et al. Citation1993) to correlate spectral information to reference values using the complete dataset. First, raw spectra underwent some pre-treatments. Several scatter corrective methods (detrending [D]; standard normal variate [SNV]; SNV + D; multiplicative scatter correction [MSC]) were tested to reduce noises and to remove imperfections from the data matrix before data modelling (De Marchi et al. Citation2019), then spectral derivation was applied in combination (0,0,1,1; 1,4,4,1; 1,8,8,1; 2,5,5,1; 2,10,10,1; in which the first digit is the order of the derivative, the second is the gap over which the derivative is calculated, the third is the number of data points used for smoothing of derivative spectra, and the fourth is the number of data points used in the second smoothing) (Shenk et al. Citation1989). To increase the calibration accuracy, spectral outliers were eliminated using the Mahalanobis distance (Global H >3.0), followed by one round of chemical outliers’ elimination using the T-statistic (>3.0). The critical T-statistic value set at 3, means that samples whose predicted value differed more than 3 standard error from the respective reference value were removed (De Marchi et al. Citation2012) before building the final infrared model. The prediction equations obtained were validated using a leave-one-out cross-validation procedure; therefore, for each trait examined, the prediction model was tested using the entire dataset excluding randomly a single sample in each iteration until all samples of the dataset were included once in the validation set. Subsequently, each model was rebuilt, performing three times the cycle of new outliers’ detection and elimination and the cross-validation procedure. The optimal calibration models were identified based on the number of LF selected which minimises the root-mean-square error of cross-validation, small standard error of calibration (SEC) and of cross-validation (SECrV), on the coefficient of determination of calibration (R2C) and of cross-validation (R2CrV), and the residual predictive deviation (RPD) of cross-validation, calculated as the ratio of SD to SECrV to provide a comparison of calibrations’ performance regardless the different units of measurement of the parameters. The values of R2CrV were interpreted according to what reported by Karoui et al. (Citation2006), who stated that a coefficient of determination between 0.66 and 0.81 could give an approximate quantitative estimation of the reference value, between 0.82 and 0.90 gives a good estimation, and values above 0.91 indicate an excellent estimation. A prediction model with an RPD value below 1.9 was considered not suitable for use, between 2 and 2.4 is considered poor and adequate only for a rough screening, whereas an RPD value between 2.5 and 2.9 could be applied for screening purposes and an RPD greater than 3 was considered good for quality control (Williams Citation2014).
Results
Chemical composition and NIRS evaluation of diet
The chemical composition of the TMR fed to the beef cattle is shown in Table and was widely variable as demonstrated by the CV of the different traits evaluated, that was generally higher than 12% with the exception of DM (CV = 1.1%) and N (CV = 8.3%). The diets were characterised by an average aNDF content of 40.2%DM of which 54% was ADF and 10% was lignin and 26% was undigestible. Considering a dietary N content of 2.05% DM, 41.5% was bound to the NDF fraction and 35% was bound to the ADF. The ash content was 7.2% of DM.
Table 2. Average chemical composition of the diets provided to animals of each pen (n = 164).
Table shows the fitting statistics for the NIRS prediction models produced for each compositional trait of the TMR. The number of outliers that were detected ranged from 2 (ADF) to 14 (aNDF), and in general the percentage of samples removed from the primary dataset was below 9% of the total number of measurements for all the attributes. The number of latent factors ranged from 6 (for the parameter uNDF expressed as %NDF) to 12 (for the parameters DM and ADLom expressed on a DM basis). The most selected scatter corrections were D, SNV and SNV + D, and the first derivative was the more frequent applied followed by the second. The best prediction models were obtained for ADF (R2CrV=0.86; RPD = 2.67), N (R2CrV=0.83; RPD = 2.43) and ash (R2CrV=0.82; RPD = 2.36), whose accuracy indicates a good estimation of the reference values; the calibration model with the lowest accuracy was obtained for uNDF expressed as % of NDF (R2CrV=0.52; RPD = 1.44).
Table 3. Fitting statistics of modified partial least squares regression models in leave-one-out cross-validation for chemical parameters in total mixed ration for beef cattle.
Chemical composition and NIRS evaluation of faeces
Faeces composition is reported in Table and is characterised by a large variability likely due to the diet composition. The CV of faeces components was greater than 12% with the exception of DM, aNDF and N (CV = 2.4, 6.9% and 8.7%, respectively), suggesting a good variability of the data necessary to perform NIRS calibrations. The faecal NDF content was 56.4%DM of which 62.2% was ADF, 59.7% was undigestible and 27.2% was lignin. The faecal N content was 2.6%DM of which 27.4% was bound to NDF fraction and 26.9 was bound to the ADF fraction. Thus, the metabolic N in faeces (total faecal N − N bound to NDF) was around 72.2% of the total N. The ash content of the faeces was 62% higher than the dietary content of ash.
Table 4. Average chemical composition of the pre-exsiccated faeces collected from the animals of each pen (n = 172).
Statistical parameters of the prediction equations for beef cattle faeces are reported in Table . No scatter correction or MSC were the more used options and no specific derivatization consistently performed best. Latent factors ranged from 1 (ADLom) to 12 (N) and outliers were ≤7%.
Table 5. Fitting statistics of modified partial least squares regression models in leave-one-out cross-validation for chemical composition in beef cattle pre-exsiccated faeces.
Apparent digestibility parameters
The average ttaD of nutrients is reported in Table . On average, the ttaDMDe was 69%. The ttaNDFDe, ttaADFDe, ttaCPDe, ttaN-NDFDe and tttrueNDe were higher than 50% while only ttaN-ADFDe and ttaAshDe showed mean values under 50%. The lowest variability was observed for ttaDMDe (CV = 11.5%) and the greatest one for ttaN-ADFDe (CV = 35.5%).
Table 6. Average total-tract apparent (tta) nutrients digestibility estimated (De, %) using dietary and faecal uNDF as an internal marker (n of matches= 164).
Statistical parameters of the prediction equations in TMR for beef cattle ttaD are reported in Table . Latent factors ranged from 5 (ttaNDFDe and ttaN-NDFDe) to 12 (ttaDMDe and ttaCPDe) and outliers detected were ≤10% for all the digestibility traits.
Table 7. Fitting statistics of modified partial least squares regression models in leave-one-out cross-validation for total-tract apparent (tta) nutrients digestibility estimated (De, %) using undigestible NDF as a marker in total mixed ration for beef cattle.
Statistical parameters of the prediction equations in faeces for beef cattle ttaD are reported in Table . Latent factors ranged from 2 (ttaADFDe and ttaAshDe) to 9 (ttaN-ADFDe) and outliers were ≤7%.
Table 8. Fitting statistics of modified partial least squares regression models in leave-one-out cross-validation for total-tract apparent (tta) nutrients digestibility estimated (De, %) in cattle faeces.
Overall, the most accurate calibrations for ttaD traits calculated in TMR and faeces were obtained mainly using only SNV scatter correction or combining it with D and with the first derivative as mathematical treatment. All prediction models had a R2CrV≤0.66, being lower for ttaD of nutrients estimated in cattle faeces, and achieved a RPD value from 1.07 to 1.71.
Discussion
NIRS evaluation and prediction models
Average raw absorbance spectra for faeces and TMR is consistent with spectra of TMR samples for dairy cattle (Ki et al. Citation2009) and showed a general trend similar to those of dried plants (Dixon and Coates Citation2009; Yang et al. Citation2017; Figure ).
Figure 1. Average raw spectra of pre-exsiccated faeces and total mixed rations from NIRS DS2500 spectrometer.
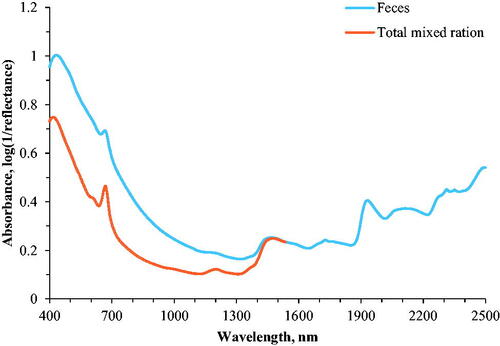
The peaks indicate absorption in the wavelength region related to lipids (1735, 1772 nm –Decruyenaere et al. Citation2009) and carbohydrates (1211, 1446–1513, 2067–2180 nm – Redshaw et al. Citation1986; Miller Citation2001; Decruyenaere et al. 2009), peaks at 2306 and 2346 nm are associated with forage components not digested during rumen fermentation (Dixon and Coates Citation2009), absorption signals observed in the wide peaks from 1446 to 1513 nm and from 2067 to 2180 nm are assumed to be related also to the presence of protein (Manley Citation2014), whereas the absorption band at 1940 nm have been attributed to water (Lucas et al. Citation2008). The difference in absorption between faeces and TMR is prevalent in the visible region, decreasing as the wave number increases until the average spectra perfectly overlap, probably because of the darker colour of the faecal matrix which result in greater absorbance values (Windham et al. Citation2003).
mPLS regression was used to synthesise spectral data to few independent factors which retain most of the spectral information; reduction in spectral interference and standardisation of the variables through first or second order of derivatization and several scatter corrections were performed (Park et al. Citation1998). Moreover, the optimal number of latent factors was selected to avoid overfitting with full cross-validation (leave-one-out method), which verified the stability of the prediction models.
Chemical and NIRS evaluation of TMR
The average chemical composition of the adaptation diet fed in this study was similar to the diet offered to Charolaise bulls described by other authors (Magrin et al. Citation2018; Sgoifo Rossi et al. Citation2019, Citation2020) and was in line with the NRC (Citation2016) recommendation. The only exception was the aNDF content, which was higher compared to the literature but within the ranges recommended by the NRC (Citation2016). It is well known that dietary fibre plays several important roles, maintaining rumen functions and pH, preventing digestive disorders and thus affecting animal performance (Weiss et al. Citation2017; Goulart et al. Citation2020). Interestingly, 35% of the total N in the diet resulted to be N-ADF, considered as unavailable nitrogen (C fraction) within the Cornell Net Carbohydrate and Protein System model as described by Higgs et al. (Citation2015). The amount of uNDF in the diet was similar to the average value of 11.2% DM (or 27.7% NDF) of indigestible NDF found in lactating cows and growing cattle by Huhtanen et al. (Citation2016).
Prediction accuracy for ash was similar to that achieved by Berauer et al. (Citation2020) in forage samples and for ADF by De Boever et al. (Citation1996) in grass silages.
Chemical and NIRS evaluation of faeces
The aNDF and ADF content of faeces was slightly higher in comparison to those reported by other authors on beef heifers (Jancewicz et al. Citation2016) and beef steers (Jancewicz, Penner, et al. Citation2017) which is explained by the greater amount of fibre sources in our diets. The ADL content in this study was similar to that found by Jancewicz et al. (Citation2016), in a study performed on beef heifers fed a forage-based diet consisting of 50:50 grass hay:barley silage diet (on a DM basis). The faecal N content was comparable to that reported by Jancewicz et al. (Citation2016) and Jancewicz, Penner, et al. (Citation2017), although the CP content of the diet was lower in the present trial (12.81 versus 13.5 and 13.4–14.6%DM). This could be due to a lower digestibility of the dietary protein fed in our trial. Additionally, it should be noted that 27.4% of the N content in faeces was N-NDF, and among this, 97% of it was acid-insoluble thus unavailable to the animal. The N-NDS found in our study showed closer values to those found by other authors feeding grasses (63.4%) or legumes (69.3%) forages respectively to beef cattle (Moir and Swain Citation1972). However, in the cited study an addition of 7% was applied by the authors to their results since faecal samples were freeze-dried leading to an underestimation of non-dietary N. Mean faecal uNDF was three times higher than the dietary concentration, and 60% of the mean faecal NDF were indigestible. Consequently, it can be concluded that 40% of the faecal NDF was potentially digestible (pdNDF = NDF − uNDF240; Cotanch et al. Citation2014; Van Amburgh et al. Citation2015). This proportion is higher in comparison to that found on lactating cattle by Righi et al. (Citation2017), who reported 33% of pdNDF in faeces, which may be due to the different intake levels and digestibility which could affect the passage rate (Seo et al. Citation2006). Furthermore, the ratio between uNDF and ADL found in this study is lower than the one reported in the research of Righi et al. (Citation2017) on dairy cattle (2.19 versus 2.84), indicating a deeper exploitation of the fibre. Moreover, the value found in the present work is closer to the coefficient of 2.4 found by Chandler et al. (Citation1980), in feeds further confirming the high digestibility of the dietary fibre.
A good prediction model was developed for ADF, whose R2CrV (0.82) revealed the eligibility for screening purposes according to Boval et al. (Citation2004) and Cozzolino et al. (Citation2002), whereas equations for DM, aNDF, N and ash had an R2CrV between 0.66 and 0.81 indicating a lower accuracy that allows an approximate quantitative prediction. A similar accuracy in ash estimation from faeces was reported in literature both of dairy cattle (Decruyenaere et al. Citation2012) and in sheep (Lyons et al. Citation2016). On the other hand, calibrations for N-NDF, N-ADF, ADLom, EN and uNDF led to unsatisfactory results.
Total-tract apparent digestibility
The mean ttaD of DM and NDF were in line to those reported on Charolaise heifers by De La Torre et al. (Citation2019), while the average ttaADFDe was slightly lower than the ADF digestibility determined in the cited study through the total faecal collection method. On the other hand, Jancewicz, Penner, et al. (Citation2017) and Johnson et al. (Citation2020) found higher DM and CP, while lower ADF digestibility compared to this study. However, the DM, NDF, ADF and CP digestibility values fell within the ranges reported by Jancewicz, Swift, et al. (Citation2017). An experiment performed by Moir and Swain (Citation1972) evaluating the N excretion of cattle and sheep fed different type of forages demonstrated a range between 50% and 89% of true digestibility of N, which is quite similar to our results.
The R2CrV and RPD of ttaD from TMR indicate that prediction models, interpreted according to Williams (Citation2014), are not recommended to be used. Unsatisfactory results have been also obtained by Purnomoadi et al. (Citation1997) for the prediction of DM and ADF in mixed rations for dairy cattle, probably related to the narrow range of the reference values used.
The prediction equations developed for all the ttaD parameters through faecal samples and also for tttrueNDe using faecal spectra revealed R2CrV and RPD values below the threshold to consider a model fair enough to be used (Karoui et al. Citation2006; Williams Citation2014), resulting in poor accuracy and unsatisfactory ability to estimate the reference values as also reported for NDF and ADF digestibility by Jancewicz, Swift, et al. (Citation2017). Similarly, NIRS showed low accuracy in predicting DM digestibility measured by the alkane technique (Garnsworthy and Unal Citation2004) as well as in predicting faecal indigestible and digestible fibre fractions measured by uNDF determination in lactating cows faeces (Righi et al. Citation2017).
Conclusion
Despite the NIRS is a promising technology used worldwide, it has failed in this study to estimate the proportion of most of the considered chemical components in TMR and faeces. A good estimation of the ADF was found in both sample typologies, while N and Ash were accurately predicted only in TMR. The NIRS prediction of the N bounded to the fibre fraction is inaccurate and the predictions of the ttaD of nutrients as well as total-tract digestibility of N estimated using the uNDF as internal marker are not recommended, given their low accuracy in both TMR and faeces.
Acknowledgements
The authors kindly acknowledge Dr. Mikenzie Hanlon and Dr Rosario Pitino for the technical assistance. The authors would like to thank Associazione Zootecnica Veneta (AZoVe, Cittadella, Italy) and farm owners for the support in the sampling activities.
Disclosure statement
None of the authors has a financial or personal relationship with other people or organisations that could inappropriately influence or bias the content of this paper.
Data availability statement
The data that support the findings of this study are available from the corresponding author upon reasonable request.
Additional information
Funding
References
- Berauer BJ, Wilfahrt PA, Reu B, Schuchardt MA, Garcia-Franco N, Zistl-Schlingmann M, Dannenmann M, Kiese R, Kühnel A, Jentsch A. 2020. Predicting forage quality of species-rich pasture grasslands using vis-NIRS to reveal effects of management intensity and climate change. Agric Ecosyst Environ. 296:106929.
- Boval M, Coates DB, Lecomte P, Decruyenaere V, Archimède H. 2004. Faecal near infrared reflectance spectroscopy (NIRS) to assess chemical composition, in vivo digestibility and intake of tropical grass by Creole cattle. Anim Feed Sci Technol. 114(1–4):19–29.
- Brogna N, Palmonari A, Canestrari G, Mammi L, Dal Prà A, Formigoni A. 2018. Technical note: near infrared reflectance spectroscopy to predict fecal indigestible neutral detergent fiber for dairy cows. J Dairy Sci. 101(2):1234–1239.
- Chandler JA, Jewell WJ, Gossett JM. 1980. Predicting methane fermentation biodegradability. Biotechnol Bioeng Symp NO. 10(10):93–107..
- Clivot H, Mary B, Valé M, Cohan JP, Champolivier L, Piraux F, Laurent F, Justes E. 2017. Quantifying in situ and modeling net nitrogen mineralization from soil organic matter in arable cropping systems. Soil Biol Biochem. 111:44–59. .
- Cochran RC, Adams DC, Wallace JD, Galyean ML. 1986. Predicting digestibility of different diets with internal markers: evaluation of four potential markers. J Anim Sci. 63(5):1476–1483.
- Cotanch KW, Grant RJ, Van Amburgh ME, Zontini A, Fustini M, Palmonari A, Formigoni A. 2014. Applications of uNDF in ration modeling and formulation. Cornell nutrition conference for feed manufacturers. Cornell University, Ithaca, NY
- Cozzolino D, La Manna A, Vaz Martins D. 2002. Use of near infrared reflectance spectroscopy to analyse bovine faecal samples. J Near Infrared Spectrosc. 10(4):309–314.
- De Boever JL, Cottyn BG, De Brabander DL, Vanacker JM, Boucqué CV. 1996. Prediction of the feeding value of grass silages by chemical parameters, in vitro digestibility and near-infrared reflectance spectroscopy. Anim Feed Sci Technol. 60(1–2):103–115.
- De La Torre A, Andueza D, Renand G, Baumont R, Cantalapiedra-Hijar G, Nozière P. 2019. Digestibility contributes to between-animal variation in feed efficiency in beef cows. Animal. 13(12):2821–2829.
- De Marchi M. 2013. On-line prediction of beef quality traits using near infrared spectroscopy. Meat Sci. 94(4):455–460.
- De Marchi M, Berzaghi P, Boukha A, Mirisola M, Galol L. 2007. Use of near infrared spectroscopy for assessment of beef quality traits. Ital J Anim Sci. 6(1):421–423.
- De Marchi M, Costa A, Goi A, Penasa M, Manuelian CL. 2019. Novel applications of infrared technologies in dairy industry. Adv Technol. 8(2):92–98.
- De Marchi M, Riovanto R, Penasa M, Cassandro M. 2012. At-line prediction of fatty acid profile in chicken breast using near infrared reflectance spectroscopy. Meat Sci. 90(3):653–657.
- Decruyenaere V, Froidmont E, Bartiaux-Thill N, Buldgen A, Stilmant D. 2012. Faecal near-infrared reflectance spectroscopy (NIRS) compared with other techniques for estimating the in vivo digestibility and dry matter intake of lactating grazing dairy cows. Anim Feed Sci Technol. 173(3–4):220–234.
- Decruyenaere V, Lecomte P, Demarquilly C, Aufrere J, Dardenne P, Stilmant D, Buldgen A. 2009. Evaluation of green forage intake and digestibility in ruminants using near infrared reflectance spectroscopy (NIRS): developing a global calibration. Anim Feed Sci Technol. 148(2–4):138–156.
- Dixon R, Coates D. 2009. Review: near infrared spectroscopy of faeces to evaluate the nutrition and physiology of herbivores. J Near Infrared Spectrosc. 17(1):1–31.
- Fondevila M, Castrillo C, Gasa J, Guada JA. 1995. Rumen-undegradable dry matter and neutral detergent fibre as ratio indicators of digestibility in sheep given cereal straw-based diets. J Agric Sci. 125(1):145–151.
- Fustini M, Palmonari A, Canestrari G, Bonfante E, Mammi L, Pacchioli MT, Sniffen GCJ, Grant RJ, Cotanch KW, Formigoni A. 2017. Effect of undigested neutral detergent fiber content of alfalfa hay on lactating dairy cows: Feeding behavior, fiber digestibility, and lactation performance. J Dairy Sci. 100(6):4475–4483.
- Garnsworthy PC, Unal Y. 2004. Estimation of dry-matter intake and digestibility in group-fed dairy cows using near infrared reflectance spectroscopy. Anim Sci. 79(2):327–334.
- Goi A, Manuelian CL, Currò S, De Marchi M. 2019. Prediction of mineral composition in commercial extruded dry dog food by near-infrared reflectance spectroscopy. Animals 9: 640.
- Goi A, Manuelian CL, Righi F, De Marchi M. 2020. At-line prediction of gelatinized starch and fiber fractions in extruded dry dog food using different near-infrared spectroscopy technologies. Animals. 10(5):1–11.
- Goi A, Simoni M, Righi F, Visentin G, De Marchi M. 2020. Application of a handheld near-infrared spectrometer to predict gelatinized starch, fiber fractions, and mineral content of ground and intact extruded dry dog food. Animals. 10(9):1660.
- Goulart RS, Vieira RAM, Daniel JLP, Amaral RC, Santos VP, Toledo Filho SG, Cabezas-Garcia EH, Tedeschi LO, Nussio LG. 2020. Effects of source and concentration of neutral detergent fiber from roughage in beef cattle diets on feed intake, ingestive behavior, and ruminal kinetics. J Anim Sci. 98(5):1–15.
- Higgs RJ, Chase LE, Ross DA, Van Amburgh ME. 2015. Updating the Cornell net carbohydrate and protein system feed library and analyzing model sensitivity to feed inputs. J Dairy Sci. 98(9):6340–6360.
- Huhtanen P, Detmann E, Krizsan SJ. 2016. Prediction of rumen fiber pool in cattle from dietary, fecal, and animal variables. J Dairy Sci. 99(7):5345–5357.
- Jancewicz LJ, Penner GB, Swift ML, McKinnon JJ, Waldner CL, McAllister TA. 2016. Characterization of the variation in the daily excretion of faecal constituents and digestibility predictions in beef cattle fed feedlot diets using near-infrared spectroscopy. Can J Anim Sci. 96(4):532–549.
- Jancewicz LJ, Penner GB, Swift ML, Waldner CL, Koenig KM, Beauchemin KA, McAllister TA. 2017. Predicting fecal nutrient concentrations and digestibilities and growth performance in feedlot cattle by near-infrared spectroscopy. J Anim Sci. 95(1):455.
- Jancewicz LJ, Swift ML, Penner GB, Beauchemin KA, Koenig KM, Chibisa GE, He ML, McKinnon JJ, Yang WZ, McAllister TA. 2017. Development of near-infrared spectroscopy calibrations to estimate fecal composition and nutrient digestibility in beef cattle. Can J Anim Sci. 97(1):51–64.
- Johnson JR, Carstens GE, Prince SD, Ominski KH, Wittenberg KM, Undi M, Forbes TDA, Hafla AN, Tolleson DR, Basarab JA. 2017. Application of fecal near-infrared reflectance spectroscopy profiling for the prediction of diet nutritional characteristics and voluntary intake in beef cattle. J Anim Sci. 95(1):447–454.
- Johnson JA, Sutherland BD, McKinnon JJ, McAllister TA, Penner GB. 2020. Use of barley or corn silage when fed with barley, corn, or a blend of barley and corn on growth performance, nutrient utilization, and carcass characteristics of finishing beef cattle. Trans Anim Sci. 4(1):129–140.
- Karoui R, Mouazen AM, Dufour E, Pillonel L, Picque D, Bosset JO, De Baerdemaeker J. 2006. Mid-infrared spectrometry: A tool for the determination of chemical parameters in Emmental cheeses produced during winter. Lait. 86(1):83–97.
- Ki KS, Kim SB, Lee HJ, Yang SH, Lee JS, Jin ZL, Kim HS, Jeo JM, Koo JY, Cho JK. 2009. Prediction on the quality of total mixed ration for dairy cows by near infrared reflectance spectroscopy. J Korean Soc Grassland Forage Sci. 29(3):253–262.
- Kononoff P, Heinrichs J, Varga G. 2002. Using manure evaluation to enhance dairy cattle nutrition. p. 1–5.
- Kustantinah K, Suhartanto B, Indarto E, Zulfa IH, Atmojo FA. 2020. Degradation of nitrogen fraction in kacang goats feed supplementation Calliandra calothyrsus substituted soybean meal. Key Eng Mater. 840:118–123.
- Leiber F, Ivemeyer S, Perler E, Krenmayr I, Mayer P, Walkenhorst M. 2015. Determination of faeces particle proportions as a tool for the evaluation of the influence of feeding strategies on fibre digestion in dairy cows. J Anim Plant Sci. 25(1):153–159.
- Lucas A, Andueza D, Rock E, Martin B. 2008. Prediction of dry matter, fat, pH, vitamins, minerals, carotenoids, total antioxidant capacity, and color in fresh and freeze-dried cheeses by visible-near-infrared reflectance spectroscopy. J Agric Food Chem. 56(16):6801–6808.
- Lyons G, Sharma S, Aubry A, Carmichael E, Annett R. 2016. A preliminary evaluation of the use of mid infrared spectroscopy to develop calibration equations for determining faecal composition, intake and digestibility in sheep. Anim Feed Sci Technol. 221:44–53.
- Magrin L, Gottardo F, Fiore E, Gianesella M, Martin B, Chevaux E, Cozzi G. 2018. Use of a live yeast strain of Saccharomyces cerevisiae in a high-concentrate diet fed to finishing Charolais bulls: effects on growth, slaughter performance, behavior, and rumen environment. Anim Feed Sci Technol. 241:84–93.
- Manley M. 2014. Near-infrared spectroscopy and hyperspectral imaging: non-destructive analysis of biological materials. Chem Soc Rev. 43(24):8200–8214.
- Mihaljev ŽA, Jakšić SM, Prica NB, Ćupić ŽN, Živkov-Baloš MM. 2015. Comparison of the Kjeldahl method, Dumas method and NIR method for total nitrogen determination in meat and meat products. J Agroaliment Proc Technol. 21(4):365–370.
- Miller CE. 2001. Chemistry principles of near infrared technology. In: Williams PC, Norris KH, editors. Near infrared technology in the agricultural and food industries, American Association of cereal chemist p. 19–37.
- Moir BKW, Swain AJ. 1972. The metabolic excretion and true digestibilities of nitrogen and fat by cattle and sheep with particular reference to forage-faeces relationships. Aust J Agric Res. 23(5):879–884.
- NRC. 2016. Nutrient Requirements of Beef Cattle. National Academies of Sciences Engineering and Medicine.National Academies Press..
- Núñez-Sánchez N, Carrion D, Peña Blanco F, Domenech García V, Garzón Sigler A, Martínez-Marín AL. 2016. Evaluation of botanical and chemical composition of sheep diet by using faecal near infrared spectroscopy. Anim Feed Sci Technol. 222:1–6.
- Osborne BG, Fearn T, Hindle PH. 1993. Practical NIR spectroscopy with application in food and beverage analysis. London: Longman Scientific & Technical.
- Pagliari PH, Wilson M, Waldrip HM, He Z. 2020. Nitrogen and phosphorus characteristics of beef and dairy manure. In: Waldrip HM, Pagliari PH, He Z, eds. Animal manure: production, characteristics, environmental concerns, and management. Madison (WI): American Society of Agronomy and Soil Science Society of America; pp. 45–62.
- Park RS, Agnew RE, Gordon FJ, Steen RWJ. 1998. The use of near infrared reflectance spectroscopy (NIRS) on undried samples of grass silage to predict chemical composition and digestibility parameters. Anim Feed Sci Technol. 72(1–2):155–167.
- Powell JM, Barros T, Danes M, Aguerre M, Wattiaux M, Reed K. 2017. Nitrogen use efficiencies to grow, feed, and recycle manure from the major diet components fed to dairy cows in the USA. Agric Ecosyst Environ. 239:274–282.
- Prieto N, Pawluczyk O, Russell Dugan ME, Aalhus JL. 2017. A review of the principles and applications of near-infrared spectroscopy to characterize meat, fat, and meat products. Appl Spectrosc. 71(7):1403–1426.
- Purnomoadi A, Kurjhara M, Nishida T, Terada F, Abe A, Hamada T. 1997. Two methods of near infrared reflectance spectroscopy for determining the digestibility and energy value of feeds. Anim Sci Technol. 68(4):351–359.
- Rahman A, Bayram I, Khanum S, Ullah S. 2015. Use and calibration of near infrared reflectance spectroscopy in feed analysis: a mini review. Pak J Life Soc Sci. 13(1):1–7.
- Redshaw ES, Weisenburger RD, Mathison GW, Milligan LP. 1986. Near infrared reflectance spectroscopy for predicting forage composition and voluntary consumption and digestibility in cattle and sheep. Can J Anim Sci. 66(1):103–115.
- Richardson E. C a, Herd RMB. 2004. Biological basis for variation in residual feed intake in beef cattle. 2. Synthesis of results following divergent selection Cooperative Research Centre for Cattle and Beef Quality. Aust J Exp Agric. 44(5):431–440.
- Righi F, Quarantelli A, Tonelli L, Renzi M, Gandolfi B. 2007. Use of Penn State particle separator for the evaluation of total mixed rations typical of Parmigiano Reggiano cheese production area. Ital J Anim Sci. 6(1):347–349.
- Righi F, Simoni M, Malacarne M, Summer A, Costantini E, Quarantelli A. 2016. Feeding a free choice energetic mineral-vitamin supplement to dry and transition cows: effects on health and early lactation performance. Large Anim Rev. 22(4):161–170.
- Righi F, Simoni M, Visentin G, Manuelian CL, Currò S, Quarantelli A, De Marchi M. 2017. The use of near infrared spectroscopy to predict faecal indigestible and digestible fibre fractions in lactating dairy cattle. Livestock Sci. 206:105–108.
- Ruffo ML, Bollero GA. 2003. Residue decomposition and prediction of carbon and nitrogen release rates based on biochemical fractions using principal-component regression. Agron J. 95(4):1034–1040.
- Sales J, Janssens GPJ. 2003. Acid-insoluble ash as a marker in digestibility studies: a review. J Anim Feed Sci. 12(3):383–401.
- Schuba J, Südekum KH, Pfeffer E, Jayanegara A. 2017. Excretion of faecal, urinary urea and urinary non-urea nitrogen by four ruminant species as influenced by dietary nitrogen intake: a meta-analysis. Livestock Sci. 198:82–88.
- Seo S, Tedeschi LO, Lanzas C, Schwab CG, Fox DG. 2006. Development and evaluation of empirical equations to predict feed passage rate in cattle. Anim Feed Sci Technol. 128(1–2):67–83.
- Sgoifo Rossi CA, Compiani R, Baldi G, Taylor SJ, Righi F, Simoni M, Quarantelli A. 2019. Replacing sodium bicarbonate with half amount of calcareous marine algae in the diet of beef cattle. Rev Bras Zootec. 48:1–12.
- Sgoifo Rossi CA, Grossi S, Compiani R, Baldi G, Agovino M, Rossi L. 2020. Programs on beef cattle serum Se, Zn, Cu, Mn concentration, health, growth performance and meat quality. Large Anim Rev. 26:57–64.
- Shenk JS, Westerhaus MO, Abrams S. 1989. Protocol for NIR calibrations: monitoring analysis results and recalibration. In Martens G, Shenk J, Barton F, editors. Near infrared spectroscopy (NIRS): analysis of forage quality. USDA-ARS agriculture handbook, II. Washington (DC): US Government Printing Office; pp. 104–110.
- Simoni M, Temmar R, Bignamini DA, Foskolos A, Sabbioni A, Ablondi M, Quarantelli A, Righi F. 2020. Effects of the combination between selected phytochemicals and the carriers silica and Tween 80 on dry matter and neutral detergent fibre digestibility of common feeds. Ital J Anim Sci. 19(1):723–738.
- Simoni M, Tsiplakou E, Pitino R, Quarantelli A, Righi F. 2020. Determination of the optimal priming interval of rumen fluids used as inocula for the in vitro digestibility trials through radial enzyme diffusion method. Anim Prod Sci. 61:723–738.
- Tolleson DR, Schafer DW. 2014. Application of fecal near-infrared spectroscopy and nutritional balance software to monitor diet quality and body condition in beef cows grazing Arizona rangeland. J Anim Sci. 92(1):349–358.
- Tran H, Salgado P, Tillard E, Dardenne P, Nguyen XT, Lecomte P. 2010. Global” and “local” predictions of dairy diet nutritional quality using near infrared reflectance spectroscopy. J Dairy Sci. 93(10):4961–4975.
- Van Amburgh ME, Grant RJ, Cotanch KW, Zontini A, Ross DA, Foskolos A. 2015. NDF-making something old, new again. Herd health and nutrition conference. College of Agriculture and Life Sciences, Cornell University, Ithaca, NY
- Van Kessel JS, Reeves JB, III, Meisinger JJ. 2000. Nitrogen and carbon mineralization dynamics of manures and composts. HortScience. 29(5):1669–1667.
- Van Soest PJ. 1994. Nutritional ecology of the ruminant. Bangkok, Thailand: C. U. Press.
- Visentin G, McDermott A, McParland S, Berry DP, Kenny OA, Brodkorb A, Fenelon MA, De Marchi M. 2015. Prediction of bovine milk technological traits from mid-infrared spectroscopy analysis in dairy cows. J Dairy Sci. 98(9):6620–6629.
- Weiss CP, Gentry WW, Meredith CM, Meyer BE, Cole NA, Tedeschi LO, McCollum FT, Jennings JS. 2017. Effects of roughage inclusion and particle size on digestion and ruminal fermentation characteristics of beef steers. J Anim Sci. 95(4):1707–1714.
- Williams P. 2014. The RPD statistic: a tutorial note. NIR News. 25(1):22–26.
- Windham WR, Lawrence KC, Park B, Buhr RJ. 2003. Visible/NIR spectroscopy for characterizing fecal cantamination of chicken carcasses. Trans Am Soc Agric Eng. 46(3):747–751.
- Yang Z, Nie G, Pan L, Zhang Y, Huang L, Ma X, Zhang X. 2017. Development and validation of near-infrared spectroscopy for the prediction of forage quality parameters in Lolium multiflorum. PeerJ. 2017(10):1–20.