
 ?Mathematical formulae have been encoded as MathML and are displayed in this HTML version using MathJax in order to improve their display. Uncheck the box to turn MathJax off. This feature requires Javascript. Click on a formula to zoom.
Abstract
This research was conducted to evaluate the influence of adding increasing levels (0, 250, 500,750, and 1000 μg/mL buffered rumen fluid) of green tea ethanol extract (GTEE) to a basal substrate (50% roughage: 50% concentrate formulated with 50% barley and 50% corn grain) on rumen fermentation, methane emissions, and population of microorganism under in vitro experiment. The potential of gas production (A), methane emission, and methane ratio (mL/mL total gas 24 h) were linearly decreased by increasing the dose of GTEE (p<.001). The control group has the highest methane emission (p<.05), while it was the lowest (p<.05) at a dose of 1000 GTEE (47.74 versus 24.23 mL/g DM). In vitro digestibility of dry and organic matter were negatively affected by GTEE (L and Q; p<.001). The addition of GTEE significantly decreased total volatile fatty acids (TVFA) and N-NH3 concentration (L, p<.001), and also changed the VFA profile compared to the control group by decreasing and increasing the acetate and the propionate proportions (p<.001). The highest decrease in total protozoa population (93%), total fungi (38%), and methanogenic archaea (95%) compared to the control group was observed at the highest dose (1000) of GTEE. The addition of GTEE stimulates the population of Prevotella ruminicola and Selenomonas ruminantium, but Butyrivibrio fibrisolvent population was inhibited, in different supplementation doses. The lowest supplementation level (250 μg/mL) seems to have the most benefits on the in vitro fermentation parameters with minimum negative effects on nutrient digestibility. It can be concluded that GTEE can potentially be used to manipulate ruminal fermentation patterns.
Reducing the methane concentration through the anti-protozoal activity of green tea extract improve rumen fermentation patterns by decreasing acetate and N-NH3 concentration and increasing the propionate proportions.
Although the in vitro anti-acidosis potential of GTEE is not as much as monensin, the anti-acidosis potential is significantly increased by increasing GTEE dose compared to the control.
The decrease in in vitro total gas, CH4 production, and dry- and organic-matter digestibility on the addition of GTEE could be attributed to the antimicrobial action of GTEE.
Highlights
Introduction
One of the most important sources of methane emission is ruminant's fermentation, and it was currently recognised as an important issue worldwide the reason for climate changes (Kim et al. Citation2015). In addition to the important impact of methane emissions on the greenhouse effect (FAO Citation2013), ruminal methane production implies energy losses for ruminants. In dry cows, 7.89% of gross energy received is lost in the form of methane (Jadhav et al. Citation2018). Therefore, it is necessary to reduced methane production in ruminants. Due to the negative correlation between methane production and energy utilisation, rechannelling of the hydrogen to produce SCFA and the microbial mass through different dietary supplements are attractive ways to manipulate the rumen fermentation (Goel et al. Citation2008). According to the results of Shabat et al. (Citation2016), more efficient ruminants have a lower abundance of methanogenesis pathways and methanogenic archaea population than inefficient ruminants from a production perspective. Therefore, it can be postulated that applying the strategies for the manipulation of ruminal microbial ecosystem to reduce rumen methane can improve nutrient utilisation and protect the environment (Hristov et al. Citation2013). Public concern due to antimicrobial resistance emergence in humans using antibiotics in animal feeding led to limiting their use as rumen modifiers (Nusbaum Citation2010). For this reason, natural antimicrobials, such as plant extracts, are good candidates. Improving rumen fermentation and control of nutritional disorders such as bloat and acidosis due to positive effects of flavonoids and phenolic compounds were indicated in several studies (Rochfort et al. Citation2008). It has been previously shown that plants with secondary metabolites (saponins, tannins, flavonoids, phenolic compounds, etc.) have an antimicrobial activity which can be used to control the selection of specific groups of microbes in the rumen (Oskoueian et al. Citation2013; Żyszka et al. Citation2017). Indeed, in vitro studies have shown that flavonoid-rich plant extracts show potential to modify rumen fermentation to reduce methane production in the rumen (Patra and Saxena Citation2010; Oskoueian Citation2013) which was associated to its effect on the methanogen (Patra and Saxena Citation2010) and protozoal populations (Kim et al. Citation2015). Furthermore, the flavonoid blend was effective in mitigating ruminal pH decreases and enhancing the molar proportion of propionate, and reducing that of acetate. Green tea is characterised by its high flavonoid content (20–30% of the dry weight) used in many Asian, European, and North American countries as a medicinal plant (Kim et al. 2008 ). There is no information for green tea leaf extracts impact on rumen fermentation and microbial population. The present experiment was conducted to test the effect of green tea leaf ethanolic extract on in vitro gas production, rumen fermentation, and microbial population, also to get the best level of green tea leaf extracts that should be added to improve rumen fermentation.
Materials and methods
The present research was conducted in the Animal Research Station of Agriculture College of Urmia University, Urmia, Iran. The research protocol was approved by the Animal Care and Use Committee of Urmia University.
Plant materials and preparation of extracts
Green tea leaf (Camellia sinensis) was purchased from the Medicines Sales Centre in Urmia province. After grinding leaves, 500 mg was suspended in 1 l of 96% ethanol for 24 h so that the entire surface of leaves was covered with ethanol and then filtered through Whatman no. 1 filter paper. Filtration residue was soaked for 24 h with 75% ethanol, and the solution was filtered similar to the previous method. Two extracts were mixed and ethanolic fraction was dried using a rotary evaporator at 40 °C and a rotation speed of 70–75 rpm into concentrated extract without moisture and ethanol (Heidolph Laborota 4000, Heidolph Instruments GmbH & CO. KG, Schwabach, Germany) according to Solar et al. (Citation2006). Concentrated extracts were stored at 4 °C until further use. The stock extract was subsequently diluted by deionised water to obtain the working solutions with appropriate concentrations.
Determination of flavonoids content
The total flavonoid content in green tea extracts was determined according to the method of Wang et al. (Citation2008). Briefly, 0.5 mL of 2% AlCl3 was mixed with 0.5 mL of sample. After 1 h incubation at room temperature, the absorbance was measured at 420 nm. The concentration of flavonoids was determined as μg of quercetin equivalent (QE) per mg of extract using standard quercetin calibration curve. The total flavonoid content of green tea extracts obtains 36.67 (mg QE/100 g). GC-MS and results analysed fresh extracts are shown in Table .
Table 1. GC-MS analysis of green tea ethanolic extract (GTEE) components.
Preparation of diet and treatments
To evaluate the effect of different levels (0, 250, 500,750, and 1000 μg/mL buffered rumen fluid) of green tea ethanol extract (GTEE), the diet was prepared by roughages and concentrated in the ratio of 50:50 and concentrates formulated with 50% barley and 50% corn grain. Details of the physical compositions of diets are presented in Table . GTEE was added at the following four different rates to buffered ruminal fluid: 0 (control), 250, 500, 750, and 1000 μg/mL of buffered ruminal fluid.
Table 2. Ingredients and chemical composition of the basal diet used in the in vitro systems (g/kg DM).
In vitro gas and methane production kinetics and rumen fermentation end-products
In vitro gas production technique was conducted in two runs and three replicates in each run described by Menke and Steingass (Citation1988). Ingredients and chemical composition of the basal diet used in the in vitro systems are given in Table . The rumen contents were collected from both the liquid and the solid phase and handled from three fistulated cows fed on diet containing alfalfa hay and concentrate before morning feeding (Menke and Steingass Citation1988). Collected rumen fluid filtrated through four layers of cheesecloth and transported to the laboratory by (39 °C) insulated flask. The experimental diet was milled (Wiley mill) to pass through 1 mm screen and 500 mg of diet was weighted into incubation flasks. Fifty mL of the incubation medium was dispensed anaerobically into 120 mL screw caps vials. The incubation medium was composed of buffer (4 g NH4HCO3 and 35 g NaHCO3 in 1 L of distilled water), macromineral solution (5.7 g Na2HPO4, 6.2 g KH2PO4 and 0.6 g MgSO4·6H2O in 1 L of distilled water), micromineral solution (13.2 g CaCl2·2H2O, 10 g MnCl2·4H2O, 1 g CoCl2·6H2O, 8 g FeCl3·6H2O in 100 mL of distilled water), 0.1 g resazurine in 100 mL distilled water, reducing solution: 526 mg Na2S.9H2O in 95 ml distilled water plus 4 mL of 1 N NaOH. The ratio of rumen fluid to buffer medium was 1:2 (v/v). The cumulative volume of produced gas was estimated using gas pressure with pressure transducers at 2, 4, 8, 10, 12, 24, 48, 72, 96, 120, and 144 h of incubation. The Mitscherlich model proposed described by France et al. (Citation2000) was used for fitting the data:
where GP is the cumulative gas production at a given time (mL); A is the potential cumulative gas production (mL); c is the gas production rate (mL/h); T is the time of fermentation (h); and L is the lag time (h).
Two separate runs and three replicates in each run were carried out simultaneous with gas production for measuring methane production described by Fievez et al. (Citation2005). In brief, 100 mg of experimental diet was weighed into a Wheaton vial containing 15 mL of buffered ruminal fluid and the prescribed dose of GTEE and incubated for 24 h. After recording gas pressure at 24 h of incubation, 4 mL of NaOH (10 N) was added into the vials, and the volume of CH4 was calculated immediately. CH4 ratio (mL/mL total gas 24 h) was calculated as the volume of methane (mL/g DM) produced after 24 h of incubation divided by the volume of gas (mL/g DM) produced after 24 h of incubation as
After measuring pH at 24 h of incubation (Titroline easy 5000, Schott Titrator, SCHOTT AG, Mainz, Germany), vials contents were transferred into centrifuge tubes and immediately placed in cold water at 4 °C to stop the fermentation. The tubes were then centrifuged at 15,000g for 20 min at 4 °C, and 4-mL aliquots of the supernatant were mixed with 1 mL of 25% metaphosphoric acid and frozen at −20 °C until analysis of volatile fatty acid (VFA) and ammonia content. Ammonia nitrogen (NH3-N) was measured, as reported by Broderick and Kang (Citation1980).
The analysis of VFA was done using a GC System (6820 Gas Chromatograph, Agilent Technologies, Santa Clara, CA) using an HP-FFAP capillary column (J&W HP-FFAP GC Column, 30 m, 0.25 mm, 0.25 µm, 7-in. cage, Agilent). Injector and detector temperatures were set at 250 °C and 300 °C, respectively. The column temperature was programmed to be raised 20 °C/min from 60 to 200 °C and to hold 10 min at the final temperature. Nitrogen was used as carrier gas with a flow of 1.0 mL/per min. The samples were injected automatically with the 50:1 splitting ratio.
Microbial population
DNA extraction, real time-PCR analyses
After 24 h of incubation, a uniform aliquot (2 mL) of the syringe's contents was transferred to an Eppendorf tube and kept −80 °C until DNA extraction. Total DNA extraction was done due to the methods described by Tajima et al. (Citation2001) and Yang et al. (Citation2009) using phenol and chloroform followed by saline–alcohol precipitation. Extracted DNA was solubilised in sterile Tris-EDTA, processed using DNase free RNase, and purified using DNA Clean and Concentrator™-25, ZYMO Research Corp. (Irvine, CA) as per the manufacturer’s manual. The yield purity of extracted DNA and RNA was assessed using a nanodrop spectrophotometer (Thermo Fisher Scientific, Wilmington, DE). The different microbial groups were determined in the samples using an SYBR green rtPCR assay. Characterisation of the Primers used for PCR amplification of total bacteria, total fungi, methanogenic archaea, major cellulolytic, amylolytic and proteolytic bacteria is shown in Table . Quantification of gene targets was performed on microbial DNA using a Step-One apparatus (Biosystems® 7500 real-time PCR, Applied Biosystems, Waltham, MA). Reactions were run in triplicate in 48-well plates, using PCR master mixtures (a final volume of 20 µL) contained 2 µL of primer pairs (4 P mole/µL from each of forward and reverse primer), 10 µL of SYBR mix (Fermentas, Waltham, MA, Cat. no. K0221), 4 µL of PCR water and 4 µL of DNA solution (20 ng of DNA). Negative controls without 389 templates were run in each assay to assess overall specificity. PCR conditions were as follows: one cycle of 10 min at 95 °C, 40 PCR cycles of 15 s at 95 °C, 10 s at the annealing temperature of the primers, 60 s at 72 °C. Plates reading every other 0.1 °C from 55 to 95 °C for drawing melting curves, then the reactions were ended with an extension of 5 min at 72 °C. The populations of target bacteria/microbial groups were expressed as relative to the total bacterial populations. The comparative cycle threshold (Ct) method (2−ΔΔCt) was calculated by subtracting Ct of the target gene from Ct value of the reference gene (16S rDNA of total bacteria at 24 h) according to Denman and McSweeney (Citation2006). The shifts in microbial communities due to supplementation of different levels of GTEE were determined by taking the microbial population in the control group as 100 (Goel et al. Citation2008).
Table 3. Primer design characteristics used for PCR amplification of rumen microorganisms.
In vitro digestibility
Blümmel et al. (Citation1997) procedure was used in the separate incubation runs (two runs for each time in three replicates) simultaneous with gas production to measure apparent in vitro dry matter digestibility (AIVDMD), true in vitro dry matter digestibility (TIVDMD), and true in vitro organic matter digestibility (TIVOMD) in 24 and 48 h incubation with weighting 500 mg of the diet in 120 mL vials (two runs for each time in three replicates) and dispensed with 50 mL of ruminal fluid containing prescribed doses of GTEE. Respectively, after 24 and 48 h of incubation vials were centrifuged at 15,000g for 20 min at 4 °C, transferred to weighed tubes, and the supernatant was discarded. Oven-dried digestion residues measured AIVDMD at 60 °C for 48 h. To measure TIVDMD, digestion residues were boiled for 1 h with 20 mL of neutral detergent solution, then were dried at 100 °C for 10 h and weighed. The recovered substrate was incinerated at 600 °C (Atra Furnace, Tehran, Iran) to evaluate TIVOMD (Menke and Steingass Citation1988).
Evaluation of anti-acidosis potential
The effects of GTEE on reduction acidosis risk, carbohydrate-challenged systems (Hutton et al. Citation2010) were used. After the morning meal, rumen fluid was taken 3 h from three ruminally fistulated cows and under anaerobic conditions (surged with CO2) transported to the laboratory. A quantity of 100 mg of ground oaten chaff plus 1 g of d-glucose was weighed into the tubes and filled with 10 mL of rumen fluid, the tubes were sealed by aluminium caps after inclusion of different GTEE doses (as given earlier) and incubated in a shaking incubator at 39 °C for 6 h in triplicate and gas production was measured by a pressure transducer at 2-h intervals. Moreover, three tubes were also incubated, the first containing oaten chaff without GTEE, the second containing oaten chaff, d-glucose and without GTEE, last group containing oaten chaff, d-glucose plus monensin, was used as the control, uncontrolled acidosis and positive control, respectively. At the end of incubation, the pH of the media was measured after measuring the final gas pressure.
Statistical analysis and calculations
In vitro methane production, rumen fermentation end-products, microbial population, and anti-acidosis potential data were analysed using a completely randomised design by one-way analysis of variance (ANOVA) of SAS 9.2 (SAS Institute, Cary, NC) using the following model:
where Yij is the observation; μ is the overall mean; Ai is the treatment, and eij is the error term.
In vitro gas production and digestibility data were subjected to analysis of variance by mixed procedure of SAS (version 9.2, SAS Institute, Cary, NC) using the following model:
where Yijk is the observation; μ is the overall mean for each parameter; Ai is the dose–effect of GTEE; Tj is incubation time effect; ATij is the interaction effect between GTEE doses and incubation time, and eijk is the residual error.
Doses of GTEE were the source of variation, and linear, quadratic, and cubic effects of increasing dosage of GTEE were determined using polynomial contrasts. The statistical significance was expressed in the table as linear (L), cubic (C), and quadratic (Q) effects, respectively (SAS Institute Citation2002). The statistical significance was declared at p ≤ .05 and the tendency at .05<p ≤ .10. In the case of the significant effect, Duncan’s test was used to compare treatment means.
Results
GC/MS analysis of green tea
The main constituents of GTEE (Table ) observed by the GC/MS analysis were 1 h-benzimidazole and 2-phenyl (97.16%).
In vitro gas and methane production and rumen fermentation end-products
The effects of GTEE dose levels on gas production kinetics parameters, CH4, CH4 ratio, pH, and N-NH3 are shown in Table and Figure , respectively. A significant linear decrease (p<.05) in gas production (A) and gas production rate (c) as well as a significant increase in lag time, was observed by increasing the dose of GTEE. The highest and lowest cumulative gas production values were observed at the lowest (control) and the highest dose (1000) of GTEE, respectively (233.96 versus 219.26 mL/g DM). Green tea ethanolic extract caused a significant linear decrease in CH4 (mL/g DM) and linear, quadratic and cubic decrease in the CH4 ratio (L, Q, C; p<.001). The high reduction of CH4 (mL/g DM) and CH4 ratio (mL/mL total gas 24 h) was observed for the dose of 1000 in relation to control (24.23 versus 47.74 and 0.08 versus 0.18, respectively). Also, increasing the level of GTEE resulted in decreased ammonia-N concentration (p<.01). There are no significant differences in pH between treatments (p>.10).
Figure 1. Pattern of the effects of different levels of green tea ethanol extract (GTEE) on ruminal gas production kinetics.
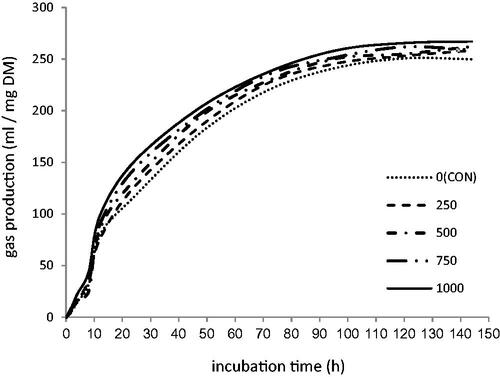
Table 4. Effects of different doses of green tea ethanolic extract (GTEE) on gas and methane production, pH, and N-NH3 concentration.
The concentration of volatile fatty acids, namely acetate, butyrate, propionate, valerate, iso-butyrate, and iso-valerate, is shown in Table . GTEE altered the profile of VFA compared to the control group by decreasing and increasing acetate and the propionate proportion, respectively (p<.001). The molar percentage of acetate and propionate tended to change in a linear manner with increasing the dose of GTEE (p<.001). However, the acetate to propionate ratio decreased by the treatments. The inclusion of GTEE increased butyrate concentration and did not affect (p>.05) valerate, iso-butyrate, and iso-valerate concentration when compared to control.
Table 5. Effects of different doses of green tea ethanolic extract (GTEE) on VFA concentrations.
The effect of green tea on microbial population
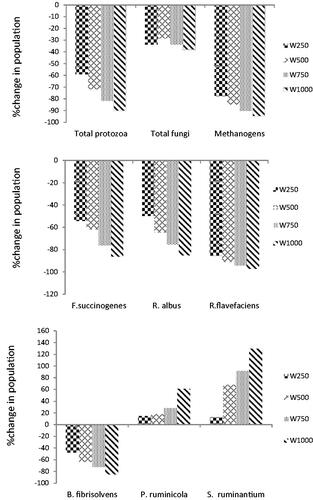
The change in microbial communities determined by taking the control group's microbial population as 100 is shown in Figure . The addition of GTEE decreased the abundance of total protozoa, methanogen, and total fungi population compared to control. The highest decrease in total protozoa population (93%), total fungi (38%), and methanogen (95%) was observed at the highest dose (1000) of GTEE. The addition of GTEE significantly reduced the populations of Fibrobacter succinogenes, Ruminococcus flavefaciens, and Ruminococcus albus, but to different magnitudes. Also, GTEE stimulated the population of Prevotella ruminicola and Selenomonas ruminantium, whereas the growth of Butyrivibrio fibrisolvent was inhibited. The highest growth in Prevotella ruminicola and Selenomonas ruminantium (60% and 130%, respectively) and the highest inhibitory effect (by nearly 85%) in Butyrivibrio fibrisolvent were absorbed for the dose of 1000 in relation to control.
Figure 2. Effects of green tea ethanol extract (GTEE) on rumen microbial Population change (%) relative to the control. SEM was 8.14, 7.26, and 9.07 for protozoa, fungi, and methanogenic archea, respectively (a). SEM was 6.34, 7.21, and 5.12 for F.succinogenes, R. albus, and R. flavefaciens, respectively (b). SEM was 5.07, 6.23, and 3.71 for B. fibrisolvents, P. ruminicola, and S. ruminantium, respectively(c).
The effect of green tea on in vitro digestibility
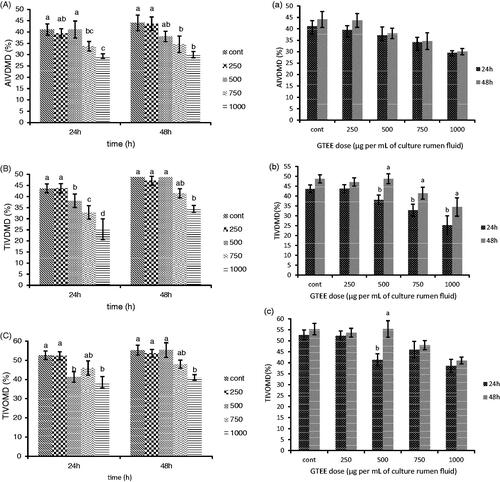
As shown in Figure , GTEE addition at 1000 and 750 dosages had the greatest reduction in AIVTDMD at 24 h and 48 h compared to the control, respectively. A significant decrease in TIVDMD was observed in 1000 compared to control (p<.05) at 24 h incubation (Figure ). There was no significant difference in TIVDMD among 250, 500, and 750 at 48 h incubation (p>.05), and a dose of 1000 had the greatest reduction in TIVDMD (p<.05). While showing no significant decrease among doses after 24 and 48 h incubation time, TIVOMD had the greatest reduction at 1000 than the control (Figure ). There is no significant different among incubation times in AIVTDMD in Figure , but TIVDMD were higher after 48 h than 24 h (p<.05).
Figure 3. Effects of different doses of green tea ethanolic extract (GTEE) and incubation time on in vitro digestibility of AIVDMD (a), TIVDMD (b), and TIVOMD (c). Means followed by different letters are significantly different according to Tukey’s multiple range tests (p < .05).
Anti-acidosis potential of green tea
The results of the anti-acidosis potential of GTEE are shown in Table . Although the anti-acidosis potential of GTEE is not as much as monensin even at the level of 1000, the results show that the anti-acidosis potential is significantly increased with increasing GTEE dose compared to the control (p<.05).
Table 6. Effects of different doses of green tea leave ethanolic extract (GTEE) on the control of lactic acidosis.
Discussion
Methane is a greenhouse gas with global warming capability that is 25 times more toxic than carbon dioxide. Feed additives modulate rumen microbial fermentation by reducing methane-producing bacteria, thereby preventing global warming (Patra and Saxena Citation2010; Seradj et al. Citation2014; Lee et al. Citation2017). Total gas production in the GTEE-added group was lower than the control group during 144 h incubation. Also, GTEE reduced the methane emission significantly (p<.05) compared to the control group. The addition of GTEE may alter specifically rumen microbial ecosystem and improve microbial growth efficiency. The addition of GTEE decreased the abundance methanogen population compared to control. Our results support those found by Wang et al. (Citation2013), who reported a significant depression of methanogens population by flavonoid-rich plant extracts. Kim et al. (Citation2015) found that flavonoid-rich plant extracts reduce methane emissions after 24 h of incubation. Wang et al. (Citation2000) also reported that the Yucca saponin supplemented substrate decreased methane production about 15% compared to the control. Reduction in methane may be partially due to suppression of protozoal population as their numbers were decreased by 93% and 83% on addition of 1000 and 750 μg/mL buffered rumen fluid of GTEE, respectively. Also, flavonoids have been suggested to indirectly reduce ruminal methanogenesis, acting as H2 sinks (Becker et al. Citation2014). But, other studies have reported a direct inhibitory effect of flavonoids on methanogens (Seradj et al. Citation2014). The pH has no significant difference among treatments (p>.05). Our study is in agreement with the previous study (Oskoueian et al. Citation2013). The GTEE had an effect on the ruminal nitrogen use, as it was observed a reduction in ammonia concentration. The decrease in ammonia nitrogen may be due to a decrease in the protozoa population, which is responsible for the degradation of bacterial proteins, thereby increasing rumen ammonia levels (Jadhav et al. Citation2018). However, the increase in Prevotella population was not able to compensate for the decrease in ruminal ammonia nitrogen concentration. In this study, a high dose of GTEE linearly altered the profile of VFA by decreasing acetate and increasing propionate proportion. Manipulation in the rumen environment to improve the production of volatile fatty acids is considered desirable changes in the rumen ecosystem (Oskoueian et al. Citation2013). It is well established that change in VFA profile is one of the implications of methane production inhibition which may decrease acetate and increase propionate production, while more hydrogen was shifted for this acid production (Van Nevel and Demeyer Citation1996). Rira et al. (Citation2010) reported that an increase in the proportion of propionate due to channelling of hydrogen from methanogenesis to propionate production by flavonoids can be one possible reason for CH4 reduction (Rira et al. Citation2010). Significant increase in the molar proportion of propionate and depressed acetate as a result of flavonoid was reported in other studies (Seradj et al. Citation2014). However, in another study, phenolic compounds extracted from honeybees’ propolis increased acetate production and total VFA (Paula et al. Citation2017). Adding GTEE led to reducing the population of methanogens, which is associated to a decrease in the protozoa population (Figure ). The F. succinogenes, R. albus, and R. flavefaciens diversity under GTEE were shown to decrease compared to control (Figure ). Reduced protozoa related to ruminal methanogenesis through direct effects of flavonoids have been reported by Patra and Saxena (Citation2010). Also, there are several different reports of secondary plant metabolites on protozoan populations. Some studies report a lack of plant secondary metabolites effect on protozoal numbers (McIntosh et al. Citation2003; Benchaar et al. Citation2007; Newbold et al. Citation2004), whilst others have found a decreasing effect on protozoa population (Ando et al. Citation2003; Cardozo et al. Citation2006; Fandiño et al. Citation2008). Although the mechanism of action has not been elucidated, it may facilitate the permeation of plant secondary metabolites across the protozoal membrane because of their lipophilic nature (Cardozo et al. Citation2006). According to the report of Patra (Citation2011), the growth of viruses and fungi and some rumen protozoa that harbour methanogens may be impaired by the flavonoid-rich plant. Some extracts, such as tea tree oil, modify microbial metabolism by membrane-active biocide broad-spectrum activity (Davidson and Naidu Citation2000). The inclusion of GTEE to diet with high dosage had the greatest in vitro digestibility reduction compared to control. A decrease in fibre digestion due to higher sensitivity of cellulolytic bacteria to GTEE possibly causes to a decrease in the dry and organic matter digestibility. Our results agree with previous studies showing a linear decrease in the apparent digestibility of DM by increasing doses of various essential oils, such as clove oil, eucalyptus oil, origanum oil, and peppermint oil (Patra and Yu Citation2012). Moreover, studies on flavonoids and pistachio hull essential oils showed a significant reduction in DM digestibility than the control group (Oskoueian et al. Citation2013). The ethanolic extraction of green tea leave did not affect the occurrence of acidosis as much as monensin. But GTEE improves the pH at all included doses compared to uncontrolled acidosis. It is also possible that the improvement in pH may be due to a reduction in the production of VFA, as shown in Table . It is reported in several studies that Streptococcus bovis (the main bacteria causes' rumen acidosis) was partly resistant against some essential oils compared to other bacteria (McIntosh et al. Citation2003). In another study, Evans and Martin (Citation2000) reported that thymol was a potent inhibitor of lactate production by S. bovis.
Methane emission reduction and improving animal production without using antibiotics are the major goals of animal industry. The current findings indicate that GTEE may have the potential to reduce methane emission and improve rumen fermentation and thereby animal production across diets containing different forage to concentrate ratios.
Conclusion
The evaluated green tea ethanolic extract possesses the anti-protozoal activity and also reduced methanogenic archaea population, which led to mitigation in methane production. Although the highest dose (1000 μg/mL) have the lowest methane production, but negatively affected gas production and nutrient digestibility. There is no significant difference among 250, 500, and 750 μg/mL in methane production. So, the lowest supplementation level (250 μg/mL) seems to have the most benefits on the in vitro fermentation parameters with minimum negative effects on nutrient digestibility. Further in vivo studies are needed to confirm the results.
Ethical approval
This research protocol was approved by the Animal Care and Use Committee of Urmia University.
Acknowledgements
The authors to appreciate Iran National Science Foundation for the financial support of this study (project# 96001700).
Disclosure statement
The authors declare that there is no conflict of interest.
Data availability statement
The data that support the findings of this study are available on request from the corresponding author, R. Pirmohammadi. The data are not publicly available due to their containing information that could compromise the privacy of research participants.
Additional information
Funding
References
- Ando S, Nishida T, Ishida M, Hosoda K, Bayaru E. 2003. Effect of peppermint feeding on the digestibility, ruminal fermentation and protozoa. Livestock Produc Sci. 82(2–3):245–248.
- Becker PM, van Wikselaar PG, Franssen MCR, de Vos RCH, Hall RD, Beekwilder J. 2014. Evidence for a hydrogensink mechanism of (+) catechin mediated emission reduction of the ruminant greenhouse gas methane. Metabolomics. 10(2):179–189.
- Benchaar C, Chaves A, Fraser G, Beauchemin K, McAllister T. 2007. Effects of essential oils and their components on in vitro rumen microbial fermentation. Can J Anim Sci. 87:413–419.
- Blümmel M, Makkar HPS, Becker K. 1997. In vitro gas production: a technique revisited. J Anim Physiol Anim Nutr. 77(1–5):24–34.
- Broderick GA, Kang JH. 1980. Automated simultaneous determination of ammonia and total amino acids in ruminal fluid and in vitro media. J dairy sci. 63(1):64–75.
- Cardozo P, Calsamiglia S, Ferret A, Kamel C. 2006. Effects of alfalfa extract, anise, capsicum, and a mixture of cinnamaldehyde and eugenol on ruminal fermentation and protein degradation in beef heifers fed a high-concentrate diet. J Anim Sci. 84(10):2801–2808.
- Davidson P, Naidu A. 2000. Phyto-phenols. In: AS Naidu, editors. Natural food antimicrobial systems. Boca Raton (FL): CRC Press; p. 265–294.
- Denman SE, McSweeney CS. 2006. Development of a realtime P CR assay for monitoring anaerobic fungal and cellulolytic bacterial populations within the rumen. FEMS Microbiol Ecol 58, 572–582.
- Evans JD, Martin SA. 2000. Effects of thymol on ruminal microorganisms. Curr Microbiol. 41(5):336–340.
- Fandiño I, Calsamiglia S, Ferret A, Blanch M. 2008. Anise and capsicum as alternatives to monensin to modify rumen fermentation in beef heifers fed a high concentrate diet. Anim Feed Sci Technol. 145(1–4):409–417.
- FAO. 2013. Tackling climate change through livestock – a global assessment of emissions and mitigation opportunities. Rome: Food and Agriculture Organization.
- Fievez V, Babayemi OJ, Demeyer D. 2005. Estimation of direct and indirect gas production in syringes: a tool to estimate short chain fatty acid production that requires minimal laboratory facilities. Anim Feed Sci Technol. 123–124:197–210.
- France J, Dijkstra J, Dhanoa MS, Lopez S, Bannink A. 2000. Estimating the extent of degradation of ruminant feeds from a description of their gas production profiles observed in vitro: derivation of models and other mathematical considerations. Br J Nutr. 83(2):143–150.
- Goel G, Makkar HPS, Becker K. 2008. Changes in microbial community structure, methanogenesis and rumen fermentation in response to saponin-rich fractions from different plant materials. J Appl Microbiol. 105(3):770–777.
- Hristov AN, Oh J, Firkins JL, Dijkstra J, Kebreab E, Waghorn G, Makkar HPS, Adesogan AT, Yang W, Lee C, et al. 2013. Special topics – Mitigation of methane and nitrous oxide emissions from animal operations: I. A review of enteric methane mitigation options. J Anim Sci. 91(11):5045–5069.
- Hutton PG, Nagaraja TG, White CL, Vercoe PE. 2010. Screening plants for the antimicrobial control of lactic acidosis in ruminant livestock. In: PE Vercoe, HPS Makkar, AC Schlink, editors. In vitro screening of plant resources for extra-nutritional attributes in ruminants: nuclear and related methodologies.Dordrecht, Netherlands: Springer; p. 159–189.
- Jadhav RV, Kannan A, Bhar R, Sharma OP, Gulati A, Rajkumar K, Mal G, Singh B, Verma MR. 2018. Effect of tea (Camellia sinensis) seed saponins on in vitro rumen fermentation, methane production and true digestibility at different forage to concentrate ratios. J Appl Anim Res. 46(1):118–124.
- Kim ET, Guan LL, Lee SJ, Lee SM, Lee SS, Lee ID, Lee SK, Lee SS. 2015. Effects of flavonoid-rich plant extracts on in vitro ruminal methanogenesis, microbial populations and fermentation characteristics. Asian Australas J Anim Sci. 28(4):530–537.
- Lee SHY, Humphries DJ, Cockman DA, Givens DI, Spencer JPE. 2017. Accumulation of citrus flavanones in bovine milk following citrus pulp incorporation into the diet of dairy cows. EC Nutr. 7(4):143–154.
- McIntosh FM, Williams P, Losa R, Wallace RJ, Beever DA, Newbold CJ. 2003. Effects of essential oils on ruminal microorganisms and their protein metabolism. AEM. 69(8):5011–5014.
- Menke KH, Steingass H. 1988. Estimation of the energetic feed value obtained from chemical analysis and in vitro gas production using rumen fluid. Anim Res Dev. 28:7–55.
- Newbold CJ, McIntosh FM, Williams P, Losa R, Wallace RJ. 2004. Effects of a specific blend of essential oil compounds on rumen fermentation. Anim Feed Sci Technol. 114(1–4):105–112.
- Nusbaum NJ. 2010. Dairy livestock methane remediation and global warming. J Community Health. 35(5):500–502.
- Oskoueian E, Abdullah N, Oskoueian A. 2013. Effects of flavonoids on rumen fermentation activity, methane production, and microbial population. Biomed Res Int. 2013:1–8.
- Patra AK. 2011. Effects of essential oils on rumen fermentation, microbial ecology and ruminant production. Asian J Anim Vet Adv. 6(5):416–428.
- Patra AK, Saxena J. 2010. A new perspective on the use of plant secondary metabolites to inhibit methanogenesis in the rumen. Phytochemistry. 71(11–12):1198–1222.
- Patra AK, Yu Z. 2012. Effects of essential oils on methane production and fermentation by, and abundance and diversity of, rumen microbial populations. Appl Environ Microbiol. 78(12):4271–4280.
- Paula VB, Estevinho LM, Dias LG. 2017. Quantification of three phenolic classes and total phenolic content of propolis extracts using a single UV-vis spectrum. J Apic Res. 56(5):569–80.
- Rira M, Boultifat L, Arhab R, Bousseboua H. 2010. Action de saponines de nature chimique différente, stéroïdes et triterpènes, sur l'activité méthanogène du microbiote ruminal d'ovins. MHA (Sousse). 22(63):26–29.
- Rochfort S, Parker AJ, Dunshea FR. 2008. Plant bioactives for ruminant health and productivity. Phytochemistry. 69(2):299–322.
- SAS Institute. 2002. SAS users guide Statistical analyses systems institute. Cary (NC): SAS Institute.
- Seradj AR, Abecia L, Crespo J, Villalba D, Fondevila M, Balcells J. 2014. The effect of Bioflavex® and its pure flavonoid components on in vitro fermentation parameters and methane production in rumen fluid from steers given high concentrate diets. Anim Feed Sci Technol. 197:85–91.
- Shabat SK, Sasson G, Doron-Faigenboim A, Durman T, Yaacoby S, Miller ME, White BA, Shterzer N, Mizrahi I. 2016. Specific microbiome-dependent mechanisms underlie the energy harvest efficiency of ruminants. Isme J. 10(12):2958–2972.
- Solar A, Colarič M, Usenik V, Stampar F. 2006. Seasonal variations of selected flavonoids, phenolic acids and quinones in annual shoots of common walnut (Juglans regia L.). Plant Sci. 170(3):453–461.
- Tajima K, Aminov RI, Nagamine T, Matsui H, Nakamura M, Benno Y. 2001. Diet-dependent shifts in the bacterial population of the rumen revealed with real-time PCR. Appl Environ Microbiol. 67(6):2766–2774.
- Van Nevel CJ, Demeyer DI. 1996. Control of rumen methanogenesis. Environ Monit Assess. 42(1–2):73–97.
- Wang H, Gao XD, Zhou GC, Cai L, Yao WB. 2008. In vitro and in vivo antioxidant activity of aqueous extract from Choerospondias axillaris fruit. Food Chemist. 106(3):888–895.
- Wang D, Huang J, Zhang Z, Tian X, Huang H, Yu Y, Zhang G, Ding J, Huang R. 2013. Influences of Portulaca oleracea extracts on in vitro methane emissions and rumen fermentation of forage. J Food Agric Environ. 11:483–488.
- Wang YX, McAllister TA, Yanke LJ, Xu ZJ, Cheeke PR, Cheng KJ. 2000. In vitro effects of steroidal saponins from Yucca Schidigera extract on rumen microbial protein synthesis and ruminal fermentation. J Sci Food Agric. 80(14):2114–2122.
- Yang SL, Bu DP, Wang JQ, Hu ZY, Li D, Wei HY, Zhou LY, Loor JJ. 2009. Soybean oil and linseed oil supplementation affect profiles of ruminal microorganisms in dairy cows. Animal. 3(11):1562–1569.
- Żyszka B, Anioł M, Lipok J. 2017. Modulation of the growth and metabolic response of cyanobacteria by the multifaceted activity of naringenin. PLoS One. 12(5):e 0177631.