
 ?Mathematical formulae have been encoded as MathML and are displayed in this HTML version using MathJax in order to improve their display. Uncheck the box to turn MathJax off. This feature requires Javascript. Click on a formula to zoom.
Abstract
The effects of different inclusion rates of Poncirus trifoliata (PT) extract on in vitro ruminal fermentation parameters were investigated. Six dose levels were referred to as follows: PT0, control (without PT); PT1, (3 mg/L); PT3, (9 mg/L); PT5, (15 mg/L); PT7, (21 mg/L); PT9, (27 mg/L), each incubated with 50 mL of buffered rumen fluid and 300 mg of timothy hay as a substrate for 72 h of incubation using an in vitro batch culture system. The in vitro dry matter digestibility (IVDMD) was significantly affected by the PT dose, except after 6 and 48 h of incubation. Total volatile fatty acids (VFAs) increased quadratically (12 h of incubation) within the range of PT1–PT7, whereas decreased at PT9 dose. Methane (CH4) production and the proportion of CH4 in the total gas produced decreased linearly after 12 h of incubation. The relative abundance of Ruminococcus albus and Ruminoccocus flavefaciens was greater at the doses PT1 than PT0, whereas that of Fibrobacter succinogenes was greater at PT0 than at PT9 after 24 h of incubation. Methanogenic archaea decreased linearly with increasing PT dose after 12 h of incubation. The abundance of ciliate-associated methanogens decreased linearly over 24 h of incubation under PT7 and PT9 treatments. These results suggest that the dose of PT can modulate ruminal fermentation to alter VFA concentration and reduce CH4 production by altering ruminal bacterial abundance.
This study evaluated the dose-response effects of Poncirus trifoliata as a methane mitigation agent in ruminants.
Inclusion of Poncirus trifoliate lowered in vitro dry matter digestibility and total volatile fatty acid concentration.
Inclusion of Poncirus trifoliata extract reduced methane production after 12 h of incubation but did not maintained.
Inclusion of Poncirus trifoliata extract reduced methanogenic archaea and ciliate-associated methanogens abundance
Highlights
Introduction
Methane (CH4) is a major greenhouse gas (GHG) whose impact is more than 28-fold greater than that of carbon dioxide . It accounted for approximately 3% of Korea's total GHG emissions in 2013 (Smith et al. Citation2014, National GHG Inventory Report of Korea, 2019). Enteric fermentation is responsible for 37.3% of the CH4 production in the agricultural sector in Korea. Along with a global carbon-neutral imperative, the development of efficient strategies for GHG reduction is essential.
Rumen enteric microbial fermentation is essential for yielding metabolisable energy in ruminants; however, this process is accompanied by CH4 production and is not always efficient. From a ruminant nutritional point of view, enteric CH4 production in the rumen represents a 2-12% loss of the gross energy from feed intake, which inhibits efficient feed energy utilisation (Johnson and Johnson Citation1995). Reducing CH4 production in the livestock industry is a major challenge in supporting the global carbon-neutral imperative; it must be achieved as the demand for meat and milk will increase over time. Therefore, finding efficient and safe strategies for modulating the rumen microbial ecosystem to reduce CH4 production has attracted significant attention.
To date, extensive efforts have been made to inhibit rumen methanogenesis using feed additives via in vitro and in vivo systems. The most promising results have been found for chemical additives such as electron receptors (Gutierrez-Bañuelos et al. Citation2008; Kim et al. Citation2016) and, ionophores (Chalupa et al. Citation1980), which have been utilised to mediate rumen fermentation to enhance the productivity of ruminants and reduce methanogenesis. However, most chemical additives are restricted from the feed additive market in the European Union and Korea because of host animal toxicity or public health concerns regarding the potential development of anti-microbial resistance due to these additives. Therefore, considerable attention has been paid to natural substances, such as plants and seaweed materials (Kim et al. Citation2015; Choi et al. Citation2020, Citation2021). In contrast to chemical additives, these natural substances either have a low risk of host toxicity or residues for the host.
Poncirus trifoliata (PT) is a large, semi-evergreen tree native to Korea and China. The premature fruits of PT have diverse biological activities, such as anti-inflammatory properties and anti-Helicobacter pylori activities, and can treat gastrointestinal disease (Kim et al. Citation2011; Yoon et al. Citation2012). In addition, PT contains approximately 17.90 − 60.54 mg/g flavonoids (Lee et al. Citation2010) and has a total polyphenolic content of 29.29 ± 2.60 mg GAE (gallic acid equivalent)/g DW (distilled water) (Woo et al. Citation2017). Another study showed that PT contains 50 chemical components, including hesperidin, naringin, and poncirin (Lee et al. Citation2005). Out of the several compounds contained in PT, phenolic compounds, in particular, have been reported to inhibit a variety of bacteria in the rumen (Woo et al. Citation2017). However, the response of rumens and animals to PT has not yet been investigated. Therefore, in this study, the dose-response effects of PT on in vitro ruminal fermentation characteristics, CH4 production and rumen microbial abundances were evaluated.
Materials and methods
Ethics statement
All management and experimental protocols involving animals were approved by the Gyeongsang National University (Jinju, Gyeongsangnam-do, Korea) Animal Research Ethical Committee (approval number: GNU-180130-A0007).
Sample preparation
A PT (Stock no. KPM011-094) samples were purchased from the Plant Extract Bank at the Korea Research Institute of Bioscience and Biotechnology (Daejeon, Korea). Briefly, PT (Fruit part) was washed and dried naturally under shade. Dried PT (100 g) was grounded to small pieces and then extracted in 99.9% methyl alcohol (1 L) at room temperature for 3 days. After extraction, the solution was filtered and solvents vacuum-evaporated to dryness. The PT extract (20 mg/mL) was dissolved in dimethyl sulfoxide (Sigma-Aldrich Chemical Co., St. Louis, Mo, USA) to perform an in vitro batch cultures.
We analysed chemical composition of the experimental feed, PT materials and its extract using the methods of the AOAC (Citation1990) and Van Soest et al. (Citation1991). The chemical composition of the PT used in this study was as follow: moisture, 76.4%; crude protein (CP), 3.33%; ether extract (EE), 6.70%; Ash, 2.12% of dry matter (DM) basis. The timothy hay as basal substrate used in this study was as follows: DM, 92.2%; CP, 10.3%; EE, 5.36%; Ash, 5.97%; neutral detergent fibre (NDF), 62.4%; acid detergent fibre , 38.2%; calcium, 0.35; phosphorous, 0.01%; non-fibrous carbohydrate , 15.7% of DM basis, calculated value: 100-(CP + EE + Ash + NDF)]. Details about chemical analysis procedures are presented in our previous paper (Choi et al. Citation2020).
In vitro conditions for experiment
Two cannulated Hanwoo cows were used as the donor of rumen fluid. Hanwoo cows consuming a ration consisting of timothy hay, and concentrate at twice a day (09:00 and 17:00). A fresh water and mineral block were provided ad libtum. Before morning feeding, rumen fluid was strained through 4 layers of cheesecloth and stored in airtight containers which kept at 39 °C in a prewarmed thermos for transportation to laboratory. Strained rumen fluid was mixed with artificial saliva buffer (McDougall Citation1948) previously bubbled with O2-free N2 gas. Then, 15 mL of rumen fluid and buffer mixture (at a 2:1 ratio) was dispensed anaerobically (flushing with O2-free N2 gas) into 50 mL vials previously filled with substrate 300 mg of timothy hay and six PT extract dose levels (0, 1, 3, 5, 7, and 9%) added over the substrate, and the vials were capped with a rubber stopper. The six dose levels were determined by previous paper (Yejun et al. Citation2019): PT0, control (without PT); PT1, (3 mg/L); PT3, (9 mg/L); PT5, (15 mg/L); PT7, (21 mg/L); PT9, (27 mg/L). All the vials were incubated in a shaking incubator (Jeio Tech, SI-900R, Daejeon, Korea; 120 × xg) at 39 °C for 6, 12, 24, 48, and 72 h of incubation. In vitro batch cultures with 3 replicate runs each with 3 vials per treatment and incubation. Dried 1 mm screened timothy hay were placed into pre-weighed nylon bags (pore size 50 ± 10 μm, R510, Ankom Technology, NY, USA) and transferred in 50 mL serum bottle. After incubating for each time, samples were placed on ice to stop the fermentation.
Analysis of gas profiles
After each 12, 24, and 48 h of incubation, gas pressure inside of each vial was read from the pressure transducer (Laurel Electronics, Inc., Costa Mesa, CA, USA) according to the method by Theodorou et al. (Citation1994). Gas pressure values were converted to gas volume (mL) from the equation determined for our laboratory conditions.
Where, V is a gas volume (mL); P is a measured pressure (psi).
Headspace gas (6 mL) was collected from each vial and moved into vacuum test tube (Vacutainer, Becton Dickinson, Franklin Laker, NJ, USA). The concentration of CH4 in the gas samples were assayed by gas chromatography (Agilent Technologies HP 5890, Santa Clara, CA, USA) equipped with Carboxen 1006PLOT capillary column (30 × 0.53 mm). A thermal conductivity detector with methanizer was used to analyse CH4 concentration. Column, injector and detector temperatures were controlled with 35, 200, and 250 °C, respectively, and helium and hydrogen gases were used as carrier and combustion gases, respectively.
Analysis of rumen fermentation characteristics
The culture pH was measured using a pH metre (S220, Mettler-Toledo, Greifensee, Switzerland). Sample of liquid cultures (5 mL from each vial) were subsampled and then stored at −80 °C until rumen microbial DNA extraction. The remaining culture (5 mL) was collected for ammonia nitrogen (NH3–N) and volatile fatty acid (VFA) analysis. In brief, 1 mL of supernatant was used to analyse NH3-N concentration using procedures described by Chaney and Marbach (Citation1962), and the concentration of NH3–N was assayed to optical density (OD) at 630 nm by spectrophotometer (Model 680, Bio-Rad Laboratories, Hercules, CA, USA). For the VFA processing, 2 mL of supernatant was used and analysed with a High Performance Liquid Chromatography (L-2200, Hitachi, Tokyo, Japan) equipped with a UV detector (L-2400; Hitachi) and a column (MetaCarb 87H; Varian, Palo Alto, CA, USA).
In vitro dry matter digestibility (IVDMD) was estimated by nylon bag digestion process. The nylon bag with substrate was washed at water-bath three times and then dried to a constant weight at 105 °C overnight. IVDMD was then calculated by follow formula:
Where, DMI is an initial DM, and DMf is a finished DM.
All the detail procedures of such analyses were the same as those of Choi et al. (Citation2020).
DNA extraction and PCR analysis
Total DNA was extracted from each rumen fluid sample by using the bead-beating method (Yu and Morrison Citation2004). Genomic DNA was extracted from triplicate samples using QIAamp Fast DNA Stool Mini Kit (Qiagen, Hilden, Germany) in accordance with the manufacturer’s protocol. Extracted DNA was qualified and quantified by NanoDrop ND-2000 spectrophotometer (Thermo Fisher Scientific Inc., Waltham, MA, USA). All the primer information of total bacteria, cellulolytic bacteria [Ruminococcus albus (R. albus), Ruminococcus flavefaciens (R. flavefaciens), Fibrobacter succinogenes (F. succinogenes)], Methanogenic archaea (M. archaea) and ciliate-associated methanogens (CAM) were obtained from published papers (Koike and Kobayashi Citation2001; Denman and McSweeney Citation2006; Skillman et al. Citation2006; Denman et al. Citation2007) and paired-sequences are presented in Table . Real-time quantitative PCR assays were performed by CFX 96 Touch system (Bio-Rad Laboratories, Inc., CA, USA). In brief, all DNA samples were assayed in 3-replicate in a 20 μL PCR reaction mixture containing paired-primers, SYBR Green Supermix and DNA template. The PCR amplification of the target DNA, included an initial denaturation step at 95 °C for 10 min, followed by 40 cycles of 95 °C for 30 s, primer annealing at 60 °C for 30 s, and elongation at 72 °C for 30 s. The abundance of each target bacteria was calculated relative to the total rumen bacteria population according to the equation 2–ΔCt = 2–(Ct target–Ct total bacteria), as described by Denman and McSweeney (Citation2006). The detail PCR procedures of such analyses were the same as Kim et al. (Citation2015).
Table 1. Polymerase chain reaction primers used in this study.
Statistical analysis
To give a more precise estimate of gas production throughout fermentation, the following calculation was used to analyse the kinetic data, as according to Ørskov and McDonald (Citation1979) as following exponential model: In these equations, GP is the gas production (mL/g of DM) at time t; t is the incubation time (hours), a is immediately soluble fraction, b is insoluble fraction, and c is the constant rate of digestibility for b fraction per hours. Gas production rate was fitted to the model by using the PROC NLIN procedure of SAS (version 9.4, SAS Inst. Inc., Cary, NC, USA) employing Marquadt’s algorithm, while varying a, b, and c. Effective gas production (EGP, i.e., substrate availability) from the culture was estimated as EGP = a + b(kd/[kd + kp]), where kd is a gas production rate constant, and kp is the ruminal passage rate constant assumed to be 0.04/h. The data on gas profiles, ruminal fermentation characteristics, and microbial abundance were analysed using the PROC MIXED procedure for a completely randomised design. The model included terms for PT dose levels, time, and their interaction. Orthogonal polynomial contrasts were used to determine the linear, quadratic, and cubic response to the increasing doses of PT and dependent variables. The IML procedure of the SAS was used to correct the contrast coefficients of orthogonal polynomial because of unequal intervals of PT doses. For analysing dose level, time, and interaction effect on PT dose, two-way analysis of variance was performed. Differences among means were also compared by Duncan’s post hoc comparison when there was a significant overall effect. Statistical significance was declared at p ≤ .05, and a trend was discussed when .05 < p ≤ .10.
Results
Effects of PT doses on rumen fermentation characteristics
Table shows the effects of PT dose on IVDMD and their parameters after different incubation periods. The IVDMD was significantly affected by the PT dose, except after 6 h and 48 h of incubation. Compared with PT0 (control, without PT extract), PT9 had a lower IVDMD (linear effect: p = .016, quadratic effect: p = .003, cubic effect: p = .006) after 12 h incubation. After 24 h incubation, PT5 had a lower IVDMD (linear effect: p = .047, quadratic effect: p = .039, cubic effect: p = .067, respectively) than that for PT0. At 72 h of incubation, the IVDMD for all does of PT was lower (linear effect: p = .025) than that for PT0, and it decreased linearly with increasing dose of PT. The immediately soluble fraction ‘a’ indicates that PT0 had a higher (linear effect: p = .001, quadratic effect: p = .086, cubic effect: p = .002, respectively) effect than that for PT treatments. The insoluble fraction ‘b’ indicates that no significant differences were observed between the PT0 and PT doses. The potential extent of IVDMD ‘a + b’, tended to be lower in PT5 and PT9 (quadratic effect: p = .094). The effective IVDMD rate (EDM) decreased (linear effect: p = .021, cubic effect: p = .016) in PT5, PT7, and PT9 compared with that in PT0.
Table 2. Effect of different doses of Poncirus trifoliata extract on in vitro dry matter digestibility.
The effects of different doses of PT on the in vitro fermentation parameters are shown in Table . No significant differences were observed in pH when the PT dose levels were increased. Increasing the dose of PT tended to decrease the NH3–N concentration linearly after 12 h of incubation (linear effect: p = .016). After 24 h of incubation, the NH3–N concentration was higher under the PT5, PT7, and PT9 treatments, but lower (linear effect: p < .001) than that for PT3. The PT3 dose tended to increase the total VFA concentration after 12 h of incubation (linear effect: p = .079, quadratic effect: p = .024), whereas PT9 decreased. However, PT9 had a tendency to increase the total VFA concentration after 24 h of incubation (linear effect: p = 0.054, cubic effect: p = .028). The molar proportions of the individual VFAs, after 12 h of incubation, differed at different doses of PT; but they were similar after 24 h of incubation. Propionate and acetate to propionate ratios differed between PT3 and PT9 (linear effect: p = .020 and p = .029, respectively). Butyrate was lower (linear effect: p = .027) under PT7 and PT9, compared to that for PT0.
Table 3. Effect of different doses of Poncirus trifoliata extract on in vitro rumen fermentation.
Effects of PT doses on in vitro gas production
The effects of different doses of PT on cumulative in vitro gas production are shown in Table . Compared with that under PT0, the cumulative in vitro gas production under both PT7 and PT9 were lower (linear effect: p = .001) after 6 h of incubation. After 72 h of incubation, it was higher under PT3 (quadratic effect: p < .001) than that for PT0. The immediately soluble fraction ‘a’ indicated that PT7 was higher (quadratic effect: p = .021) than PT0, whereas the insoluble fraction ‘b’ indicated that all of the PT doses except PT1 were higher (linear effect: p = .002, quadratic effect: p = .008) than for PT0. The potential gas production ‘a + b’ was higher (linear effect: p = .004, quadratic effect: p = .004) at PT3, PT5, and PT7 than that for PT0. The effective gas production rate (EGP) decreased linearly (linear effect: p = .041), depending on the PT dose.
Table 4. Effect of different doses of Poncirus trifoliata extract on in vitro cumulative gas production.
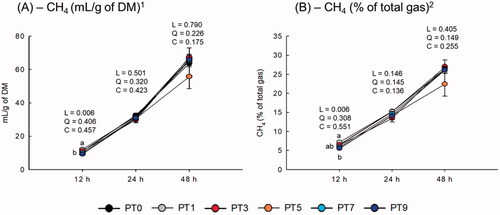
The CH4 production (mL/g of DM) decreased linearly with increasing PT dose after 12 h of incubation (linear effect: p = .006), particularly with PT5 and PT9. The proportion of CH4 in the total gas also showed a linear relationship with increasing PT dose after 12 h of incubation (linear effect: p= .006). The PT dose did not affect CH4 production or the proportion of CH4 in the total gas after 24 and 48 h of incubation. However, CH4 production and the proportion of CH4 in the total gas showed a dose-dependent effect (p = .074 and p = .012, respectively) and time effect (p < .0001).
Effects of PT doses on the rumen microbial population
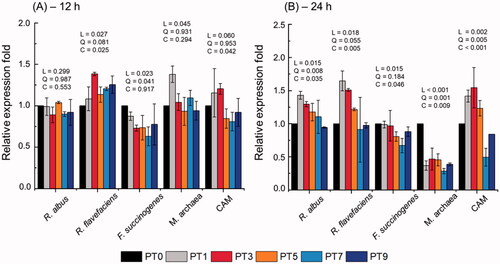
The rumen microbial population is shown in Figure . Among the cellulolytic bacterial species, the relative abundance of Ruminococcus flavefaciens (R. flavefaciens) was higher (linear, quadratic, and cubic effect: p = .027, p = .081, and, p = .025, respectively) in PT3, PT7, and PT9 compared to that for PT0 after 12 h of incubation. After incubation for 24 h, its abundance was higher in PT1 and PT3 (linear, quadratic, and cubic effects: p = .018, p = .055, and, p = .005, respectively) than that for PT0. The abundance of Fibrobacter succinogenes (F. succinogenes) was lower (linear effect: p = .023, quadratic effect: p = .041) in PT3, PT5, and PT7 than in PT0 after 12 h of incubation. After incubation for 24 h, its abundance was lower in PT9 (linear effect: p = .015, cubic effect: p = .046) than in PT0. The abundance of Ruminococcus albus (R. albus) showed no significant difference after 12 h of incubation, but increased (linear, quadratic, and cubic effect: p = .015, p = .008, and p = .035, respectively) in PT1 and PT3 after 24 h of incubation. The abundance of Methanogenic archaea (M. archaea) was higher (linear effect: p = .045) in PT1 at 12 h of incubation and lower in all treatments after 24 h of incubation than in PT0 (linear, quadratic, and cubic effect: p < .001, p = .001, and p = .009, respectively). The abundance of ciliate-associated methanogens (CAM) was higher (linear, quadratic, and cubic effects: p < .001, p = .005, and, p < .001, respectively) in PT1 and PT3, than that for PT0 after 24 h of incubation.
Figure 1. Relative quantification of in vitro rumen microbial populations at (A) 12 h and (B) 24 h incubation by different dose of Poncirus trifoliata extract. R. albus, Ruminococcus albus; R. flavefaciens, Ruminococcus flavefaciens; F. succinogenes, Fibrobacter succinogenes; M. archaea, Methanogenic archaea; CAM, ciliate-associated methanogens. Data were analyzed using PT dose levels of 0 (PT0), 3 mg/L (PT1), 9 mg/L (PT3), 15 mg/L (PT5), 21 mg/L (PT7), and 27 mg/L (PT9). L = linear effect; Q = quadratic effect; C = cubic effect. Error bars are standard error of the mean (n=3).
Discussion
The inclusion of plant extracts in ruminant diets has been reported to change rumen fermentation, gas profiles, and rumen microbial populations (Bodas et al. Citation2008; Kim et al. Citation2015; Sinz et al. Citation2019). In this study, as the PT dose in the substrate increased, rumen fermentation characteristics except pH values and the molar percentage of acetate, were altered (Table ). Generally, pH is the main indicator of the degree of fermentation in the rumen. The dose-response of PT produced pH changes from 6.76 to 7.14 after 12 and 24 h of incubation [both duration are suitable for supporting the activity of ruminal microbes, especially cellulolytic bacterial species] (Russell and Wilson Citation1996). Substrate digestibility is closely related to total gas production, VFA production, and microbial activity (Menke Citation1988). In the current study, the PT dose decreased the rate of EDM linearly, but also simultaneously decreased the EGP. These results corresponded to a quadratic decrease in IVDMD and VFA concentration after 12 h of incubation, to the extent that PT9 (as a high dose) could be detrimental by reducing VFA concentrations. According to Busquet et al. (Citation2006), high doses of various plant extracts may decrease the total VFA concentration, possibly reflecting decreased feed digestion.
In general, rumen microbial abundance was affected by the PT dose. The relative abundance of cellulolytic bacteria, R. flavefaciens, and R. albus was greater in PT3, but lower in PT9 than in PT0 (Figure ). However, the relative abundance of F. succinogenes for all the PT doses was lower than that for PT0. These results agree with the observations of Kim et al. (Citation2015), who reported that a variety of plant extracts tested in an in vitro batch culture system produced a general alteration of rumen microbial abundance. In addition, Hong et al. (Citation2018) reported that the PT methanol extract potentially has anti-bacterial and anti-oxidant activities against both gram-negative and gram-positive pathogens. PT contains rich sources of polyphenols, including flavonoids (Lee et al. Citation2010), and phytosterols, such as β-sitosterol (Jayaprakasha et al. Citation2007), which might inhibit and/or enhance several important rumen microbes.
Upon increasing the PT dose, the NH3–N concentration initially dropped linearly after 12 h of incubation, but increased linearly after 24 h of incubation. Decreased NH3–N concentration might result from the inhibition of proteolysis, deamination of nitrogenous constituents of the feed substrate, inhibition of rumen proteolytic bacteria and protozoa, or a combination of these factors attributable to the PT dosage. The polyphenolic compound concentration was not measured in the present study; however, Woo et al. (Citation2017), who used the same PT extract, reported a total polyphenolic content of 29.29 ± 2.60 mg GAE/g DW. According to Makkar (Citation2003), polyphenolic compounds may form an insoluble complexes with feed protein and reduce utilisation by rumen proteolytic bacteria, thus inhibiting rumen nitrogen production. The linearly elevated total VFA and NH3–N concentrations after 24 h of incubation were possible due to the presence of cellulolytic bacteria and CAM being more activated than that after 12 h of incubation.
Our results highlight that it is difficult to determine strong correlations among parameters, such as CH4 production, CH4 proportion to total gas, IVDMD, and VFA concentration, after 24 and 48 h of incubation. However, notable point of our study is that the CH4 parameter mean values were lower with PT after 12 h of incubation, except for PT1 (Figure ). In particular, PT3 was highly effective in reducing most parameters, including EDM, EGP, and total VFA concentration, with a small reduction in CH4 production compared with PT0, while there was a linear relationship with increasing PT dose. The reduction in CH4 production is consistent with that reported in previous studies that used plant extracts on in vitro batch culture systems: 49% reduction by Cudrania tricuspidata (Kim et al. Citation2015), 43% by Acacia mearnsii (Durmic et al. Citation2014), and 37% by Pharbitis nil (Bharanidharan et al. Citation2021). Sinz et al. (Citation2019) reported that decreased CH4 proportion to the total gas is an indicator of reduced CH4 production, which might translate into lower emissions per unit of meat or milk. There are two possible reasons for the reduction in CH4 as a result of the PT dose. First, a linear increase in the molar proportion of propionate suppressed hydrogen-producing bacteria, such as R. albus and R. flavefaciens. As stated above, PT contains the bioactive compound, β-sitosterol, which can enhance the abundance of Succiniclasticum, which comprises functionally important rumen genus that ferment succinate to propionate (Xia et al. Citation2020). In addition, methanogenesis-related archaea were substantially suppressed (71–53%) by increasing the PT dose, and the abundance of CAM was reduced to a maximum of 50% at PT7 compared that at PT0. Second, as stated above, the presence of polyphenolic compounds in PT possibly suppresses CH4 production. Indeed, Patra et al. (Citation2006) and Sinz et al. (Citation2019) reported that phenolic compounds derived from plant extracts have anti-protozoal activities and directly inhibit rumen methanogens. However, it does not always affect rumen methanogenesis and/or anti-protozoa activities because of their species specificity (Patra et al. Citation2006). In the rumen, it is well known that CH4 emissions result from a mutualistic association between protozoa and methanogens (including M. archaea). Hence, in this study, the reduction in the relative abundance of M. archaea and CAM by PT most likely reflects a reduction in the protozoal population, leading to a reduction in CH4 production in the in vitro batch culture system.
Figure 2. Effect of different dose of Poncirus trifoliata extract on in vitro methane production. Data were analyzed using PT dose levels of 0 (PT0), 3 mg/L (PT1), 9 mg/L (PT3), 15 mg/L (PT5), 21 mg/L (PT7), and 27 mg/L (PT9). DM, dry matter. L = linear effect; Q = quadratic effect; C = cubic effect. 1Dose level effect: p = 0.074; Time effect: p < 0.0001; Interaction, p = 0.178. 2Dose level effect: p = 0.012; Time effect: p < 0.0001; Interaction, p = 0.106. Error bars are standard error of the mean (n = 3).
Conclusion
Based on the results of this experiment, we conclude that CH4-mitigating effect of PT dose was most likely related to the lower IVDMD and total VFA concentration. However, PT dose led to mitigate methanogenesis by reducing the M. archaea and CAM abundance. Therefore, metagenomic approach is essential for understanding how PT impact the rumen microbiome and whether these effect hold promise as rumen modulators to mitigate rumen methane production and fermentation characteristics. In addition, to enable the wider application of PT as a novel candidate additive in the future, the potential of PT must be evaluated at various forage-to-concentrate ratios under in vitro and in vivo studies.
Disclosure statement
No potential conflict of interest was reported by the author(s).
Data availability statement
The data presented in this study are available on request from the corresponding author.
Correction Statement
This article has been republished with minor changes. These changes do not impact the academic content of the article.
Additional information
Funding
References
- AOAC. 1990. Official methods of analysis. 15th ed. Arlington, VA: Association of Analytical Chemists.
- Bharanidharan R, Arokiyaraj S, Baik M, Ibidhi R, Lee SJ, Lee Y, Nam IS, Kim KH. 2021. In vitro screening of east asian plant extracts for potential use in reducing ruminal methane production. Animals. 11(4):1020.
- Bodas R, López S, Fernández M, García-González R, Rodríguez AB, Wallace RJ, González JS. 2008. In vitro screening of the potential of numerous plant species as antimethanogenic feed additives for ruminants. Anim Feed Sci Technol. 145(1-4):245–258.
- Busquet M, Calsamiglia S, Ferret A, Kamel C. 2006. Plant extracts affect in vitro rumen microbial fermentation. J Dairy Sci. 89(2):761–771.
- Chalupa W, Corbett W, Brethour JR. 1980. Effects of monensin and amicloral on rumen fermentation. J Anim Sci. 51(1):170–179.
- Chaney AL, Marbach EP. 1962. Modified reagents for determination of urea and ammonia. Clin Chem. 8:130–132.
- Choi YY, Lee SJ, Kim HS, Eom JS, Kim DH, Lee SS. 2020. The potential nutritive value of Sargassum fulvellum as a feed ingredient for ruminants. Algal Res [Internet]. 45:101761.
- Choi YY, Shin NH, Lee SJ, Lee YJ, Kim HS, Eom JS, Lee SS, Kim ET, Lee SS. 2021. In vitro five brown algae extracts for efficiency of ruminal fermentation and methane yield. J Appl Phycol. 33(2):1253–1262.
- Denman SE, McSweeney CS. 2006. Development of a real-time PCR assay for monitoring anaerobic fungal and cellulolytic bacterial populations within the rumen. FEMS Microbiol Ecol. 58(3):572–582.
- Denman SE, Tomkins NW, McSweeney CS. 2007. Quantitation and diversity analysis of ruminal methanogenic populations in response to the antimethanogenic compound bromochloromethane. FEMS Microbiol Ecol. 62(3):313–322.
- Durmic Z, Moate PJ, Eckard R, Revell DK, Williams R, Vercoe PE. 2014. In vitro screening of selected feed additives, plant essential oils and plant extracts for rumen methane mitigation. J Sci Food Agric. 94(6):1191–1196.
- Gutierrez-Bañuelos H, Anderson RC, Carstens GE, Tedeschi LO, Pinchak WE, Cabrera-Diaz E, Krueger NA, Callaway TR, Nisbet DJ. 2008. Effects of nitroethane and monensin on ruminal fluid fermentation characteristics and nitrocompound-metabolizing bacterial populations. J Agric Food Chem. 56(12):4650–4658.
- Hong H, Lee JH, Kim SK. 2018. Phytochemicals and antioxidant capacity of some tropical edible plants. Asian-Australas J Anim Sci. 31(10):1677–1684.
- Jayaprakasha GK, Mandadi KK, Poulose SM, Jadegoud Y, Nagana Gowda GA, Patil BS. 2007. Inhibition of colon cancer cell growth and antioxidant activity of bioactive compounds from Poncirus trifoliata (L.) Raf. Bioorg Med Chem. 15(14):4923–4932.
- Johnson KA, Johnson DE. 1995. Methane emissions from cattle. J Anim Sci. 73(8):2483–2492.
- Kim ET, Guan LL, Lee SJ, Lee SM, Lee Sang S, Lee ID, Lee SK, Lee Sung S. 2015. Effects of flavonoid-rich plant extracts on in vitro ruminal methanogenesis, microbial populations and fermentation characteristics. Asian Australas J Anim Sci. 28(4):530–537.
- Kim JK, Choi SJ, Bae H, Kim CR, Cho HY, Kim YJ, Lim ST, Kim CJ, Kim HK, Peterson S, Shin DH. 2011. Effects of methoxsalen from Poncirus trifoliata on acetylcholinesterase and trimethyltin-induced learning and memory impairment. Biosci Biotechnol Biochem. 75(10):1984–1989.
- Kim SH, Mamuad LL, Kim DW, Kim SK, Lee SS. 2016. Fumarate reductase-producing enterococci reduce methane production in rumen fermentation in vitro. J Microbiol Biotechnol. 26(3):558–566.
- Koike S, Kobayashi Y. 2001. Development and use of competitive PCR assays for the rumen cellulolytic bacteria: Fibrobacter succinogenes, Ruminococcus albus, and Ruminococcus flavefaciens. FEMS Microbiol Lett. 204(2):361–366.
- Lee HT, Seo EK, Chung SJ, Shim CK. 2005. Prokinetic activity of an aqueous extract from dried immature fruit of Poncirus trifoliata (L.) Raf. J Ethnopharmacol. 102(2):131–136.
- Lee Y-S, Yoon H-G, Kim N-W. 2010. The physiological activities of ripe fruit of Poncirus trifoliata. Korean J Food Preserv. 17(5):698–705.
- Makkar HPS. 2003. Effects and fate of tannins in ruminant animals, adaptation to tannins, and strategies to overcome detrimental effects of feeding tannin-rich feeds. Small Rumin Res. 49(3):241–256.
- McDougall EI. 1948. Studies on ruminant saliva. 1. The composition and output of sheep’s saliva. Biochem J. 43(1):99–109.
- Menke KH. 1988. Estimation of the energetic feed value obtained from chemical analysis and in vitro gas production using rumen fluid. Anim Res Dev. 28:7–55.
- Ørskov ER, McDonald I. 1979. The estimation of protein degradability in the rumen from incubation measurements weighted according to rate of passage. J Agric Sci. 92(2):499–503.
- Patra AK, Kamra DN, Agarwal N. 2006. Effect of plant extracts on in vitro methanogenesis, enzyme activities and fermentation of feed in rumen liquor of buffalo. Anim Feed Sci Technol. 128(3–4):276–291.
- Russell JB, Wilson DB. 1996. Why are ruminal cellulolytic bacteria unable to digest cellulose at low pH? J Dairy Sci. 79(8):1503–1509.
- Sinz S, Marquardt S, Soliva CR, Braun U, Liesegang A, Kreuzer M. 2019. Phenolic plant extracts are additive in their effects against in vitro ruminal methane and ammonia formation. Asian-Australas J Anim Sci. 32(7):966–976.
- Skillman LC, Skillman LC, Toovey AF, Toovey AF, Williams AJ, Williams AJ. 2006. Development and validation of a real-time PCR method to quantify rumen protozoa and examination of variability between entodinium populations in sheep offered a hay-based diet. Appl Environ Microbiol. 72(1):200–206.
- Smith P, Clark H, Dong H, Elsiddig EA, Haberl H, Harper R, House J, Jafari M, Masera O, Mbow C. 2014. Chapter 11 - Agriculture, forestry and other land use (AFOLU). In: Climate Change 2014: Mitigation of Climate Change. IPCC Working Group III Contribution to AR5. Cambridge University Press.
- Theodorou MK, Williams BA, Dhanoa MS, McAllan AB, France J. 1994. A simple gas production method using a pressure transducer to determine the fermentation kinetics of ruminant feeds. Anim Feed Sci Technol [Internet]. 48(3–4):185–197.
- Van Soest PJ, Robertson JB, Lewis BA. 1991. Symposium: carbohydrate methodology, metabolism, and nutritional implications in dairy cattle. J Dairy Sci. 74(10):3583–3597.
- Woo Y, Lee H, Jeong YS, Shin GY, Oh JG, Kim JS, Oh J. 2017. Antioxidant potential of selected korean edible plant extracts. Biomed Res Int. 2017:7695605.
- Xia G, Sun J, Fan Y, Zhao F, Ahmed G, Jin Y, Zhang Y, Wang H. 2020. β-Sitosterol attenuates high grain diet-induced inflammatory stress and modifies rumen fermentation and microbiota in sheep. Animals. 10(1):171.
- Yejun L, Su Kyoung L, Shin Ja L, Jong-Su E, Sung Sill L. 2019. Effects of Lonicera japonica extract supplementation on in vitro ruminal fermentation, methane emission, and microbial population. Anim Sci J. 90(9):1170–1176.
- Yoon HY, Cho YS, Jin Q, Kim HG, Woo ER, Chung YS. 2012. Effects of ethyl acetate extract of Poncirus trifoliata fruit for glucocorticoid-induced osteoporosis. Biomol Ther. 20(1):89–95.
- Yu Z, Morrison M. 2004. Improved extraction of PCR-quality community DNA from digesta and fecal samples. Biotechniques. 36(5):808–812.