
 ?Mathematical formulae have been encoded as MathML and are displayed in this HTML version using MathJax in order to improve their display. Uncheck the box to turn MathJax off. This feature requires Javascript. Click on a formula to zoom.
ABSTRACT
The United Kingdom’s 2016 referendum on membership of the European Union is perhaps one of the most important recent electoral events in the UK. This political sentiment has confounded pollsters, media commentators and academics alike, and has challenged elected Members of the Westminster Parliament. Unfortunately, for many areas of the UK this referendum outcome is not known for Westminster Parliamentary Constituencies, rather it is known for the coarser geography of counting areas. This study uses novel data and machine learning algorithms to estimate the Leave vote percentage for these constituencies. The results are seen to correlate well with other estimates.
E-petitions and political activism
In a representative democracy it is important that politicians have knowledge of the desires, aspirations and concerns of their constituents. This can be accomplished by them attending meetings; conducting advice surgeries and simply talking with people. The question then arises as to how representative these interactions are? Ideally the conduct of a statistically sound opinion survey would provide a more objective measure of local views; however, in the era of big data thoughts turn to how alternative data can inform politicians about important issues (Bright & Margetts, Citation2016; Karpf, Citation2016b). One such source of data are signatories to electronic petitions (e-petitions) (Karpf, Citation2016a). In this study use is made of such e-petition data to provide local politicians with information about possibly the most significant event in recent United Kingdom (UK) politics, the referendum on its European Union (EU) membership.
The impact of the United Kingdom’s European Union membership referendum
On June 23rd 2016 the UK held a referendum on its membership of the EU. The question put to the eligible voters was:
“Should the United Kingdom remain a member of the European Union or leave the European Union?”
with possible answers of Remain or Leave. The vote counts and declarations took place in each of 382 counting areasFootnote 1 (CA) and these results were aggregated at the national level to provide a majority vote of 52% to leave the EU.
Both prior to the referendum and afterwards it became apparent how the outcome would influence many important aspects of life (Hepburn, Citation2017), including demography (Coleman, Citation2016), immigration (Portes & Forte, Citation2017), financial markets (Yeoh, Citation2016), education (Mayhew, Citation2017), health (McKenna, Citation2016) and agriculture (Helm, Citation2017). Much analysis took place to understand what socio-demographic or socio-economic factors could explain the result (Beecham, Slingsby, Brunsdon, & Radburn, Citation2017; Goodwin & Heath, Citation2016; Jackson, Thorsen, & Wring, Citation2016) and the variation in support for Leave or Remain across the UK has been much commented upon and analysed (Harris & Charlton, Citation2016; Manley, Jones, & Johnston, Citation2017). However, the geography most readily available for analysis, the 382 CAs, is not the most useful for local politicians. A preferred geography is the 650 Westminster Parliamentary Constituencies (WPCs) − understanding the results for WPC is important because it is at this geography that elected members of Parliament are held to account by their constituents.
EU referendum voter data for some WPCs is however available, because either: both CAs and WPCs are co-terminus (35 CAs/WPCs); or the CA released counts at WPC geography (33 WPCs). Indicative results for a third set can be aggregated from ward data subsequently supplied to the BBC (107 WPCs) (Rosenbaum, Citation2016), however these data do not always allocate the postal votes to the correct WPC, and in the 2015 general election 16% of the issued ballots were postal. This leaves 475 WPCs where the outcome of the EU referendum is unknown.
There have been two reported attempts to estimate votes at WPC geography. Hanretty (Citation2017a) uses an areal interpolation approach based on counts estimated by a Poisson regression model on 2011 census data. This estimated that 400 of the WPCs voted Leave whilst 232 voted Remain (the results from the 18 WPCs in Northern Ireland are known and therefore not part of his analysis). The second attempt to estimate votes at WPC geography was undertaken by Marriott (Citation2017). This estimate uses a look-up table of WPCs to CAs and then a method to re-allocate votes to a WPC based on a ‘classification’ of each WPC. The Marriott WPC estimates correspond well with those of Hanretty (Citation2017a) (see ), with the Leave vote in the majority for 393 WPCs.
Figure 1. Proportion of the Leave vote by DZ and CA geography. Note: blue denotes areas which voted to Leave while yellow denotes areas which voted to Remain.
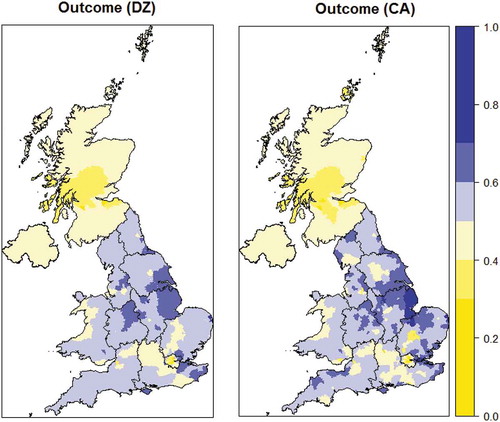
Figure 2. Agreement between known proportion for Leaving (x) and estimation (y) for each of the 8 algorithms and a GLM.
Figure 3. Correlation between Hanretty, Marriott and Cubist estimates.
Figure 4. Categorisation of WPCs.
Our study primarily contributes to this understanding of the 2016 EU referendum result by providing a further set of WPC outcome estimates, using different data and techniques to confirm or dispute these earlier estimates. The best performing estimation technique is also amenable to interpretation, providing insight into what drove the sentiment of the electorate. More broadly it contributes by highlighting the availability and utility of e-petition data to explain a political outcome and reminds political scientists that there are modelling approaches available beyond traditional regression. The remainder of this article is set out in six sections: section two introduces the e-petition data; section three introduces the machine leaning techniques; section four describes the experimental procedure; section five presents the results; and the final section offers a discussion.
The utility of e-petition data
The petitioning of parliament in England has a long tradition dating back to the Middle Ages (Dodd, Citation2007) but the practice has been revolutionised in the past 10 years by the widespread introduction of e-petition systems (Directorate-General for Internal Policies, Citation2015; Miller, Citation2008; S. Wright, Citation2015b), helping to revive the long established practice of petitioning. Whilst some caution is necessary when interpreting the conduct of such petitions (S. Wright, Citation2012) there is little doubt that such e-petitions have the potential to register protest or advocate an issue (Leston-Bandeira, Citation2017). However, the evidence for their impact on actual legislative outcomes is mixed (Bochel & Bochel, Citation2016; Dumas, Harrison, Hagen, & Zhao, Citation2017; Hough, Citation2012; S. Wright, Citation2015b) but researchers are beginning to use such systems as a source of secondary data analysis (Briassoulis, Citation2010) and to undertake computational social science investigations (Jungherr & Theocharis, Citation2017). Uses have included examining the life-cycle of e-petitions (Yasseri, Hale, & Margetts, Citation2013), the pattern of engagement with e-petitions (Huang, Suh, Hill, & Hsieh, Citation2015; Puschmann, Bastos, & Schmidt, Citation2016), analysis of e-petition text (Hagen et al., Citation2015); the initial support (C. Dumas et al., Citation2015a) and triggered counter response (C. L. Dumas et al., Citation2015b) to gun control in the United States; and the classification of WPCs (Clark, Lomax, & Morris, Citation2017).
Motivated by these uses of e-petition data, the attribute data used in this study are the number of individuals in an area who signed an e-petition that opened and closed in the period between the May 2015 General election and the June 2016 EU referendum and which was debated in the UK parliament (S. Wright, Citation2015a). The list of these 25 petitions and the number of signatories is given in . They range in themes that cover education, health, the environment, immigration policy and social issues, however, there is only one e-petition which is overtly connected to the EU referendum, an e-petition to stop the government funding of a leaflet that was perceived by some to be pro-EU. The UK Parliament’s petitions committee makes e-petition signatory counts by WPC available on its web site (UK Parliament, Citation2017).
Table 1. List of e-petitions used in this study.
Subsequent to the EU referendum there were a number of e-petitions related to the process of the UK’s exit from the EU that gained considerable support, however these e-petitions have not been included in this analysis. The reasons are that firstly these e-petitions themselves created a great deal of media interest and may have influenced the political sentiment of individuals or areas which was not present at the time of the EU referendum vote. Secondly, there is evidence to suggest that subsequent to the EU referendum, up to 10% of Leave voters may of experienced some ‘bregrets’ and wished they had voted Remain (The British Election Study Team, Citation2016).
The size of the electorate in each WPC varies from less than 22,000 to near 110,000 so to take account of this variation in size, the raw count of signatories is divided by the WPCs electorate in May 2015. This proportion provides the relative strength of support for each e-petition in each WPC.
Machine learning algorithms
Artificial Intelligence or machine learning algorithms are rapidly being developed and refined (Domingos, Citation2012). Such algorithms can be used in an unsupervised manner, where the outcome of interest is unknown or, in the context of this study, supervised, where the outcome is known.
A diverse set of algorithms are suitable for consideration in this study and some are listed in an expert assessment of the 10 top machine learning algorithms in Wu et al. (Citation2007). Of the 10 listed, three are suitable here - variants of the C4.5 decision tree algorithm (Quinlan, Citation1993), support vector machine (SVM) (Cortes & Vapnik, Citation1995) and k nearest neighbour (kNN) (Hastie & Tibshirani, Citation1996). To extend this list, a further five contemporary algorithms are also considered: artificial neural networks (ANN) (Priddy & Keller, Citation2005), self-organising maps (SOM) (Kohonen, Citation1995), gradient boot machines (GBM) (J H Friedman, Citation2001), multivariate adaptive regression splines (MARS/Bag Earth) (Jerome H Friedman, Citation1991) and Cubist (M Kuhn, Weston, Keefer, Coulter, & Quinlan, Citation2013). The remainder of this section provides a brief introduction to these techniques and to facilitate this discussion it is useful to know that input data is often split to provide both training data to capture the learning and testing data to test the predictive performance.
Lazy learners
These learners are characterised by capturing learning through a set of similarity relationships. Training data are arrange in a hypothetical multi-dimensional ‘space’ and learning takes place for test instances when their position in this space is established. The simplest lazy learner algorithm is k nearest neighbours. This algorithm initially assembles a database of training data in n-dimensional space (Schliep & Hechenbichler, Citation2014) where the relative position of each data observation in a specific dimension is determined by the value of the observation on a corresponding variable. For prediction, the test data is compared to each member of this database and the k that are most similar to it are identified and some aggregation of their k outcomes (usually a mean or median) is used to estimate the outcome for the test instance. An alternative approach is adopted by self-organising maps, which arranges training data into a two dimensional map space so that similar data are placed together in the same group (Wehrens & Buydens, Citation2007). New test data is allocated to the group that it is most similar to and its predicted outcome is again a function of the outcomes of its fellow group members. Groups are commonly arranged as neighbouring squares (which can have 4 adjacent groups) or hexagons (with up to 6 adjacent groups) with adjacent groups being more similar than distant groups.
Divide and conquer
These algorithms are largely tree-based algorithms, consisting of nodes which act as routing paths leading to a leaf. Each node typically consists of an if-then condition based on the value of an input attribute. The leaf reached after following a path through a single tree is a constant value, which is the predicted outcome. Recognising the restrictive nature of this outcome, techniques were developed to provide a variety of potential outcomes, one of which are random forests. The random forest machine learning approach builds a collection of these trees based on perturbations of the input training data (M. N. Wright, Citation2016), and during the testing stage, each item of testing data is feed through this collection of trees to provide a range of outcomes, and these outcomes are aggregated to arrive at a predicted outcome. Gradient boost machines (Ridgeway, Citation2015) also use a series of tree based models, however here each successive trees are built on the residuals or predictive errors from a previous tree. Thus subsequent trees will attempt to better predict those training data that are not well predicted by the previous trees. Again, test data items are feed through these trees to produce an aggregated outcome amongst all the trees.
Regression
The three algorithms discussed here are similar to tradition regression approaches in that they hypothesis a formulaic relationship between input data and an outcome. However, they are designed to capture well non-linear relationships. The first algorithm is a support vector machine (SVM) (Smola & Schölkopf, Citation2004; Zeileis, Hornik, Smola, & Karatzoglou, Citation2004). Such algorithms fit a relationship to the training data that uses the absolute differences, rather than the squared differences, to measure goodness of fit, thereby reducing the influence of outlying training data on the relationship. New outcomes for test instances can then be predicted. Multivariate adaptive regression splines estimate a regression equation that incorporates ‘knots’, ‘bends’ or ‘elbows’ in the relationship which are selected to better represent any non-linearity (Milborrow, Citation2015). The position of each knot is determined by how well the presence of this knot predicts the known outcomes. Information on unknown instances can then be fed into this knotted equation to arrive at a prediction. The third regression algorithm is artificial neural networks (Venables & Ripley, Citation2013). These networks are composed of a set of linked nodes. A range of input data feeds into each node and is aggregated using a non-linear function and transmitted to other nodes. To better understand and structure this process, the nodes are commonly arranged in layers. There is an initial input layer, usually with one node per input attribute. These input nodes feed into a ‘downstream’ hidden layer of nodes, whose size, in terms of the number of nodes is customisable. This hidden layer then feeds into the output layer. Outputs from this layer provide the predicted value. Each training instance will be transmitted through the network to indicate an outcome. During this training the parameters which aggregate the layers of input data are revised so that these outcomes better match the know outcomes. Once a network has been trained, a new test instance can be feed through the network to arrive at a predicted outcome.
Hybrid
The Cubist algorithm (M Kuhn et al., Citation2013) is a combination of a tradition decision tree and regression equations. The structure of the algorithm resembles a decision tree, however at the leaf of this tree there is an estimated regression equation rather than a constant. It is the prediction of this regression equation that determines the outcome. Cubist trees tend to be shallow, containing few branching nodes. Like with random forests a number of ‘committees’ (essentially each committee is a distinct tree, with regression equations at the leaves) can be built using slight perturbations of the input data. In such cases, the predicted outcome is again some function of all the predicted outcomes from each committee.
All these algorithms allow for a variety of non-linear relationships between the predictor e-petitions and the vote Leave share, and the form of this non-linearity is determined by the data rather than imposed by the analysts. However, these algorithms are complex methods and it is often difficult to fully disentangle the processes that are being undertaken to both fit the algorithm and provide the predictions. This difficulty is why it is important to test the performance of such trained algorithms on representative, unseen, testing data.
In addition a generalised linear model (GLM) of the binomial family is fitted to the training data. This is the natural statistical model choice for such data as these. The advantage of such a model is that its parameter values are easily interpreted.
Experimental procedure
As discussed earlier, in fitting supervised machine learning algorithms it is necessary to split the instances and their outcomes into those to be used for training and those for testing. However known outcomes are available for only a small proportion of the WPC’s (68 where WPCs intersect geographies for known counts and 107 WPCs from the BBC data). In reality, since the postal votes for the 107 BBC counts may not be correctly allocated to WPCs, there are only 68 WPCs where we are sure of the outcome and can confidently use them as training and testing data sets. This number is too small and may potentially present a biased sample (for example, 12 of the 68 (18%), are urban Scottish WPCs in Edinburgh or Glasgow).
In order to overcome this issue, a new geography of data zones (DZs) is proposed to increase the sample size of known referendum outcomes. The essential properties of these DZs are that they are contiguous and that no CA or WPC belongs to more than one DZ (i.e. CA and WPC boundaries do not cross the boundary of a DZ). Thus it is possible to aggregate up both CAs and WPCs to DZs (much as was done by Marriott (Citation2017)). What this means in practice is summarised in (As with Hanretty (Citation2017a), Northern Ireland is excluded from this analysis). There is one WPC (Orkney and Shetland) which is an aggregation of two CAs, then there are 35 CAs that are co-terminus with a WPC, and 55 CAs that are exact aggregations of a number of WPCs (on average 2.9 WPCs). Finally there are 288 CAs that have to be aggregated along with 438 WPCs to form 82 DZs (here each DZ is on average composed of 3.4 CAs and 5.3 WPCs). The impact of aggregating CAs to DZs on the geographic distribution of the outcome of the EU referendum vote is shown in , which shows the support for Leave on these two geographies. The result has been to smooth the range of referendum outcomes in the DZs relative to CAs. The figures S1 to S25 in the supplementary material also map the level of support for each e-petition in WPCs as geographic maps, cartograms and also DZs. The supplementary material also includes the R workspace and analysis script for investigation and re-analysis.
Table 2. Allocation of Counting Areas and Westminster Parliamentary Constituencies to Data Zones (not including Northern Ireland).
The experimental procedure involves training the various machine learning algorithms on 140 of the 173 (81%) DZs, retaining 33 (19%) to test the predictive performance. The training is done using the framework made possible within the R package caret (Max Kuhn, Citation2008). The optimisation of the parameters is done using 10 repetitions of a 10-fold cross validation, with the R2 statistic used as the metric of goodness of fit. The training and testing predictive performance is reported using both a Root Mean Square Error (RMSE) and an R2 statistic, the lower the RMSE the better and the higher the R2 the better (see chapter 5 of Max Kuhn and Johnson (Citation2013)). The best performing algorithm in predicting the test data is then re-trained using all the 173 observations in the DZ data and then used to predict the outcome for the 632 English, Welsh and Scottish WPCs. Of significance here is that we have used one geography, DZs, for both training and testing and applied the best performing algorithm to predict at a separate geography, WPC.
EU referendum estimates for westminster parliamentary constituencies
The time taken to select an optimal set of parameters for each algorithm and perform a final fit during the training stage on an i7-4790 PC with 16GB of RAM is typically less than 1 minute, with the longest algorithm, BagEarth, taking just under 4 minutes.
Training
During the final model fit stage of training, statistics are collected on the predictive performance based on 100 samples (10 repetitions of a 10-fold cross validation). The distribution of the two goodness of fit statistics are given in and . In terms of both average performance and the consistency of performance (measured by the inter-quartile range (IQR) of the statistic) the Cubist algorithm performs best. The next three algorithms, neural networks, MARS/BagEarth and SVM all return similar performances. The two worst performers are the SOM and GBM.
Table 3. Training performance (RMSE).
Table 4. Training performance (R2).
Testing
Recall that 33 (19%) of the DZs were held back for testing purposes. To evaluate the predictive performance on these unseen DZs the eight trained algorithms and the GLM are tested against the known proportion of Leave vote in these 33 DZs, and to measure predictive performance the RMSE and R2 are calculated. shows the scatter plot of the known share for Leave (x axis) against the estimate (y axis) from the eight algorithms and the GLM and shows the fit statistics. The relative performance between the algorithms here is consistent with their performance during training, with Cubist performing best.
Table 5. Testing Performance (RMSE and R2).
Cubist
Evidence from both the training and testing exercises suggests that the Cubist algorithm performs best of the eight. This is somewhat fortuitous since this is probably the easiest to understand algorithm. By examining the structure of these rules and the attributes used in the regressions, it is possible to identify the important attributes in the model. captures the essential details of the 15 committees (row1), covering 31 rules (row 2). Throughout this table, a blue colour signifies an influence towards Leave whilst a yellow an influence towards Remain. For the tree component shown at the top of this table, only three e-petitions are used, one that is pro-immigration (I.Pro.105991), one that wants to stop the printing of a pro-EU leaflet (P.StopEULeaflet.116762) and one that calls for greater use of the meningitis vaccine (H.Meningitis.108072) (rows 3, 4 and 5). A plus (+) indicates that the rule branches towards a high value for this e-petition, whilst a negative (−) is a branch to a low value. Note that committees 4,6,8,10,12 and 14 have no tree component, just a regression equation. Following these tree components there is information on the regression equations at the leaf. Row 6 is the intercept term for the regression equation, if this value is low then there is reduced support for Leave. In the remainder of the table (rows 7 onwards) are the co-efficient (where available) for these regression equations. A negative value here indicates reduced support for Leave. (The detail for committee 1 and 5 are given as examples in Figure SA of the supplementary material.)
Table 6. Attributes in the final Cubist modelFootnote 2 .
Notable features in this table are:
-
A branch to high support for immigration estimates a smaller constant for Leave, and vis-a-versa;
-
A branch to a low support for banning an EU leaflet estimates a smaller constant for Leave, and vis-a-versa;
-
The e-petition on meningitis is rarely used and when it is high support estimates a smaller constant for Leave;
-
Negative co-efficients that reduce the vote for Leave are associated with e-petitions in favour of immigration, a ban on sugary drinks, fairer pensions for women, that Donald Trump should not be allowed into the UK and no confidence in the health minister;
-
Positive co-efficients that increase the vote for Leave are associated with opposition to immigration, stopping the production of a pro-EU leaflet, that parents should be allowed to take their child out of school for up to 2 weeks, opposition to the closure of local tax offices and the inclusion of arts topics in a national examination;
-
Of the 25 candidate e-petitions, only 16 are actually used by the algorithm.
These findings are in line with expectations, both when considering the three tree branching attributes and the regression equations. Areas where support is high for immigration, greater regulation and the state to provide support, tend to have lower votes for Leave, whilst those areas with high opposition to immigration, an EU leaflet and state intervention in their family lives tend to have higher votes for Leave.
Estimation of leave vote in WPC
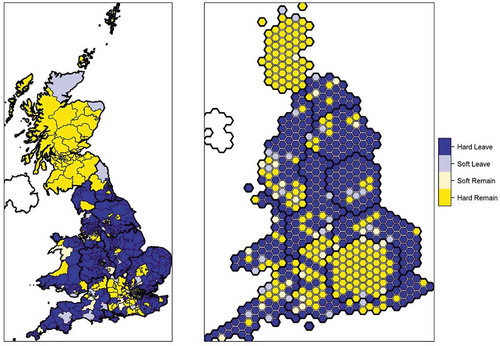
Having established that the Cubist algorithm is best suited to the task of predicting the Leave votes share, it is re-trained using all 173 DZs and used to predict the Leave share in each WPC best (the prediction errors at the DZ geography for this model are given in Figure SB of the supplementary material). A matrix scatter plot of the estimates by Hanretty, Marriott and the Cubist algorithm is provided in . There is a strong correlation between the three methods. Of the 632 WPCs in England, Wales and Scotland, all three estimates agree that 372 (58%) voted for Leave whilst 201 (32%) voted for Remain. The geographic distribution of this agreement is shown in , where WPCs are classified as Hard Leave (if all three methods agree on a Leave vote), Soft Leave (if any two methods agree on a Leave vote), Soft Remain (if two agree on Remain) and Hard Remain (if all agree on Remain). This illustrates the good agreement between the three methods and, where there is disagreement, this is probably not a spatial effect.
Discussion
The impact of the decision for the UK to leave the EU will be keenly felt in many sectors of the UK economy and in people’s daily lives. There are also international ramifications that will alter the UK’s relationships not only with those remaining in the EU, but also with those nations who the UK wishes to forge new trading and diplomatic links with. Unfortunately the most useful information, the numbers who voted Leave and Remain is not universally available at the most pertinent political geography of WPCs. This omission has led to the production of estimate of these counts.
Whilst other studies have used census data (Hanretty, Citation2017a) and General election information (Marriott, Citation2017) to produce these estimates, we believe this study is novel in two respects. Firstly, it uses a diverse and dynamic source of information on political sentiment captured by signatories to important UK government e-petitions as input data. Secondly, it uses a range of machine learning algorithms rather than traditional regression or ad-hoc approaches. This highlights that such approaches are just one of a range of modelling approaches and there is scope for political scientists to apply machine learning algorithms to gain confirmatory or alternative insight. The predictive performance of each algorithm varies but one algorithm, a hybrid tree based regression algorithm (Cubist) demonstrates the best performance. The interpretation of the straight forward structure of this algorithm is seen to accord with expectations.
The Cubist estimates of Leave vote share correlates strongly with alternative estimates produced by Hanretty (Citation2017a) and Mariott (2017). The work by Hanretty has been widely used by academics (Heath & Goodwin, Citation2017), commentators (Curtice, Citation2017) and the media (Bennett, Citation2017; Hanretty, Citation2017b), including by the British Broadcasting Corporation in its 2017 General election coverage. Our work further corroborates these earlier estimates.
More generally, in this study a model trained on one geography has been successfully applied to a more disaggregate geography. Such approaches are not uncommon, where a model is estimated on one set of data and then used to produce predictions on another, and in a geographic context the technique of Geographically Weighted Regression (Brunsdon, Fotheringham, & Charlton, Citation1998) allows for this separate geography of model estimation and prediction. This flexibility and transferability makes this approach attractive for other estimations. For example, the composition of the House of Commons in the UK Parliament is currently under review, the aims of which are to reduce the number of WPCs from 650 to 600 (Johnston, Pattie, & Manley, Citation2017) and to correct for perceived population biases (Thrasher, Borisyuk, Rallings, Johnston, & Pattie, Citation2016). Given access to the e-petition data geo-recoded to the new constituency boundaries, it would be possible to estimate the Leave vote share for these new constituency boundaries using the final Cubist algorithm.
Whilst there are concerns that individuals or interest groups may try to ‘game the system’, checks are in place to try and counter this (British Broadcasting Corporation, Citation2017). In terms of the methodology, one potential weakness is that the aggregation of some CAs to DZs smooths the data, producing fewer data points at the extreme (this is evident in a comparison of the two maps in ). In essence this means that for some WPCs the prediction will be more of an extrapolation than an interpolation.
In this study we have shown that e-petition data is an informative and versatile source of information that gauges the political sentiment in a location and that this sentiment can be used to infer other outcomes. We have also shown how a diverse range of machine learning algorithms, that are suitable for many regression type problems, can be successfully applied. More widely, since legislators in many countries have equivalent e-petition systems in place, there is scope for the results of this study to motivate similar studies in other countries.
Supplemental Material
Download Zip (15.7 MB)Supplemental Material
Download MS Word (116 KB)Acknowledgments
The e-petition data used for this study was downloaded from the UK Parliament’s petition web site (UK Parliament, Citation2017). The votes for Leave and Remain in each CA were obtained from the Electoral Commissions web site (Electoral Commission, Citation2016). The votes for Leave and Remain in selected WPCs were obtained from Hanretty’s Medium blog (Hanretty, Citation2016). This article is dedicated to the memory of Maurice Clark, born 1934, died 2017.
Supplemental data
Supplemental data for this article can be accessed at here.
Additional information
Funding
Notes
1. The territory of Gibraltar and the whole of Northern Ireland are each one CA.
2. The initial letter indicates the general topic of the petition: Immigration, Education, Health, Politics, Libertarian; followed by a brief description; and finally the petition id, as given in . A blue colour indicates an influence towards a higher Leave vote whilst a yellow an influence towards Remain.
References
- Beecham, R. , Slingsby, A. , Brunsdon, C. , & Radburn, R. (2017). Spatially varying explanations behind the UKs vote to leave the EU. GISRUK 2017 Proceedings .
- Bennett, O. (2017). The 9 MPs Most At Risk From Losing Their Seats By Voting For Article 50. HUFFPOST, United Kingdom . Retrieved from http://www.huffingtonpost.co.uk/entry/article-50-brexit-mps-backlash_uk_588b6a84e4b02f223a01b3b7
- Bochel, C. , & Bochel, H. (2016). ‘Reaching in’? The potential for e-petitions in local government in the United Kingdom. Information, Communication & Society , 20(5), 683–699. doi:10.1080/1369118x.2016.1203455
- Briassoulis, H. (2010). Online petitions: New tools of secondary analysis?. Qualitative Research , 10(6), 715–727. doi:10.1177/1468794110380530
- Bright, J. , & Margetts, H. (2016). Big Data and Public Policy: Can It Succeed Where E‐Participation Has Failed?. Policy & Internet , 8(3), 218–224. doi:10.1002/poi3.130
- The British Election Study Team . (2016). Brexit Britain: British Election Study Insights from the post-EU Referendum wave of the BES internet panel. Britsih Election Study . Retrieved from http://www.britishelectionstudy.com/bes-resources/brexit-britain-british-election-study-insights-from-the-post-eu-referendum-wave-of-the-bes-internet-panel/
- Brunsdon, C. , Fotheringham, S. , & Charlton, M. (1998). Geographically weighted regression. Journal of the Royal Statistical Society: Series D (The Statistician) , 47(3), 431–443.
- Clark, S. , Lomax, N. , & Morris, M. A. (2017). Classification of Westminster Parliamentary constituencies using e-petition data. EPJ Data Science , 6(1), 16. doi:10.1140/epjds/s13688-017-0113-9
- Coleman, D. (2016). A Demographic Rationale for Brexit. Population and Development Review , 42(4), 681–692. doi:10.1111/padr.12014
- British Broadcasting Corporation . (2017). Reality Check: Can we believe petition signature numbers? Retrieved from http://www.bbc.co.uk/news/uk-politics-38828663
- Cortes, C. , & Vapnik, V. (1995). Machine Learning. Support Vector Networks , 20(3), 25. doi:10.1007/Bf00994018
- Curtice, J. (2017). Labour’s Richmond problem: Why isn’t the party more worried about losing Remain supporters to the Lib Dems?. Juncture , 23, 4. doi:10.1111/newe.12028
- Directorate-General for Internal Policies . (2015). The Right to Petition EU . Retrieved from http://www.europarl.europa.eu/RegData/etudes/STUD/2015/519223/IPOL_STU(2015)519223_EN.pdf
- Dodd, G. (2007). Justice and grace: Private petitioning and the English parliament in the late Middle Ages. Oxford: Oxford University Press, United States of America.
- Domingos, P. (2012). A few useful things to know about machine learning. Communications of the ACM , 55(10), 78–87. doi:10.1145/2347736.2347755
- Dumas, C. , Harrison, T. M. , Hagen, L. , Zhao, X. (2017). What Do the People Think?: E-Petitioning and Policy Decision Making. In: Paulin A., Anthopoulos L., Reddick C. (eds) Beyond Bureaucracy. Public Administration and Information Technology, vol 25. Springer, Cham. https://doi.org/10.1007/978-3-319-54142-6_12
- Dumas, C. , LaManna, D. , Harrison, T. M. , Ravi, S. , Hagen, L. , Kotfila, C. , & Chen, F. (2015a). E-petitioning as collective political action in We the People. iConference 2015 Proceedings.
- Dumas, C. L. , LaManna, D. , Harrison, T. M. , Ravi, S. , Kotfila, C. , Gervais, N. , … Chen, F. (2015b). Examining political mobilization of online communities through e-petitioning behavior in We the People. Big Data & Society, 2(2), 2053951715598170. doi:10.1177/2053951715598170.
- Electoral Commission . (2016). EU referendum results. Retrieved from https://www.electoralcommission.org.uk/find-information-by-subject/elections-and-referendums/past-elections-and-referendums/eu-referendum/electorate-and-count-information
- Friedman, J. H. (1991). Multivariate adaptive regression splines. The Annals of Statistics , 19, 1–67. doi:10.1214/aos/1176347963
- Friedman, J. H. (2001). Greedy Function Approximation: A Gradient Boosting Machine. The Annals of Statistics , 29(5), 1189–1232. doi:10.1214/aos/1013203451
- Goodwin, M. J. , & Heath, O. (2016). The 2016 Referendum, Brexit and the Left Behind: An Aggregate‐level Analysis of the Result. The Political Quarterly , 87(3), 323–332. doi:10.1111/poqu.2016.87.issue-3
- Hagen, L. , Harrison, T. M. , Uzuner, Ö. , Fake, T. , Lamanna, D. , & Kotfila, C. (2015). Introducing textual analysis tools for policy informatics: A case study of e-petitions . Paper presented at the Proceedings of the 16th Annual International Conference on Digital Government Research.
- Hanretty, C. (2016). The EU referendum: how did Westminster constituencies vote? Retrieved from https://medium.com/@chrishanretty/the-eu-referendum-how-did-westminster-constituencies-vote-283c85cd20e1
- Hanretty, C. (2017a). Areal interpolation and the UK’s referendum on EU membership. Journal of Elections, Public Opinion and Parties , 27(4), 1–18. doi:10.1080/17457289.2017.1287081
- Hanretty, C. (2017b). Stoke-on-Trent would be Ukip’s battleground of choice. The Guardian. https://www.theguardian.com/uk-news/2017/jan/14/ukip-prospect-stoke-on-trent-voted-leave
- Harris, R. , & Charlton, M. (2016). Voting out of the European Union: Exploring the geography of Leave. Environment and Planning A: Economy and Space , 48(11), 2116–2128. doi:10.1177/0308518x16665844
- Hastie, T. , & Tibshirani, R. (1996). Discriminant adaptive nearest neighbor classification. IEEE Transactions on Pattern Analysis and Machine Intelligence , 18(6), 607–616. doi:10.1109/34.506411
- Heath, O. , & Goodwin, M. (2017). The 2017 General Election, Brexit and the Return to Two‐Party Politics: An Aggregate‐Level Analysis of the Result.. The Political Quarterly , 88(3), 345–358. doi:10.1111/poqu.2017.88.issue-3
- Helm, D. (2017). Oxford Review of Economic Policy. Agriculture after Brexit , 33(suppl_1), S124–S133. doi:10.1093/oxrep/grx010
- Hepburn, C. (2017). The economics of Brexit: What is at stake?. Oxford Review of Economic Policy , 33(suppl_1), S1–S3. doi:10.1093/oxrep/grx011
- Hough, R. (2012). Do Legislative Petitions Systems Enhance the Relationship between Parliament and Citizen?. The Journal of Legislative Studies , 18(3–4), 479–495. doi:10.1080/13572334.2012.706057
- Huang, S.-W. , Suh, M. M. , Hill, B. M. , & Hsieh, G. (2015). How Activists Are Both Born and Made: An Analysis of Users on Change. org . Paper presented at the Proceedings of the 33rd Annual ACM Conference on Human Factors in Computing Systems.
- Jackson, D. , Thorsen, E. , & Wring, D. (2016). EU Referendum Analysis 2016: Media, Voters and the Campaign (1910042099). Retrieved from http://www.referendumanalysis.eu/
- Johnston, R. , Pattie, C. , & Manley, D. (2017). Britain’s changed electoral map in and beyond 2015: The importance of geography. The Geographical Journal , 183(1), 58–70. doi:10.1111/geoj.12171
- Andreas Jungherr, A., & Theocharis, Y. (2017). The empiricist’s challenge: Asking meaningful questions in political science in the age of big data, Journal of Information Technology & Politics, vol 14, no 2, pp97-109, doi: 10.1080/19331681.2017.1312187.
- Karpf, D. (2016a). The Organizational Logic of Petition Platforms Analytic activism: Digital listening and the new political strategy. Oxford University Press, United States of America.
- Karpf, D. (2016b). Understanding Analytics, Algorithms, and Big Data Analytic activism: Digital listening and the new political strategy. Oxford University Press, United States of America.
- Kohonen, T. (1995). Self-organizing maps, volume 30 of Springer Series in Information Sciences. Heidelberg: Springer, Berlin, Germany.
- Kuhn, M. (2008). Building Predictive Models in R Using the caret Package. Journal of Statistical Software , 28(5), 26. Retrieved from <Go to ISI>://WOS:000260799600001. doi:10.18637/jss.v028.i05
- Kuhn, M. , & Johnson, K. (2013). Applied predictive modeling (Vol. 26). Springer, New York, United States of America.
- Kuhn, M. , Weston, S. , Keefer, C. , Coulter, N. , & Quinlan, R. (2013). Cubist: Rule-and Instance-Based Regression Modeling. R package version 0.0. 15. Retrieved from http://CRAN.R-project.org/package=Cubist
- Leston-Bandeira, C. (2017). What is the point of petitions in British politics? Retrieved from http://blogs.lse.ac.uk/politicsandpolicy/what-is-the-point-of-petitions/
- Manley, D. , Jones, K. , & Johnston, R. (2017). The geography of Brexit – What geography? Modelling and predicting the outcome across 380 local authorities. Local Economy , 32(3), 183–203. doi:10.1177/0269094217705248
- Marriott, J. (2017). EU Referendum 2016 #1 – How and why did Leave win and what does it mean for UK politics? (a 4-part special). Retrieved from https://marriott-stats.com/nigels-blog/brexit-why-leave-won/
- Mayhew, K. (2017). UK higher education and Brexit.. Oxford Review of Economic Policy , 33(suppl_1), S155–S161. doi:10.1093/oxrep/grx012
- McKenna, H. (2016). Five big issues for health and social care after the Brexit . Retrieved from https://www.keele.ac.uk/media/keeleuniversity/fachealth/cml/readingmaterials/Five%20big%20issues%20for%20health%20and%20social%20care%20after%20the%20Brexit%20vote.pdf
- Milborrow, S. (2015). Earth: Multivariate adaptive regression splines. Retrieved from http://CRAN.R-project.org/package=earth
- Miller, L. (2008). e-Petitions at Westminster: The Way Forward for Democracy?. Parliamentary Affairs , 62(1), 162–177. doi:10.1093/pa/gsn044
- Portes, J. , & Forte, G. (2017). The economic impact of Brexit-induced reductions in migration. Oxford Review of Economic Policy , 33(suppl_1), S31–S44. doi:10.1093/oxrep/grx008
- Priddy, K. L. , & Keller, P. E. (2005). Artificial Neural Networks: An Introduction. SPIE Press, Bellingham, Washington, United States of America.
- Puschmann, C. , Bastos, M. T. , & Schmidt, J.-H. (2016). Birds of a feather petition together? Characterizing e-petitioning through the lens of platform data. Information, Communication & Society , 20(2), 203–220. doi:10.1080/1369118x.2016.1162828
- Quinlan, J. R. (1993). Combining instance-based and model-based learning . Paper presented at the Proceedings of the Tenth International Conference on Machine Learning.
- Ridgeway, G. (2015). gbm: Generalized boosted regression models. Retrieved from http://CRAN.R-project.org/package=gbm
- Rosenbaum, M. (2016). Local voting figures shed new light on EU referendum. Retrieved from http://www.bbc.co.uk/news/uk-politics-38762034
- Schliep, K. , & Hechenbichler, K. (2014). kknn: Weighted k-nearest neighbors. R Package. Version, 1.2-5. https://cran.r-project.org/web/packages/kknn/index.htm
- Smola, A. J. , & Schölkopf, B. (2004). A tutorial on support vector regression. Statistics and Computing , 14(3), 199–222. doi:10.1023/B:STCO.0000035301.49549.88
- Thrasher, M. , Borisyuk, G. , Rallings, C. , Johnston, R. , & Pattie, C. (2016). Electoral bias at the 2015 general election: Reducing Labour’s electoral advantage. Journal of Elections, Public Opinion and Parties , 26(4), 391–411. doi:10.1080/17457289.2016.1202253
- UK Parliament . (2017). Petitions, UK Government and Parliament. Retrieved from https://petition.parliament.uk/
- Venables, W. N. , & Ripley, B. D. (2013). Modern applied statistics with S-PLUS. Springer Science & Business Media, New York, United States
- Wehrens, R. , & Buydens, L. M. (2007). Self-and super-organizing maps in R: The Kohonen package. J Stat Softw , 21(5), 1–19. doi:10.18637/jss.v021.i05
- Wright, M. N. (2016). ranger: A fast implementation of random forests, 2016. Retrieved from http://CRAN.R-project.org/package=ranger doi:10.1016/j.amjms.2015.11.019
- Wright, S. (2012). Assessing (e-) democratic innovations:“Democratic goods” and Downing Street e-petitions. Journal of Information Technology & Politics , 9(4), 453–470. doi:10.1080/19331681.2012.712820
- Wright, S. (2015a). E-petitions. In S. Coleman & D. Freelon (Eds.), Handbook of Digital Politics (pp. 29). Edward Elgar Publishing Limited, Cheltenham, United Kingdom.
- Wright, S. (2015b). ‘Success’ and online political participation: The case of Downing Street E-petitions. Information, Communication & Society , 19(6), 843–857. doi:10.1080/1369118x.2015.1080285
- Wu, X. , Kumar, V. , Ross Quinlan, J. , Ghosh, J. , Yang, Q. , Motoda, H. , … Steinberg, D. (2007). Top 10 algorithms in data mining. Knowledge and Information Systems , 14(1), 1–37. doi:10.1007/s10115-007-0114-2
- Yasseri, T. , Hale, S. A. , & Margetts, H. (2013). Modeling the rise in internet-based petitions. arXiv preprint. August 2016. arXiv:1308.0239.
- Yeoh, P. (2016). UK Financial Services Sector’s Future on Leaving the European Union. Business Law Review , 37(5), 175–180.
- Zeileis, A. , Hornik, K. , Smola, A. , & Karatzoglou, A. (2004). kernlab-an S4 package for kernel methods in R. Journal of Statistical Software , 11(9), 1–20.