
ABSTRACT
Despite having therapeutic potential, anti-PrP antibodies caused a major controversy due to their neurotoxic effects. For instance, treating mice with ICSM antibodies delayed prion disease onset, but both were found to be either toxic or innocuous to neurons by researchers following cross-linking PrPC. In order to elucidate and understand the reasons that led to these contradictory outcomes, we conducted a comprehensive in silico study to assess the antibody-specific toxicity. Since most therapeutic anti-PrP antibodies were generated against human truncated recombinant PrP91−231 or full-length mouse PrP23−231, we reasoned that host specificity (human vs murine) of PrPC might influence the nature of the specific epitopes recognized by these antibodies at the structural level possibly explaining the ‘toxicity’ discrepancies reported previously. Initially, molecular dynamics simulation and pro-motif analysis of full-length human (hu)PrP and mouse (mo)PrP 3D structure displayed conspicuous structural differences between huPrP and moPrP. We identified 10 huPrP and 6 moPrP linear B-cell epitopes from the prion protein 3D structure where 5 out of 10 huPrP and 3 out of 6 moPrP B-cell epitopes were predicted to be potentially toxic in immunoinformatics approaches. Herein, we demonstrate that some of the predicted potentially ‘toxic’ epitopes identified by the in silico analysis were similar to the epitopes recognized by the toxic antibodies such as ICSM18 (146–159), POM1 (138–147), D18 (133–157), ICSM35 (91–110), D13 (95–103) and POM3 (95–100). This in silico study reveals the role of host specificity of PrPC in epitope-specific anti-PrP antibody toxicity.
1. Introduction
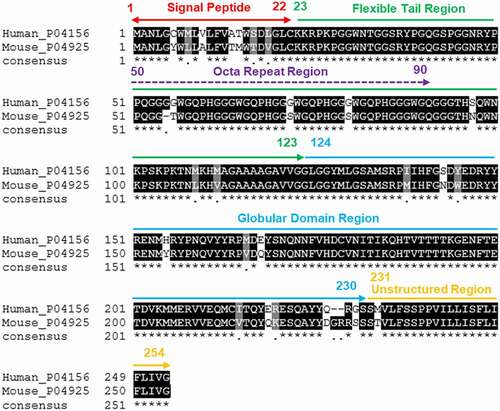
Prion diseases are believed to be caused by the pathogenic conversion of the cellular prion protein (PrPC) to an abnormal and partially protease resistant PrPSc [Citation1,Citation2]. The Prnp gene encodes the prion protein and this gene is located on chromosome 2 in mice and on chromosome 20 in human [Citation3,Citation4]. Structurally, usually PrPC is divided in a structured C-terminal domain (containing GPI anchor attachment site) and an internally disordered N-terminal domain, two N-linked glycosylation sites, and a single disulphide bridge [Citation5,Citation6]. The N-terminal end of the mature PrP protein contains a positively charged motif involved in endocytic trafficking [Citation7–9]. In addition, in the N-terminal domain there is a series of four octapeptide repeats, each of which contains a histidine residue that helps coordinate the binding of divalent metal ions [Citation10,Citation11]. Human PrPC is made up of 253-amino acid residues that is trimmed down to 209-amino-acids after the C- and N-terminal signal peptides are removed [Citation12,Citation13]. On the other hand, prior to post-translational changes, the mouse PrPC is a 254 amino acid protein that matures to a 208 amino acid residues [Citation14]. The full-length human PrP (huPrP) and mouse PrP (moPrP) are divided into three major parts, including the flexible tail (FT) region (23–123), the octapeptide repeat (OR) region (50–90) located within the FT region and the globular domain (GD) region (124–230).
Antibody-mediated therapy is considered the most promising treatment strategy for prion diseases [Citation15–25]. Several anti-PrP antibodies have shown potential for the treatment of prion diseases, including 6H4 [Citation26], ICSM18, ICSM35 [Citation27], POM1, POM2, POM3 [Citation28], D13, D18 [Citation29,Citation30] and SAF32, SAF70 [Citation31,Citation32]. However, some of these antibodies caused hippocampal toxicity [Citation33,Citation34]. Some of the anti-PrP antibodies such as ICSM35, D13 (FT region) [Citation33–36] and ICSM18, D18 (GD region) [Citation33–35] that shared similar epitope sequences showed contradictory results in several studies. A study by Solforosi and co-workers showed that anti-PrP D13 antibody (epitope 95–105) caused widespread neuronal loss in the hippocampal region following stereotaxic injection [Citation34]. Further, Reimann et al. confirmed that D13 antibody induced fast, dose-dependent, on-target (hippocampus) neurotoxicity [Citation33]. Stereotaxic injection of ICSM18 (epitope 143–153) in the hippocampal region of C57BL/10 mice did not show extensive neuronal apoptosis [Citation35]. In contrast, a comprehensive follow up study by Reimann et al. revealed that intracerebral ICSM18 antibody injection to C57BL/10 mice induced fast, dose-dependent, on-target neurotoxicity [Citation33]. Moreover, other studies using POM1 monoclonal antibody that shares a similar epitope with ICSM18 has also led to severe neurotoxicity [Citation36–38]. Administration of an octa-repeat (OR)-specific antibody, 4H11 antibody, led to behavioural deficits and extensive neuronal loss and astrogliosis in mice [Citation39]. However, POM2 antibody, which also binds an epitope on the OR region did not show any toxicity [Citation33,Citation36]. Of note, a humanized version of ICSM18, known as PRN100, did not cause apoptosis in the hippocampus of C57BL/10 mice [Citation35]. In fact, Klyubin et al. showed that peripheral administration of PRN100 blocks acute Aβ synaptotoxicity [Citation40].
Aside from the host specificity of PrPC (human vs mouse), it is important to also note the differences in the type of the immunogens used to produce the anti-PrP antibodies (full-length vs truncated; recombinant vs native). For instance, D13 and D18 antibodies were panned against dispersed Syrian hamster PrP (SHaPrP 27–30) by immunizing the Prnp0/0 mice [Citation29], while ICSM18 and ICSM35 antibodies were produced by immunizing Prnp0/0 mice using human truncated recombinant αPrP 91-231 or βPrP 91-231 conformations respectively [Citation27]. Recombinant αPrP 91-231 is a soluble α-helical monomer that is susceptible to proteinase K, whereas βPrP 91-231 is a soluble monomer with a high β-sheet content and partially resistant to treatment with proteinase K [Citation41]. Furthermore, POM antibodies were produced by immunizing the Prnp0/0 mice using mouse full-length recombinant αPrP 23-231 [Citation28].
The structure of full-length huPrP and moPrP protein is not available in the Protein Database (PDB) (https://www.rcsb.org/). It is worth noting that there is a substantial sequence differences (12.65%, as shown by multiple sequence analyses) between the huPrP and moPrP protein sequences. Moreover, a single amino acid residue changes in the protein may affect the protein structure and epitope identification. Study showed that a single amino acid changes in the intermediate proteins of two different alleles (prnpa and prnpb genes) of the prion protein can alter different aspects of protein biochemistry and can impact in the protein structural and functional levels [Citation42]. Since there is amino acid variation between the huPrP and moPrP sequences, therefore the number of epitopes and their position might be different in protein structure of huPrP and moPrP. We hypothesized that the host specificity of PrPC might influence the nature of specific epitopes recognized by these antibodies at the structural level that might also explain the ‘toxicity’ discrepancies reported previously.
B-cell epitope prediction using in silico tool helps facilitate the identification of B-cell epitopes for antibody production against the epitopes or antigen within a short time in comparison with the experimental methods [Citation43]. B-cell epitopes are subdivided into two categories, including linear or continuous and conformational or discontinuous epitopes. Linear B-cell epitopes are predicted by using a linear sequence of a protein while the discontinuous epitopes are predicted from the protein tertiary structure.
In this study, we performed in silico analysis of the full-length PrPC 3D structure prediction using the comparative protein modelling approach [Citation44] and 300 ns molecular dynamics simulation for stability checking [Citation45,Citation46]. Further, we used immune-informatic approaches for predicting the linear and conformational B-cell epitopes to observe whether there are differences in the identified epitopes and their position on huPrP and moPrP. In addition, we also predicted the potential toxicity of the identified linear B-cell epitopes to compare with the reported anti-PrP antibody toxic effects [Citation33,Citation34,Citation36]. We found 10 linear and 9 conformational B-cell epitopes for huPrP and 6 linear and 5 conformational B-cell epitopes for moPrP protein 3D structure. Furthermore, this study might help to understand the reason behind the ‘toxicity’ discrepancies of different anti-PrP antibodies.
2. Results
2.1. Analysis of the physicochemical properties and multiple sequence alignment of the of huPrP and moPrP
The antigenicity of a protein is the pre-requirement for the identification of B-cell epitopes from the protein. To that end, we predicted the antigenicity of both huPrP and moPrP sequences and found an antigenicity score of 0.917398 for huPrP and 0.936409 for moPrP. Herein, summarizes the physicochemical characteristics of huPrP and moPrP. The isoelectric point (pI) indicates the acidic or basic nature of the protein and was found to be 9.13 for huPrP and 9.38 for moPrP. On the other hand, the instability index (II) for huPrP is 43.11 and 38.44 for moPrP, highlighting the unstable nature of huPrP. Additionally, the aliphatic index (AI) for huPrP and moPrP showed moderate thermostability with values of 52.37 and 54.06, respectively. The grand average hydropathy (GRAVY) for huPrP was −0.567 and −0.609 for moPrP respectively, indicating the hydrophilic nature of both proteins. The multiple sequence alignment analysis by ClustalW server showed that there is 87.35% similarity between huPrP and moPrP. The differences between huPrP and moPrP sequences are shown in . In this in silico study, significant differences were found in amino acid positions 6, 8, 10, 14, 15, 17 and 19 of the signal peptide regions of huPrP and moPrP where 6 CYS has been replaced by 6TYR and the other changes were observed in 8 (MET→LEU), 10 (VAL→ALA), 14 (ALA→THR), 15 (THR→MET), 17 (SER→THR) and 19 (LEU→VAL) in moPrP. In the octa repeat region, differences in positions 56 (GLY→THR), 72 (GLY→SER) and 80 (GLY→SER) were observed. In the flexible tail region away from the octa repeat region, there were some additional differences observed in positions 97 (SER→ASN), 109 (MET→LEU) and 112 (MET→VAL) (). Significant amino acid differences were found in the globular domain of moPrP in comparison with in huPrP. The changes were found in positions 138 (ILE→MET), 143 (SER→ASN), 145 (TYR→TRP), 155 (HIS→TYR), 166 (MET→VAL), 168 (GLU→GLN), 215 (ILE→VAL), 219 (GLU→GLN), 220 (ARG→LYS) and 227 (GLN→ASP) ().
Table 1. Physicochemical properties of the human and mouse major prion proteins
Figure 1. Multiple sequence alignment (MSA) between the huPrP and moPrP
2.2. Analysis of the predicted three-dimensional protein structure of huPrP and moPrP structures
In spite of the presence of nuclear magnetic resonance (NMR) spectroscopy 3D structure of human PrP (90–231) and mouse PrP (23–231) [Citation47–49] in protein database (PDB) (https://www.rcsb.org/), we predicted the full length 3D protein structure of both huPrP (1–253) and moPrP (1–254). The full-length huPrP consists of 253 amino acids while moPrP has 254 amino acids, but nuclear magnetic resonance (NMR) spectroscopy structure of both huPrP and moPrP lacks the signal peptide region (1–22) and the unstructured region (231–254). Therefore, we wanted to predict the full-length 3D structure of the huPrP (1–253) and moPrP (1–254) protein using the I-TASSER 3D structure prediction server.
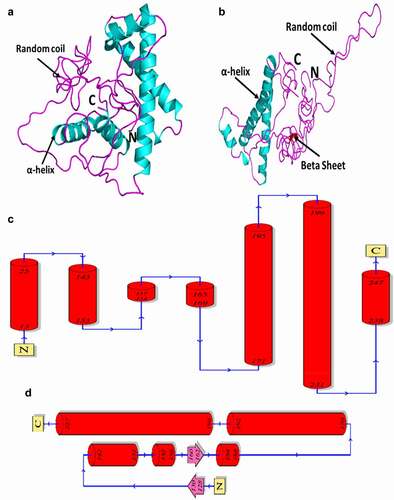
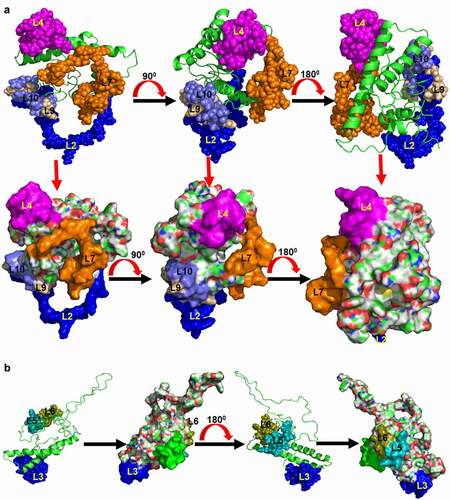
We predicted the 3D structure of huPrP and moPrP using the I-TASSER server and the structures are shown in . The I-TASSER server was used to generate five different models for both huPrP and moPrP based on the best template (PDB id: 2KUN; a solution NMR 3D structure of human PrP90-231). We then selected the best model based on the confidence score (C-score), estimated template modelling score (TM-score) and estimated root mean square deviation (RMSD) score. The C-score was −4.13 and −3.38 for our predicted huPrP and moPrP models respectively. The accepted range of C-score for the protein model is −5, 2 in which the higher value signifies a model with a higher confidence and vice-versa. The estimated TM-score and estimated RMSD score was 0.28 ± 0.09 and 16.0 ± 3.1 Å for the predicted huPrP and 0.34 ± 0.11 and 14.0 ± 3.9 Å, for moPrP. The huPrP structure analysis showed that our predicted structure consisted of α-helices and random coils ()) and in the topology analysis we found that the α-helices are located in positions 13–25, 143–153, 154–157, 165–169, 171–195, 199–231 and 238–247 ()). On the other hand, the moPrP is constituted of α-helix, beta sheet and random coils ()) and in topology analysis the α-helices were found in positions 142–151, 152–156, 164–168, 170–192 and 198–227 while the beta sheets were found in positions 128–130 and 160–162, and the rest of the other amino acids are occupied by random coils ()). The analysis indicated that the predicted huPrP has no beta sheets whereas the moPrP contained two beta sheets although both huPrP and moPrP structures were predicted based on the same template 2KUN through I-TASSER server.
Figure 2. Three-dimensional (3D) structure and topology of the huPrP and moPrP predicted by I-TASSER server
The Ramachandran plot analysis by PDBsum server showed 68.4% residues in most favoured region, 24.7% in allowed regions, 3.7% in generously allowed regions and 3.2% residues in the disallowed regions for the predicted huPrP structure ()). In contrast, in moPrP structure, 59.5% residues were found in most favoured regions, 27.2% residues in allowed regions, 7.7% in generously allowed regions and 5.6% residues in the disallowed regions ()). The Ramachandran plot analysis confirmed that our predicted models are good quality models in which a small portion of amino acid residues are located in the disallowed regions.
Figure 3. Evaluation of the 3D structure of the huPrP and moPrP
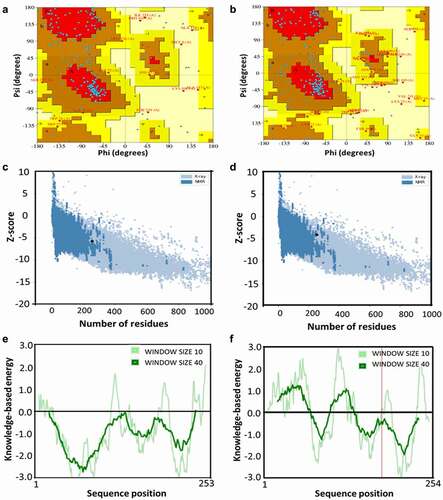
The ProSA server assesses the overall and local model quality of the predicted protein structure. It provides the z-score for overall model quality prediction and found a z-score −5.74 for huPrP () and −4.04 ()) for moPrP located in the acceptable area and validates the good quality of our predicted structures. The local model quality is shown by knowledge-based energy score, in which the positive values represent the erroneous or problematic regions of the input structure. On the other hand, a clear depiction of the sequence position in the negative value area representing the knowledge-based energy, demonstrated the good quality of our predicted huPrP 3D structure ()). On the other hand, in moPrP 3D structure, some of the N-terminal amino acid residues and the amino acids from the middle portion of the moPrP protein ()) were found to be located in the negative region which indicate that predicted moPrP structure has some erroneous region in the protein backbone when compared with the huPrP structure. Finally, the evaluated protein structure was submitted to the PMDB database and assigned an accession number PM0082388 for huPrP and PM0083247 for moPrP.
2.3. Analysis of the stability of human and mouse PrP structures using molecular dynamics simulations
We performed a 300 ns long molecular dynamics simulation using YASARA Dynamics software v17.8 [Citation45,Citation46] and analysed the data based on the root-mean-square deviation (RMSD), radius of gyration (Rg), and root mean square fluctuation (RMSF). The RMSD trajectory is mainly used to predict the stability of the protein structure where the higher RMSD value indicates the lower stability of the protein structure. A 300 ns (300,000 Ps) molecular dynamics simulation revealed that both huPrP and moPrP structures reached a stable state at ~200 ns and continues till the end of the simulation (). In the beginning of the simulation, high fluctuation of RMSD was observed for both huPrP and moPrP protein structure (). However, the template 2KUN (human PrP90-231) reached a stable state at ~140 ns (Figure S1A). The RMSD trajectory value of the huPrP ranges between 0.971 Å and 12.53 Å, which is a high RMSD value and demonstrates the unstable nature of huPrP (). For moPrP, the RMSD trajectory value was between 1.2 Å and 13.985 Å showing a comparatively higher RMSD value than huPrP which revealed the unstable nature of the moPrP protein structure (). However, 300 ns MDS for the template 2KUN showed the RMSD ranges between 0.573 Å and 18.531 Å which is higher than both huPrP and moPrP protein structure.
Figure 4. 300 nanosecond (ns) molecular dynamics simulation (MDS) of the huPrP and moPrP
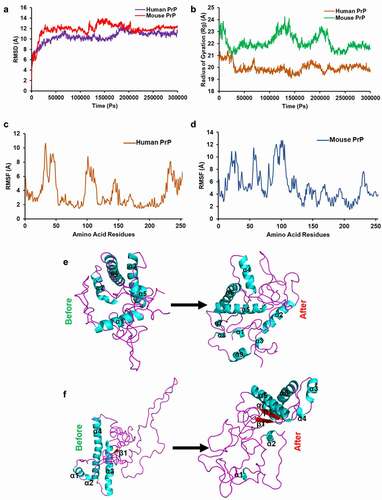
The radius of gyration (Rg) is performed through MDS to assess the overall dimension of the protein. The Rg of protein is the root mean square distance from each atom of the protein to their centre of mass [Citation50]. In our study, the Rg was between 19.081 Å and 21.422 Å for huPrP and 20.835 Å and 24.237 Å for moPrP (). For huPrP 3D structure, the highest Rg value was observed in the first 20 ns with fluctuation and the Rg value was found to be decreased after 20 ns and continued with lower fluctuation (64 ns to 70 ns and 170 ns to 200 ns) till the end of the simulation (). In contrast, for moPrP 3D structure, the high fluctuation of Rg value was observed in ~12 ns, 115–140 ns and 195–215 ns, but average simulation Rg value (~22 Å) was observed throughout the 300 ns simulation (). However, in the template 2KUN, the fluctuation was found in the initial 20 ns and after 20 ns almost similar Rg value was seen throughout the 300 ns simulation (Figure S1B). The results clearly indicate that there are significant differences among the Rg value of the huPrP and moPrP 3D as well as template structure.
The RMSF refers to the mean describing flexibility differences among residues with respect to the average MD simulation conformation [Citation50] where the higher RMSF value implies more flexible movements and low RMSF trajectory value indicates the limited movements or higher compactness during the simulation in relation to its average position [Citation50]. Herein, the RMSF trajectory value of huPrP ranges between 1.486 Å (HIS 187) and 10.634 Å (THR33) (). High fluctuation in our predicted huPrP protein structure can be seen till the end of the 300 ns simulation time period. The high fluctuation can be seen in the position of ARG25-GLY53 (FT region), GLN98-ALA116 (FT region), HIS140-GLU152 (GD region) and GLN227-GLY253 (non-structured region) (). The high RMSF value in these residues positions indicates that these regions are highly flexible and the conformation of the protein structure in these regions might be changed. For moPrP 3D structure, the RMSF trajectory value of the moPrP ranges between 1.548 Å (VAL209) and 12.669 Å (SER102). However, the fluctuation was seen throughout the 300 ns simulation of moPrP 3D structure (). Similarly, the RMSF value for template (human PrP 90–231) was also found to be fluctuated throughout the 300 ns simulation (Figure S1C). In addition, significant structural conformational changes were found after the 300 ns simulation for both huPrP (9 α-helix were found instead of 5 α-helix after MDS) () and moPrP9 (7 α-helix, 2 β-sheets were found instead of 4 α-helix, 1 β-sheets, respectively after MDS) () as well as for template structure (5 α-helix, 3 β-sheets were found instead of only 3 α-helix after MDS) (Figure S1D and S1E).
2.4. Structural differences between human and mouse PrP
The observation on the 3D structure of both huPrP and moPrP displayed differences in α-helices, random coils and β-sheet levels, but the observation in the pro-motif levels showed mainly structural differences between those two proteins. We found 7 helices, 2 helix-helix interacts, 22 beta turns and 10 gamma turns for the huPrP (Figure S2). In contrast, 1 β-sheet, 1 beta hairpin, 2 strands, 5 helices, 2 helix-helix interacts, 58 beta turns, 13 gamma turns, and 1 disulphide bond were found in moPrP (Figure S3). These results clearly revealed that there are substantial structural differences in the motif and pro-motif level of huPrP and moPrP 3D structure.
2.5. Comparative analysis of the linear and conformational B-cell epitopes of human and mouse PrP
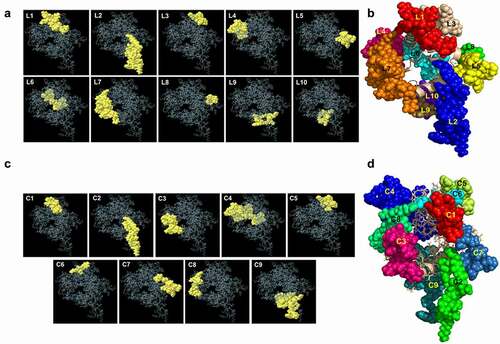
We used huPrP and moPrP 3D structures for the prediction of both linear and conformational B-cell epitopes using the Ellipro Server [Citation51]. We also predicted the B-cell epitopes from the NMR structure of the human major prion protein (90–231) for comparison with the B-cell epitopes of the predicted huPrP and moPrP structure. The prediction from huPrP 3D structure revealed 10 linear epitopes ranging from 4 to 26 amino acid long. The protrusion index value ranged from 0.503 to 0.798 for our predicted linear epitopes where residues with larger scores are associated with greater solvent accessibility [Citation51]. All the linear epitopes with protrusion index (PI) scores are shown in . Four epitopes, L2 (89–111), L7 (24–49), L9 (56–66) and L10 (76–86) are located in the FT region of which L9 (56–66) and L10 (76–86) are within the OR region. The GD region revealed three epitopes, L3 (167–174), L4 (137–153) and L6 (189–204). A small epitope, L8 (1–4) was located in the N-terminal region and two longer epitopes, L1 (222–238) and L5 (245–253) are located in the C-terminal region of the full length huPrP. The linear B-cell epitopes on the protein structure are shown separately in (L1-L10) and all 10 epitopes are shown in as a single representation.
Table 2. Linear B-cell epitopes and their toxicity predicted from the three-dimensional structure of the human major prion protein
Figure 5. Analysis of the predicted linear and conformational B-cell epitopes and their position on the huPrP 3D structure
We also predicted the linear B-cell epitopes from the linear sequence of huPrP using Bepipred 2.0 server [Citation53]. B-cell epitopes prediction from the linear sequence displayed residues 24–46, 94–103, 140–151 and 192–198 which were common with the B-cell epitopes predicted from the 3D structure (Figure S4). The second verification of the predicted epitopes were done using the template 3D structure (PDB id: 2KUN, residues 90–231) where the linear B-cell epitopes were found in positions 90–124, 221–237, 190–200 and 137–153, sharing similar residues with the predicted B-cell epitopes of full-length huPrP structure (Table S1).
Since more than 90% of the B-cell epitopes are conformational [Citation43], we also predicted the conformational B-cell epitopes from huPrP 3D structure. The conformational B-cell epitopes are shown in and (C1-C9) and . The amino acids length of the conformational B-cell epitopes ranged from 4 to 36 residues. The protrusion index value for the conformational B-cell epitopes ranged from 0.55 to 0.883. The huPrP linear epitope L2 (89–111) was common to conformational epitopes C9 and C2 that are composed with residues 55–67, 75–86, 89–99 and 100–112, respectively ( and ). Another huPrP linear epitope L4 (137–153) was common to conformational epitope C4 consisting of residues 137–149, 151–153, 157, 189, 191–204 with a protrusion index score 0.717. The conformational epitope sequences were also shared with linear epitopes L1 (222–238), L3 (167–174), L5 (245–253), L6 (189–204), L7 (24–49), L9 (56–66) and L10 (76–86).
Table 3. Conformational B-cell epitopes from the three-dimensional structure of the human major prion protein
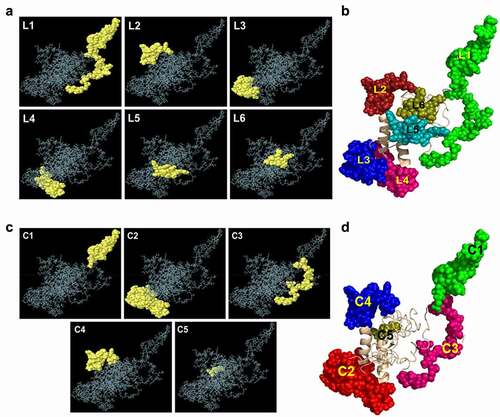
For comparative analysis of the linear B-cell epitopes of huPrP and moPrP, we predicted the linear B-cell epitopes from the moPrP 3D structure shown in and (L1-L6) and . We found six epitopes from moPrP in which two epitopes L1 (77–123) and L5 (45–57) are located in the OR and FT regions, two epitopes L3 (136–156) and L4 (187–207) located in the GD region and epitope L2 (221–237) located in the GD and unstructured regions. The protrusion index value ranged from 0.514 to 0.813 where the highest PI was found for epitope L1 (77–123) and lowest for epitope L6 (23–29). Another important epitope which is equivalent to ICSM18-specific epitope (136–156) is L3 with protrusion index of 0.73.
Table 4. Linear B-cell epitopes and their toxicity predicted from the three-dimensional structure of the mouse major prion protein
Figure 6. Analysis of the predicted linear and conformational B-cell epitopes and their position on the moPrP 3D structure
The linear B-cell epitopes from the moPrP 3D structure were further verified using the linear sequences of moPrP using the server Bepipred 2.0 [Citation52] and found linear sequences in the positions 23–36, 101–110, 140–148 and 192–198 (Figure S5). These epitope positions were overlapped with the B-cell epitopes of the 3D moPrP structure in positions 77–123, 136–156, 187–207 and 23–29 () indicating the acceptability of those identified epitopes. The verification was also done by using the template 3D structure (PDB id: 2KUN, residues 90–231), where the linear B-cell epitopes were found in positions 90–124, 221–237, 190–200 and 137–153 (Table S1) sharing similar residues with the predicted B-cell epitopes of the full-length moPrP structure and indicating acceptability of those B-cell epitopes from 3D moPrP structure.
The conformational epitopes were also predicted from the moPrP 3D structure ( and ). The length of the conformational B-cell epitopes from moPrP 3D structure ranged between 3 and 42 amino acid residues. The protrusion index value for the conformational B-cell epitopes ranged from 0.543 to 0.857. We found 5 conformational epitopes, C1 (77–100), C2 (135–156, 187–207), C3 (66, 76, 101–107, 110–123), C4 (221–238, 245) and epitope C5 (169, 170, 172) from moPrP 3D structure.
Table 5. Conformational B-cell epitopes from the three-dimensional structure of the mouse major prion protein
2.6. In silico toxicity analysis of the predicted linear B-cell epitopes of the human and mouse PrP structure
Anti-PrP antibody-mediated toxicity is subject to great controversy [Citation33–35]. We have performed in silico analysis to predict the toxicity of previously reported anti-PrP antibodies with putative toxic effects. The potentially toxic epitope prediction was done through the ToxinPred server using Support Vector Machine (SVM) and Quantitative Matrix (QM) method [Citation54]. The toxicity prediction results of the linear B-cell epitopes of the huPrP are shown in . We used two different methods for the potentially toxic epitope prediction and considered a toxic outcome of the predicted epitopes when both methods of toxicity prediction (SVM and QM methods) displayed toxicity. L2 (89–111), equivalent to epitopes for ICSM35 and POM3 antibodies, L4 (137–153), equivalent for epitopes specific for ICSM18 and POM1 antibodies, L9 (56–66) and L10 (76–86), equivalent to epitope specific for POM2 antibody and an epitope located in the FT region L7 (24–49) were predicted to be potentially toxic ( and ). The toxicity prediction of the linear B-cell epitopes of moPrP is represented in . The analysis of the 6 linear B-cell epitopes of moPrP showed that L3 (136–156), L5 (45–57) and L6 (23–29) are potentially toxic ( and ), but epitope L1 (77–123) located in the OR region was predicted to be non-toxic.
Figure 7. Potential toxicity analysis of the linear B-cell epitopes of both huPrP and moPrP protein
2.7. Analysis of the physicochemical properties of human and mouse PrP B-cell epitopes
In order to determine the physicochemical parameters, including stability, thermostability, hydrophilicity or hydrophobicity, acidic or basic nature, and finally half-life of the B-cell epitopes, we used the ExPASy ProtParam server [Citation54]. The physicochemical properties of huPrP B-cell epitopes are shown in . L3, L4, L5, L6 and L10 are highly stable whereas epitopes L1, L7 and L9 are highly unstable with values of 71.51, 63.85 and 43.19, respectively. The thermostability analysis showed that L5 is highly thermostable (205.56) whereas L1 (45.88), L4 (45.88) and L6 (36.25) are moderately thermostable. All B- cell epitopes of huPrP were found to be hydrophilic except for L5 and L8. Epitopes L1, L2, L7 and L10 were found to be basic and L3, L4, L5, L6 and L9 were found to be acidic in nature. Finally, the half-life was found to be different for all epitopes except for L1 and L5 ().
Table 6. Physicochemical properties of the predicted linear B-cell epitopes from human major prion protein
The physicochemical properties of the moPrP B-cell epitopes are shown in . L1, L3, L4 and L5 are stable with values of 25.40, 2.28, 12.64, and 28.94, respectively. The aliphatic index analysis of moPrP revealed that epitopes L1, L2, L3 and L4 are thermostable. All B-cell epitopes were found to be hydrophilic in nature. All epitopes, except L3 and L4 were found to be basic in nature and variable half-life was observed for all the epitopes except L1 and L5 ().
Table 7. Physicochemical properties of the predicted linear B-cell epitopes from mouse major prion protein
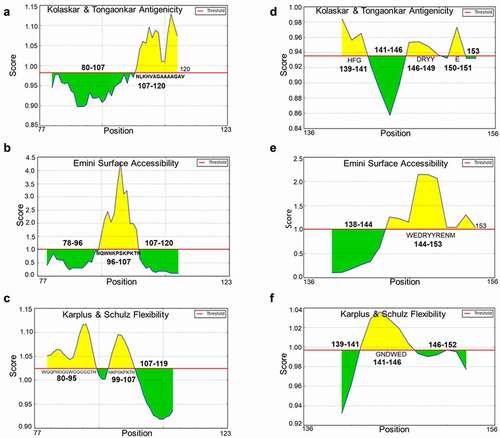
Finally, we predicted the antigenicity, surface accessibility and flexibility of huPrP L2 (89–111), L4 (137–153) and moPrP L1 (77–123), L3 (136–156). Epitopes for ICSM35, POM3, and D13 are located on huPrP L2 (89–111) and moPrP L1 (77–123), while epitopes for ICSM18, D18 and POM1 are located on huPrP L4 (137–153) and moPrP L3 (136–156). Due to the reported contradictory outcomes following investigation of the toxic effects caused by some of these antibodies, we decided to focus our attention on these specific potentially ‘toxic epitopes’ in order to gain more insight and information about the antigenicity, surface accessibility and flexibility of these B-cell epitopes. The analysis revealed that the antigenic site of huPrP L2 is located on 94–96 and 98–105 (); surface accessible region is located on 99–108 (), and flexible region is located on 92–95 and 102–106 (). L4 (137–153) of huPrP, the antigenic site is located on 140–143 and 147–148 (), the surface accessible site located on 145–150 () and the flexible region located 142–147 (). The antigenicity, surface accessibility, and flexibility site for L1 of moPrP was found to be located on 107–120 (); 96–107 (); and 80–95, 99–107 (), respectively. L3 (136–156) of moPrP showed the antigenicity, surface accessibility, and flexibility site on 139–141, 146–149, 150–151 (); 144–153 (); and 141–146 (), respectively.
Figure 8. Properties of the potentially toxic linear B-cell epitope L2 (WGQGGGTHSQWNKPSKPKTNMKH) and L4 (PIIHFGSDYEDRYYREN) from the human major prion protein
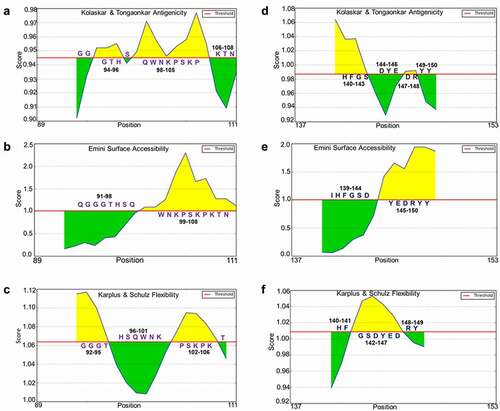
Figure 9. Properties of the non-toxic linear B cell epitope L1 (GGSWGQPHGGGWGQGGGTHNQWNKPSKPKTNLKHVAGAAAAGAVVGG) and potentially toxic linear B-cell epitope L3 (PMIHFGNDWEDRYYRENMYRY) from the moPrP
3. Discussion
Immunoinformatics is now commonly used to predict B- and T-cell epitopes from linear sequences or the protein structure of various viruses or bacteria [Citation55–60] as well as for cancer immunotherapy [Citation61]. As a result, we used a combination of in silico and immunoinformatics approaches to compare huPrP and moPrP. Prion diseases are thought to be caused by the conversion of the cellular prion protein (PrPC) to an abnormal isoform PrPSc [Citation1,Citation62]. PrPC is required for de novo generation and spreading of prions in the central nervous system (CNS) [Citation23,Citation62,Citation63] as well as for prion-related neurotoxicity [Citation23,Citation64]. Therefore, potential therapeutic anti-PrP antibodies have been developed based on the human PrPC (e.g. ICSM18, ICSM35) [Citation19,Citation27,Citation65] or mouse PrPC (e.g. POM1, POM2, POM3) [Citation28]. However, few of these anti-PrP antibodies were controversially shown to be toxic in vitro and in vivo [Citation33–36]. Despite the high homology between huPrP and moPrP sequences similarity (87.35%), we identified 10 huPrP and 6 moPrP linear B-cell epitopes from the 3D structure.
The variance in the amino acid sequences of these regions of huPrP and moPrP highlighted the possibility of structural variations between huPrP and moPrP. Structural differences can explain the contradictory toxic/non-toxic outcome of several anti-PrP antibodies since these were generated using PrP sequences from different hosts (human/mouse/hamster), with the expectation of similar biological behaviour. As a result of our immunoinformatic work, we demonstrated a difference in the number of huPrP and moPrP linear and conformational B-cell epitopes. These variations are primarily due to host specific variation in the FT region (ICSM35, POM3, D13) and the GD region (ICSM18, D18, POM1) [Citation27]. ICSM18 and ICSM35 were produced using human truncated αPrP (91–231) and βPrP (91–231), respectively, while POM1 and POM3 were produced using mouse full-length αPrP(23–231) [Citation28]. D13 and D18, on the other hand, were generated in response to dispersed Syrian hamster PrP (SHaPrP 27–30) [Citation29,Citation30]. The host specific structural variations were confirmed in our study as we found that our predicted full-length 3D structure of huPrP is composed of α-helices and random coils, while the moPrP structure is composed of α-helices, β-sheets, and random coils. However, previous reports highlighted that PrPC comprises at least two beta sheet segments [Citation66], in contrast with our in silico predictive analysis that did not reveal the beta sheet structures. Of note, our analysis of the predicted 3D structure was conducted on huPrP1-253 and moPrP1-254, whereas the experimentally reported structures (NMR or x-ray crystallography) was performed primarily on single or double domain structures, which may explain the differences between the predicted and experimentally reported huPrP and moPrP structures. The pro-motif analysis of both huPrP and moPrP 3D structure also confirmed the structural variation and confirmed the role of host specificity in structural variation and epitope prediction. Previous studies have shown that the C-terminal domains of huPrP (121–231) and moPrP (121–231) share a 94% sequence similarity [Citation67]. The NMR structure of the huPrP targeting the regions 90–230 and 121–230 [Citation47,Citation68] as well as the x-ray crystallography structure have been established previously [Citation48,Citation69]. Additionally, the NMR structure of moPrP C-terminal domain (121–231) [Citation70], as well as recombinant full-length moPrP (23–231) have been documented [Citation49].
Since the atoms of biomolecules are always in constant motion, atomic-level structure of the biomolecules help to understand the function of biomolecules which we can perform through computational molecular dynamics simulation (MDS) [Citation71,Citation72]. MDS can help to see how every atom of the protein move over time as well as protein folding, conformational change and atomic position change [Citation71,Citation72]. Therefore, MDS is now widely used in combination with the structural biology to study the mutational effect, ligand effect, protonation, phosphorylation, and stability of the protein [Citation71,Citation73]. MDS has been used in the study of β-amyloid of Alzheimer’s disease [Citation74–76], α-synuclein of Parkinson’s disease [Citation77], protein misfolding and mutational study of prion disease [Citation78–81]. To our knowledge, a minimum of 2 ns [Citation81,Citation82] and maximum of 100 ns molecular dynamics simulation has been done for the huPrP [Citation83]. Therefore, we performed a 300 ns MDS of the full-length huPrP, moPrP as well as for the template (PDB id: 2KUN) to see the structural stability through RMSD, overall dimension of the structure through Rg, and flexibility difference among the residues through RMSF. In this study, the Rg analysis in MDS revealed a strong structural difference between the huPrP, moPrP, and template structures. However, during the 300 ns MDS of huPrP, the RMSF was found in the positions 25–53, 98–116 and 140–152, indicating that these regions are highly flexible and that their conformation may be altered. It is well established that regions 98–116 and 140–152 reflect the ICSM35 and ICSM18 anti-PrP antibody specific epitopes, respectively, and the high flexibility of these regions demonstrated the importance of conformational epitope selection over linear epitope selection for potential anti-PrP antibody design. More significantly, we observed the impact of host specificity on conformational epitope prediction, identifying 9 conformational epitopes in huPrP and 5 in moPrP, demonstrating the important role of host specificity in epitope prediction as well as in antibody specificity. The physicochemical properties of huPrP epitopes L2 (89–111) & L4 (137–153) and moPrP epitopes L1 (77–123) & L3 (136–156) identified an antigenic site, a surface accessible area, and a flexible region in the most fluctuated region (RMSF) of huPrP and moPrP, as predicted by MDS. Significant structural changes in huPrP, moPrP, and the template structure were also observed following the 300 ns MDS.
Previous studies have reported that some antibodies that were otherwise shown to be innocuous at lower doses, can only induce toxicity at high doses [Citation33,Citation36]. For instance, POM3 antibody was found to be innocuous at 67 nM, but neurotoxic at 200 nM [Citation36]. However, our in silico immunoinformatics study predicted POM3 to be potentially toxic. Of importance, the prediction algorithm relies mainly on the intrinsic structural properties of the protein studied regardless of dosage and length of antibody exposure. Further, the algorithm has up to 97% accuracy [Citation53], indicating the robustness of the prediction approach.
In the current study, we demonstrated the impact of host specificity on ICSM35, POM3, and D13 antibody specific epitopes. We identified a linear B-cell epitope in the FT area of both huPrP and moPrP, demonstrating the host specificity effect at positions 89–111 for huPrP and 77–123 for moPrP. The anti-PrP antibodies, ICSM35, D13, and POM3 have been shown to recognize epitopes 96–109, 95–105 and 95–100, respectively [Citation27–29]. Ellipro server also detected a host-specific effect for antibodies produced based on the GD region, such as ICSM18, POM1 and D18. Herein, ICSM18 antibody, for example, is directed against the epitope 146–159 and was also developed using the huPrP sequence [Citation27]. Additionally, although POM1 and D18 share similar linear epitope, however POM1 binds a conformational epitope while D18 recognizes a linear epitope. Additionally, we found a discrepancy in the epitope location for huPrP epitope L4 (137–153) and moPrP epitope L3 (136–156) in this analysis. Finally, the linear B-cell epitope prediction using the Ellipro server demonstrated that the host specificity of the cellular prion protein has a significant effect on both epitope prediction and anti-PrP antibody specificity.
The effect of host specificity was also observed in the prediction of toxic epitopes from huPrP and moPrP with our immunoinformatic analysis predicting that 5 out of 10 huPrP and 3 out of 6 moPrP B-cell epitopes were toxic. More specifically, our immunoinformatic analysis revealed that the identified huPrP epitope (89–111) is potentially toxic, while the identified moPrP epitope (77–123) is not. Among the reported potentially toxic epitopes from huPrP, epitope L2 (89–111) was mapped to the neurotoxic antibodies D13 (95–105) [Citation33,Citation34,Citation36] and POM3 (95–100) [Citation36], while another FT area specific antibody ICSM35 (96–109), also shown to be potentially neurotoxic in our analysis, was found to be non-toxic by Klohn and colleagues [Citation35]. A previous study showed that the human PrP peptide 106–126 in the FT region was found to be neurotoxic in in vitro analysis [Citation84]. Further, deletion of PrP central domain region 94–134 is associated with rapid and progressive peripheral and central myelin degeneration [Citation85]. Sonati et al. highlighted the significance of this FT area, stating that it is responsible for the anti-prion antibody toxicity [Citation36]. Hermann et al. demonstrated that antibodies against the FT region of the cellular prion protein inhibit the GD region’s toxicity and also identified the FT region as a critical molecular effector of prion-mediated toxicity [Citation37]. Another FT region antibody, D13 is a highly controversial antibody due to its contradictory role in neurotoxicity. Solforosi et al. established in the initial study that D13 causes widespread neuronal loss in the hippocampal area [Citation34]. However, another study discovered that D13 does not exhibit widespread apoptosis in the hippocampus area [Citation35]. Additionally, it was revealed in two separate studies that D13 is not only neurotoxic at higher concentrations [Citation36], but also induces rapid, dose-dependent, on-target neurotoxicity (hippocampus) [Citation33].
It is believed that cellular prion protein PrPC is widely expressed in the immune system and is naturally immune tolerated and no antibodies are released against this protein [Citation86–88]. In addition, PrPC has important effects on the B-cell repertoire and antibody production [Citation86]. A recent report by Senatore and colleagues described the characterization of novel ant-PrP antibodies identified with a synthetic human Fab phage display library [Citation89]. The authors showed that antibodies directed against epitopes located within the 51–91 FT region of PrPC can prevent prion-induced neurotoxicity and do not display intrinsic neurotoxicity [Citation89]. This apparent discrepancy with our predictive analysis could be explained by the differences of the sequences recognized by these different antibodies. Further, other factors such as the genetic background of the mice used that express Prnp transcripts in the brain six- to seven-fold compared to wild-type.
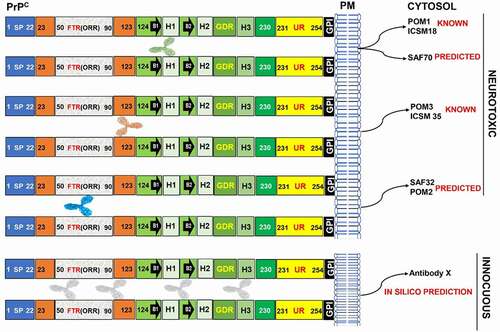
On the other hand, the OR region-targeting antibody POM2 was shown to be neuroprotective [Citation37]. Additionally, two independent studies established that POM2 antibody is non-toxic [Citation33,Citation36]. The effect of host specificity on toxicity was also observed in the GD region of huPrP and moPrP, where we showed that the epitopes L4 (137–153) of huPrP and L3 (136–156) of moPrP are potentially toxic, demonstrating the host specific effects on epitope prediction as well as the toxicity of GD region specific antibodies such as ICSM18 antibody. POM1 has already been identified as one of the most neurotoxic antibody, via ATF4, p-eIF2, and p-PERK pathways [Citation23,Citation33,Citation36,Citation37]. The linear part of POM1 antibody specific epitope (138–147) was determined to be non-toxic in this study. Additionally, when a lower concentration of D13 was administered, POM1 toxicity was abolished in cerebellar organotypic slice culture (COCS), indicating that D13 acts as a partial competitive agonist [Citation33]. Thus, the area of potential discrepancy may be due to additional amino acid residues (K204/R208/Q212) recognized by POM1 antibody, which could have a significant effect on causing neurotoxicity. This in silico study clearly reveals the role of host specificity of PrPC in epitope-specific anti-PrP antibody toxicity. Additionally, this study can aid in elucidating some of the contradictory toxic outcomes of various anti-PrP antibodies in neurotoxicity but more importantly the in silico process will help to identify ‘safe’ non-toxic epitopes to be targeted by therapeutic anti-PrP antibodies ().
Figure 10. Model of anti-PrP antibody-mediated toxicity prediction
4. Materials and methods
4.1. Human and mouse PrP sequence retrieval from the UniProt database
We used full length huPrP and moPrP sequences for immunoinformatics and structural analysis. We initially retrieved the Fasta formatted huPrP and moPrP sequences from the curated protein sequence database Swiss-Prot [Citation90] under the UniProt Knowledgebase (UniProtKB) (https://www.UniProt.org/) database. The accession number for huPrP and moPrP is P04156 (Homo sapiens) and P04925 (Mus musculus) respectively.
4.2. Prediction of physicochemical properties of human and mouse PrP
Different physicochemical properties were predicted from full-length huPrP and moPrP using the expert protein analysis system ExPASy ProtParam server (www.web.expasy.org/protparam) [Citation54]. We considered several parameters, including molecular weight (MW), theoretical PI (pI), aliphatic index (AI), half-life, instability index (II), and grand average hydropathy (GRAVY) value. In addition, we also identified the antigenicity of both huPrP and moPrP using AntigenPro server (http://scratch.proteomics.ics.uci.edu/) [Citation91]. Finally, we projected the physicochemical properties for the predicted linear B-cell epitopes identified from the predicted 3D structure of the full-length huPrP and moPrP.
4.3. Multiple sequence alignment of the human and mouse PrP
Multiple sequence alignment has been achieved using the ClustalW server (https://www.genome.jp/tools-bin/clustalw) [Citation92] using full length huPrP and moPrP sequences to identify the matching amino acid residues or changes in the amino acid composition throughout the protein.
4.4. Human and mouse PrP structure development using the I-TASSER server
For the comparative structural analysis and epitope prediction we needed to develop a three- dimensional (3D) structure from the protein sequence. Therefore, we used I-TASSER server to predict the 3D structure of huPrP and moPrP protein. I-TASSER (https://zhanglab.ccmb.med.umich.edu/I-TASSER/) is a hierarchical template-based protein 3D structure and function prediction server which can predict the structure through multiple threading alignments, iterative structure assembly simulations, and comparative functional modelling approaches from the query protein sequence [Citation44]. The protein model predicted by I-TASSER server can be verified by the confidence score (C-score), template modelling score (TM-score), and root mean square deviation (RMSD) score. For the visualization and structural analysis of the predicted structure, we used the PyMOL v2.3 softwares (The PyMOL Molecular Graphics System, Version 2.3 Schrödinger, LLC.).
4.5. Evaluation of the human and mouse PrP structure and submission to the PMDB database
For evaluation of the I-TASSER predicted native full-length 3D structure, this was primarily submitted to the PROCHECK for Ramachandran plot analysis that shows mainly most favoured region, generously allowed region, additional allowed regions, and the disallowed region of the predicted protein structure. Ramachandran plot analysis was done using the PROCHECK which is conducted by the PDBsum server (http://www.ebi.ac.uk/pdbsum) [Citation93]. In protein structural biology, the findings of errors in experimental or predicted protein is an important issue, so our predicted protein 3D model was assessed by the ProSA server (https://prosa.services.came.sbg.ac.at/prosa.php) for the global and local quality analysis. ProSA web server can recognize the errors of the theoretical protein model and calculates the overall quality of the protein 3D model [Citation94]. Finally, we submitted our predicted full-length huPrP and moPrP 3D structures to the protein model database (PMDB) (http://srv00.recas.ba.infn.it/PMDB/main.php) [Citation95] for the unique identification number (PM0082388 for huPrP and PM0083247 for moPrP).
4.6. Protein stability check by molecular dynamics simulation
Molecular dynamics (MD) simulation is important to determine the stability of the predicted comparative protein models. The MD simulation for huPrP and moPrP 3D structure which were predicted by I-TASSER server was performed using AMBER14N force field [Citation96] in YASARA Dynamics software v17.8 [Citation45,Citation46]. However, the comparative protein structure was cleaned, and hydrogen was added to all atoms for optimization. The entire simulation was done in a TIP3 water (density: 0.997 g/ml) solvated cubic simulation cell using default macro setting (md_run.mcr). In addition, a cut-off radius of 8.0 Å was used at predefined physiological conditions (298 K, pH 7.4, 0.9% NaCl) for short-range Van der Waals and Coulomb interactions. In our study, time step of 2.50 fs was used, and simulation snapshots were captured at every 250 picoseconds. The simulation was run for a period of 300 nanoseconds (ns) until the protein structure reached a stable state. Finally, the trajectories generated from the simulation were analysed using built-in macros (i.e. md_analyze.mcr and md_analyzeres.mcr) for the analysis of stability of the protein structure in terms of the root mean square fluctuation (RMSF) and root mean square deviation (RMSD) for side chain and backbone, respectively. The radius of gyration was also calculated and analysed for the determination of protein compactness during the whole simulation process.
4.7. Comparative structural analysis
The pro-motif analysis of the protein structure can help to identify the structural variation between huPrP and moPrP protein. To identify the structural variation between huPrP and moPrP, the structures were submitted to the PDBsum server (http://www.ebi.ac.uk/pdbsum) [Citation93]. This server is able to show the different structural pro-motifs such as beta-turn, gamma turn, helix-helix interaction, and other structural properties which can be used for the identification of variation in the structures.
4.8. Prediction of human and mouse PrP linear and conformational B-Cell epitopes
The linear and conformational B-cell epitopes from the protein 3D structure were predicted using the Ellipro server (http//tools.iedb.org/ellipro/) [Citation51]. Ellipro is a web-server which uses the geometrical properties of the protein structure in combination with MODELLER program and residue clustering algorithm for the prediction of the B-cell epitopes or antibody epitopes in the protein region protruding from the protein’s globular surface [Citation51]. We used the default parameters (minimum score 0.5 and maximum distance 0.6 Å) of the Ellipro server for the prediction of both linear and conformational B-cell epitopes. We also used the BepiPred-2.0 (http://www.cbs.dtu.dk/services/BepiPred/) server for the prediction and validation of the linear B-cell epitopes using primary protein sequence of huPrP and moPrP sequence [Citation52]. In addition, different B-cell epitope properties such as Emini surface accessibility [Citation97], Karplus & Schulz flexibility [Citation98], and Kolaskar & Tongaonkar antigenicity [Citation99] prediction were performed using the immune epitope database (IEDB) (https://www.iedb.org/) [Citation100].
4.9. In silico toxicity prediction of the linear B-Cell epitopes
We used ToxinPred server (http://crdd.osdd.net/raghava/toxinpred/) for the prediction of potentially toxic/non-toxic nature of the linear B-cell epitopes [Citation53]. We used both the support vector machine (SVM) and quantitative matrix (QM) method in ToxinPred server for non-toxic epitope selection. The ToxinPred server has been developed based on the QM and machine learning technique using different properties of the peptides for the prediction of toxicity or non-toxicity of the peptides with 96.70% and 95.78% accuracy in SVM and QM methods, respectively. This server can also be used to identify the most toxic regions in the protein sequence [Citation53].
Availability of data and materials
Detailed results of our analyses are included with this article and its additional files.
Ethics approval and consent to participate
Not applicable
Supplemental Material
Download MS Word (1.7 MB)Acknowledgements
The Authors would like to thank the Australian Government for providing an Australian Government Research Training Program Stipend Scholarship (RTP) for PhD support.
Disclosure statement
The author(s) declare no competing interests.
Supplementary material
Supplemental data for this article can be accessed here.
Additional information
Funding
Related Research Data
References
- Prusiner SB. Novel proteinaceous infectious particles cause scrapie. Science. 1982;216(4542):136–144.
- Baskakov IV, Breydo L, Converting the prion protein: what makes the protein infectious. Biochim Biophys Acta - Mol Basis Dis. 2007; 1772(6):692–703.
- Liao YC, Lebo RV, Clawson GA, et al., Human prion protein cDNA: molecular cloning, chromosomal mapping, and biological implications. Science. 1986; 233(4761):364–367.
- Sparkes RS, Simon M, Cohn VH, et al., Assignment of the human and mouse prion protein genes to homologous chromosomes. Proc Natl Acad Sci. 1986; 83(19):7358–7362.
- Walmsley AR, Zeng F, Hooper NM, Membrane topology influences N-glycosylation of the prion protein. EMBO J. 2001; 20(4):703–712.
- Puig B, Altmeppen HC, Linsenmeier L, et al. GPI-anchor signal sequence influences PrPC sorting, shedding and signalling, and impacts on different pathomechanistic aspects of prion disease in mice. PLoS Pathog. 2019;15(1):e1007520.
- Turnbaugh JA, Unterberger U, Saá P, et al. The N-terminal, polybasic region of PrP(C) dictates the efficiency of prion propagation by binding to PrP(Sc). J Neurosci. 2012;32(26):8817–8830.
- Shyng S-L, Moulder KL, Lesko A, et al., The N-terminal domain of a glycolipid-anchored prion protein is essential for its endocytosis via clathrin-coated pits. J Biol Chem. 1995; 270(24):14793–14800.
- Sunyach C, Jen A, Deng J, et al. The mechanism of internalization of glycosylphosphatidylinositol-anchored prion protein. EMBO J. 2003;22(14):3591–3601.
- Davies P, Brown DR. The chemistry of copper binding to PrP: is there sufficient evidence to elucidate a role for copper in protein function? Biochem J. 2008;410:237–44.
- Sakudo A, Lee D, Nishimura T, et al. Octapeptide repeat region and N-terminal half of hydrophobic region of prion protein (PrP) mediate PrP-dependent activation of superoxide dismutase. Biochem Biophys Res Commun. 2005;326(3):600–606. .
- Kupfer L, Hinrichs W, Groschup MH, Prion protein misfolding. Curr Mol Med. 2009; 9(7):826–835.
- Watts JC, Bourkas MEC, Arshad H. The function of the cellular prion protein in health and disease. Acta Neuropathol. 2018;135(2):159–178.
- Legname G. Elucidating the function of the prion protein. PLOS Pathog. 2017;13(8):1–6.
- Heppner FL, Musahl C, Arrighi I, et al., Prevention of scrapie pathogenesis by transgenic expression of anti-prion protein antibodies. Science. 2001; 294(5540):178–182.
- Schwarz A, Krätke O, Burwinkel M, et al., Immunisation with a synthetic prion protein-derived peptide prolongs survival times of mice orally exposed to the scrapie agent. Neurosci Lett. 2003; 350(3):187–189.
- Frontzek K, Aguzzi A. Recent developments in antibody therapeutics against prion disease. Emerg Top Life Sci. 2020;4(2):169–173.
- Sigurdsson EM, Brown DR, Daniels M, et al., Immunization delays the onset of prion disease in mice. Am J Pathol. 2002; 161(1):13–17.
- White AR, Enever P, Tayebi M, et al. Monoclonal antibodies inhibit prion replication and delay the development of prion disease. Nature. 2003;422(6927):80–83.
- Aguzzi A, Nuvolone M, Zhu C. The immunobiology of prion diseases. Nat Rev Immunol. 2013;13(12):888.
- Ma Y, Ma J. Immunotherapy against PRION DIsease. Pathog (Basel, Switzerland). 2020;9(3):216.
- Burchell JT, Panegyres PK. Prion diseases: immunotargets and therapy. ImmunoTargets Ther. 2016;5:57–68.
- Aguzzi A, Lakkaraju AKK, Frontzek K. Toward therapy of human prion diseases. Annu Rev Pharmacol Toxicol. 2018;58(1):331–351.
- Roettger Y, Du Y, Bacher M, et al. Immunotherapy in prion disease. Nat Rev Neurol. 2013;9(2):98–105.
- Trevitt CR, Collinge J. A systematic review of prion therapeutics in experimental models. Brain. 2006;129(9):2241–2265.
- Enari M, Flechsig E, Weissmann C. Scrapie prion protein accumulation by scrapie-infected neuroblastoma cells abrogated by exposure to a prion protein antibody. Proc Natl Acad Sci U S A. 2001;98(16):9295–9299.
- Beringue V, Mallinson G, Kaisar M, et al. Regional heterogeneity of cellular prion protein isoforms in the mouse brain. Brain. 2003;126(9):2065–2073.
- Polymenidou M, Moos R, Scott M, et al. The POM monoclonals: a comprehensive set of antibodies to non-overlapping prion protein epitopes. PLoS One. 2008;3(12):e3872. .
- Williamson RA, Peretz D, Pinilla C, et al. Mapping the prion protein using recombinant antibodies. J Virol. 1998;72(11):9413–9418.
- Peretz D, Williamson RA, Kaneko K, et al. Antibodies inhibit prion propagation and clear cell cultures of prion infectivity. Nature. 2001;412(6848):739–743.
- Féraudet C, Morel N, Simon S, et al. Screening of 145 anti-PrP monoclonal antibodies for their capacity to inhibit PrPSc replication in infected cells. J Biol Chem. 2005;280(12):11247–11258.
- Demart S, Fournier J-G, Creminon C, et al., New insight into abnormal prion protein using monoclonal antibodies. Biochem Biophys Res Commun. 1999; 265(3):652–657.
- Reimann RR, Sonati T, Hornemann S, et al., differential toxicity of antibodies to the prion protein. PLoS Pathog. 2016; 12(1):e1005401.
- Solforosi L, Criado JR, McGavern DB, et al. Cross-linking cellular prion protein triggers neuronal apoptosis in vivo. Science. 2004;303(5663):1514–1516.
- P-c K, Farmer M, Linehan JM, et al. PrP antibodies do not trigger mouse hippocampal neuron apoptosis. Science. 2012;335(6064):52.
- Sonati T, Rr R, Falsig J, et al. The toxicity of antiprion antibodies is mediated by the flexible tail of the prion protein. Nature. 2013;501(7465):102.
- Herrmann US, Sonati T, Falsig J, et al. Prion infections and anti-PrP antibodies trigger converging neurotoxic pathways. PLoS Pathog. 2015;11(2):e1004662. .
- Frontzek K, Pfammatter M, Sorce S, et al., Neurotoxic antibodies against the prion protein do not trigger prion replication. PLoS One. 2016; 11(9):e0163601.
- Lefebvre-Roque M, Kremmer E, Gilch S, et al. Toxic effects of intracerebral PrP antibody administration during the course of BSE infection in mice. Prion. 2007;1(3):198–206. .
- Klyubin I, Nicoll AJ, Khalili-Shirazi A, et al. Peripheral administration of a humanized anti-PrP antibody blocks Alzheimer’s disease Aβ synaptotoxicity. J Neurosci. 2014; 34(18)::6140–6145.
- Khalili-Shirazi A, Quaratino S, Londei M, et al. Protein conformation significantly influences immune responses to prion protein. J Immunol. 2005;174(6):3256–3263.
- Brown DR, Iordanova IK, Wong BS, et al. Functional and structural differences between the prion protein from two alleles prnp(a) and prnp(b) of mouse. Eur J Biochem. 2000;267(8):2452–2459. .
- Sanchez-Trincado JL, Gomez-Perosanz M, Reche PA. Fundamentals and methods for t- and b-cell epitope prediction. J Immunol Res. 2017;2017:2680160.
- Roy A, Kucukural A, Zhang Y, I-TASSER: a unified platform for automated protein structure and function prediction. Nat Protoc. 2010; 5(4):725–738.
- Krieger E, Darden T, Nabuurs SB, et al. Making optimal use of empirical energy functions: force-field parameterization in crystal space. Proteins. 2004;57(4):678–683.
- Krieger E, Vriend G. New ways to boost molecular dynamics simulations. J Comput Chem. 2015;36(13):996–1007.
- Zahn R, Liu A, Lührs T, et al., NMR solution structure of the human prion protein. Proc Natl Acad Sci U S A. 2000; 97(1):145–150.
- Knaus KJ, Morillas M, Swietnicki W, et al. Crystal structure of the human prion protein reveals a mechanism for oligomerization. Nat Struct Biol. 2001;8(9):770–774.
- Riek R, Hornemann S, Wider G, et al. NMR characterization of the full-length recombinant murine prion protein, mPrP(23-231). FEBS Lett. 1997;413(2):282–288.
- Kumar CV, Swetha RG, Anbarasu A, et al. Computational analysis reveals the association of threonine 118 methionine mutation in PMP22 resulting in CMT-1A. Adv Bioinformatics. 2014;2014:502618.
- Ponomarenko J, Bui -H-H, Li W, et al. ElliPro: a new structure-based tool for the prediction of antibody epitopes. BMC Bioinformatics. 2008;9(1):514.
- Jespersen MC, Peters B, Nielsen M, et al. BepiPred-2.0: improving sequence-based B-cell epitope prediction using conformational epitopes. Nucleic Acids Res. 2017;45(W1):W24–W29.
- Gupta S, Kapoor P, Chaudhary K, et al., Open source drug discovery consortium, raghava gps. in silico approach for predicting toxicity of peptides and proteins. PLoS One. 2013; 8(9):e73957.
- Garnier J, Osguthorpe DJ, Robson B, Prediction of the secondary structure of proteins from their amino-acid sequence. J Mol Biol. 1978; 120(1):97–120.
- Adhikari UK, Tayebi M, Mizanur RM. Immunoinformatics approach for epitope-based peptide vaccine design and active site prediction against polyprotein of emerging oropouche virus. J Immunol Res. 2018;2018:1–22.
- Adhikari UK, Rahman MM. Overlapping {CD8} + and {CD4} + T-cell epitopes identification for the progression of epitope-based peptide vaccine from nucleocapsid and glycoprotein of emerging Rift Valley fever virus using immunoinformatics approach. Infect Genet Evol 2017; 56:75–91.
- Nain Z, Karim MM, Sen MK, et al. Structural basis and designing of peptide vaccine using PE-PGRS family protein of mycobacterium ulcerans—An integrated vaccinomics approach. Mol Immunol. 2020; 120:146–163.
- Abdulla F, Nain Z, Hossain MM, et al. A comprehensive screening of the whole proteome of hantavirus and designing a multi-epitope subunit vaccine for cross-protection against hantavirus: structural vaccinology and immunoinformatics study. Microb Pathog. 2021; 150:104705.
- Khan MSA, Nain Z, Bin SS, et al. Computational formulation and immune dynamics of a multi-peptide vaccine candidate against Crimean-Congo hemorrhagic fever virus. Mol Cell Probes. 2021; 55:101693.
- Bin SS, Nain Z, Khan MSA, et al. Exploring Lassa Virus Proteome to Design a Multi-epitope Vaccine Through Immunoinformatics and Immune Simulation Analyses. Int J Pept Res Ther. 2020;26(4):2089–2107.
- DeLuca DS, Blasczyk R, The immunoinformatics of cancer immunotherapy. Tissue Antigens. 2007; 70(4):265–271.
- Büeler H, Aguzzi A, Sailer A, et al. Mice devoid of PrP are resistant to scrapie. Cell. 1993;73(7):1339–1347.
- Brandner S, Raeber A, Sailer A, et al. Normal host prion protein (PrPC) is required for scrapie spread within the central nervous system. Proc Natl Acad Sci U S A. 1996;93(23):13148–13151.
- Brandner S, Isenmann S, Raeber A, et al. Normal host prion protein necessary for scrapie-induced neurotoxicity. Nature. 1996;379(6563):339–343.
- David MA, Jones DR, Tayebi M, Potential candidate camelid antibodies for the treatment of protein-misfolding diseases. J Neuroimmunol. 2014; 272(1–2):76–85.
- Aguzzi A, Baumann F, Bremer J. The prion’s elusive reason for being. Annu Rev Neurosci. 2008;31(1):439–477.
- Liemann S, Glockshuber R. Influence of amino acid substitutions related to inherited human prion diseases on the thermodynamic stability of the cellular prion protein †. Biochemistry. 1999;38(11):3258–3267.
- Calzolai L, Zahn R. Influence of pH on NMR structure and stability of the human prion protein globular domain. J Biol Chem. 2003;278(37):35592–35596.
- Antonyuk SV, Trevitt CR, Strange RW, et al. Crystal structure of human prion protein bound to a therapeutic antibody. Proc Natl Acad Sci U S A. 2009;106(8):2554–2558. .
- Riek R, Hornemann S, Wider G, et al. NMR structure of the mouse prion protein domain PrP(121–231). Nature. 1996;382(6587):180–182.
- Hollingsworth SA, Dror RO, Molecular dynamics simulation for all. Neuron. 2018; 99(6):1129–1143.
- Karplus M, McCammon JA. Molecular dynamics simulations of biomolecules. Nat Struct Biol. 2002;9(9):646–652.
- Spagnolli G, Rigoli M, Orioli S, et al. Full atomistic model of prion structure and conversion. PLOS Pathog. 2019;15(7):1–18.
- Buchete N-V, Tycko R, Hummer G. Molecular dynamics simulations of Alzheimer’s beta-amyloid protofilaments. J Mol Biol. 2005;353(4):804–821.
- Lemkul JA, Bevan DR. The role of molecular simulations in the development of inhibitors of amyloid β-peptide aggregation for the treatment of Alzheimer’s disease. ACS Chem Neurosci. 2012;3(11):845–856.
- Hassan M, Shahzadi S, Seo SY, et al. Molecular docking and dynamic simulation of AZD3293 and Solanezumab effects against BACE1 to treat alzheimer’s disease. Front Comput Neurosci. 2018; 12:34.
- Mohankumar T, Chandramohan V, Lalithamba HS, et al. Design and molecular dynamic investigations of 7,8-dihydroxyflavone derivatives as potential neuroprotective agents against alpha-synuclein. Sci Rep. 2020;10(1):599.
- Barducci A, Chelli R, Procacci P, et al., Misfolding Pathways of the prion protein probed by molecular dynamics simulations. Biophys J. 2005; 88(2):1334–1343.
- Cheng CJ, Daggett V. Molecular dynamics simulations capture the misfolding of the bovine prion protein at acidic pH. Biomolecules. 2014;4(1):181–201.
- Lee J, Chang I, Yu W. Atomic insights into the effects of pathological mutants through the disruption of hydrophobic core in the prion protein. Sci Rep. 2019;9(1):19144.
- DeMarco ML, Daggett V. Molecular Mechanism for low ph triggered misfolding of the human prion protein†. Biochemistry. 2007;46(11):3045–3054.
- Zuegg J, Gready JE. Molecular dynamics simulation of human prion protein including both N-linked oligosaccharides and the GPI anchor. Glycobiology. 2000;10(10):959–974.
- Zheng Z, Zhang M, Wang Y, et al. Structural basis for the complete resistance of the human prion protein mutant G127V to prion disease. Sci Rep. 2018;8(1):13211.
- Jobling MF, Stewart LR, White AR, et al. The hydrophobic core sequence modulates the neurotoxic and secondary structure properties of the prion peptide 106-126. J Neurochem. 1999;73(4):1557-65.
- Baumann F, Tolnay M, Brabeck C, et al. Lethal recessive myelin toxicity of prion protein lacking its central domain. EMBO J. 2007;26(2):538–547.
- Zhang B, Shen P, Yin X, et al., Expression and functions of cellular prion proteins in immunocytes. Scand J Immunol. 2020; 91(3):e12854.
- Isaacs JD, Jackson GS, Altmann DM. The role of the cellular prion protein in the immune system. Clin Exp Immunol. 2006;146(1):1–8.
- Bakkebø MK, Mouillet-Richard S, Espenes A, et al. The cellular prion protein: a player in immunological quiescence. Front Immunol. 2015;6:450.
- Senatore A, Frontzek K, Emmenegger M, et al. Protective anti-prion antibodies in human immunoglobulin repertoires. EMBO Mol Med. 2020; 12(9):e12739.
- Bairoch A, The AR, SWISS-PROT protein sequence database and its supplement TrEMBL in 2000. Nucleic Acids Res. 2000; 28(1):45–48.
- Cheng J, Randall AZ, Sweredoski MJ, et al. SCRATCH: a protein structure and structural feature prediction server. Nucleic Acids Res. 2005;33:W72–6.
- Chenna R, Sugawara H, Koike T, et al., Multiple sequence alignment with the Clustal series of programs. Nucleic Acids Res. 2003; 31(13):3497–3500.
- Laskowski RA, Jabłońska J, Pravda L, et al., PDBsum: structural summaries of PDB entries. Protein Sci. 2018; 27:129–134.
- Wiederstein M, Sippl MJ. ProSA-web: interactive web service for the recognition of errors in three-dimensional structures of proteins. Nucleic Acids Res. 2007;35:W407–10.
- Castrignanò T, De Meo PD, Cozzetto D, et al. The PMDB protein model database. Nucleic Acids Res. 2006; 34:D306.
- Dickson CJ, Madej BD, Skjevik AA, et al. Lipid14: the Amber Lipid Force Field. J Chem Theory Comput. 2014;10(2):865–879.
- Emini EA, Hughes JV, Perlow DS, et al. Induction of hepatitis A virus-neutralizing antibody by a virus-specific synthetic peptide. J Virol. 1985;55(3):836–839.
- Karplus PA, Schulz GE. Prediction of chain flexibility in proteins. Naturwissenschaften. 1985;72(4):212–213.
- Kolaskar AS, Tongaonkar PC. A semi-empirical method for prediction of antigenic determinants on protein antigens. FEBS Lett. 1990;276(1–2):172–174.
- Vita R, Overton JA, Greenbaum JA, et al. The immune epitope database (IEDB) 3.0. Nucleic Acids Res] 2015; 43:D405–12.
- Adhikari UK, Sakiz E, Zheng Y-F, et al. Cross-linking cellular prion protein induces neuronal type 2-like hypersensitivity. Front Immunol. 2021;12:639008.