
 ?Mathematical formulae have been encoded as MathML and are displayed in this HTML version using MathJax in order to improve their display. Uncheck the box to turn MathJax off. This feature requires Javascript. Click on a formula to zoom.
ABSTRACT
Hypokalemia is a common electrolyte disorder in hospitalized patients and those with chronic diseases and is associated with renal tubular injury. Our recent expression proteomics study revealed changes in levels of several proteins in renal tubular cells during K+ deficiency. However, functional significance and mechanisms underlying such changes remained unclear. The present study, thus, aimed to investigate functional changes of renal tubular cells induced by K+ deficiency. MDCK cells were maintained in normal-K+ (ANK; [K+] = 5.0 mM), Low-K+ (ALK; [K+] = 2.5 mM), or K+-depleted (AKD; [K+] = 0 mM) medium. Cell count and cell death assay showed that ALK and AKD groups had marked decrease in cell proliferation without significant change in cell death. Other functional investigations revealed that AKD cells had significantly increased levels of carbonylated proteins (by OxyBlot assay), impaired tissue repair (by scratch assay), defective tight junction (by Western blotting, immunofluorescence staining and measuring transepithelial electrical resistance), increased intracellular ATP level (by ATP measurement), decreased levels of ubiquitinated proteins (by Western blotting), and increased level of Na+/K+-ATPase (by Western blotting), which was consistent with the increased cellular K+ uptake after K+ repletion. Our findings have shown that AKD caused defects in cell proliferation, oxidative stress response, tissue repair and tight junction integrity, but on the other hand, enhanced energy production, proteasome function and cellular K+ uptake. These findings may shed light onto cellular response to K+ deficiency and better understanding of both pathogenic and compensatory mechanisms in hypokalemic nephropathy.
Introduction
Hypokalemia is one of the most common electrolyte disorders caused by K+ imbalance. This state is generally defined as plasma K+ concentration ([K+]) of < 3.5 mmol/l. Clinical severity of hypokalemia depends on the degree of diminished plasma [K+] – moderate to severe hypokalemia is considered when plasma [K+] is < 2.5 mmol/lCitation1. K+ deficiency can cause defects in several organ systems, including kidney.Citation1,Citation2 Although the kidney is an organ that regulates K+ homeostasis, it can be affected by K+ deficiency.Citation3 Clinical manifestations of the renal involvement of hypokalemia (hypokalemic nephropathy) range from metabolic alkalosis, polyuria, polydipsia and hypertension to growth retardation, whereas renal pathologies include kidney enlargement, progressive tubulointerstitial damage, severe tubular dilation, and deposition of amorphous and laminated hyaline materials in renal tubular lumen.Citation4-Citation6 Defects in kidney function induced by hypokalemia can promote the disease progression to be more severe or chronic stage. This is concerned as a cause of subsequent morbidity and mortality. These draw our attention to better understand cellular responses and to search for mechanisms of tissue damage. Recent lines of evidence have demonstrated that the harmonized solving of the causative protein targets or functional defects can reduce disease severity in numerous renal diseases.Citation7-Citation10 Because pathologies of hypokalemic nephropathy are localized mainly in tubular part, the study of tubular epithelial cell responses is targeted. Previous study by our group has discovered a set of the altered proteins induced by K+ deficiency in renal tubular cells.Citation11 However, functional significance of such findings that might be used to explain the cellular responses associated with pathogenesis or compensatory mechanisms of hypokalemic nephropathy remained unknown.
The present study thus aimed to investigate the altered cellular functions and their molecular mechanisms associated with hypokalemic nephropathy induced by K+ deficiency. Basically, several cellular functions are controlled by a set of many proteins as network(s), we thus used their associations to predict potential functional changes and to guide for subsequent functional studies. All the altered proteins identified from our previous expression proteomics studyCitation11 were subjected to analysis of protein interactions and functional networks using Search Tool for the Retrieval of Interacting Genes/Protein (STRING) tool. Several various functional investigations were then performed to validate these predicted altered functions, including cell proliferation, cell death, oxidative stress, tissue repair, cell integrity, ATP production, proteasome function, and ion transport.
Results
Altered cellular functions predicted by protein interaction network analysis
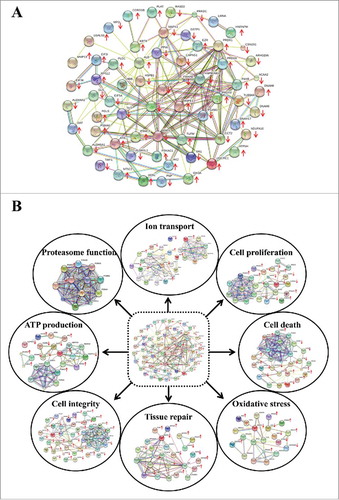
Biological functions of the cells are generally regulated by associations among various proteins and alterations of their expression and associations can affect cellular functions. In the present study, we analyzed the protein interaction networks of the altered proteins induced by K+ deficiency to guide for subsequent functional studies. All significantly altered proteins identified from our previous expression proteomics studyCitation11 were analyzed by STRING tool. The interaction network analysis revealed that these altered proteins had several associations among individuals as shown by various linkages to their neighborhoods based on integration of both physical and functional linking data from databases of experimental repositories, computational predictions, and public available literatures (). Moreover, the potential cellular functions were hinted by the functional protein interaction networks retrieved from GO biologic classification. These included cell proliferation (p = 0.043), cell death (p < 0.001), oxidative stress (p = 0.006), tissue repair (p = 0.002), cell integrity (p < 0.001), ATP production (p < 0.001), proteasome function (p = 0.047), and ion transport (p = 0.005) (). The altered proteins involved in individual functional networks are summarized in Supplementary Table S2.
Figure 1. Protein interaction networks of the altered proteins induced by K+ deficiency. (A): All altered proteins identified from our previous expression proteomics studyCitation11 were analyzed using STRING software. (B): From the entire network, the involved GO biologic functions are highlighted. Each interacting line color represents the interaction evidence, including neighborhood (dark green), gene fusion (red), co-occurrence (dark blue), co-expression (red), experiments (purple), databases (light blue) and text mining (light green). The proteins with arrow represent the identified proteins, whereas upward and downward arrows indicate increase and decrease, respectively, in level of each protein.
ALK and AKD decreased cell proliferation but did not affect cell death
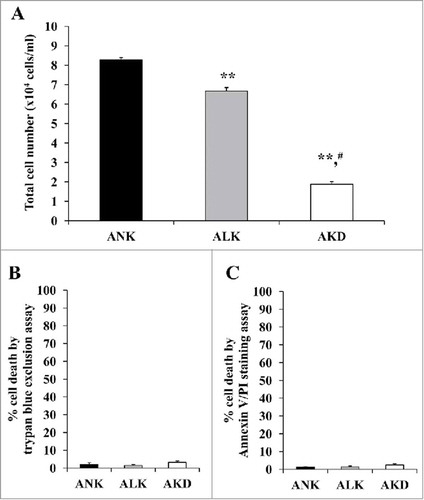
The protein interaction networks of cell proliferation and cell death were predicted by STRING analysis (). Therefore, total cell number was counted to evaluate cell proliferation, whereas cell death was investigated by trypan blue assay and flow cytometry with annexin V/propidium iodide (PI) co-staining. The data showed that total cell number representing cell proliferation was obviously decreased in ALK and AKD cells as compared with ANK (controlled) cells (), whereas no significant difference in cell death was observed by trypan blue assay and flow cytometry with annexin V/PI co-staining ( and ).
Figure 2. Cell proliferation and cell death. (A): After MDCK cells were maintained in ANK, ALK or AKD medium for 24 h, total number of the cells in each sample was counted. (B) and (C): Cell death was then examined by trypan blue assay and flow cytometry following annexin V/PI co-staining, respectively. Each bar represents mean ± SD of 3 independent experiments. ** = p < 0.01 vs. ANK; # = p < 0.01 vs. ALK.
AKD induced oxidative stress resulting in accumulation of protein carbonylation
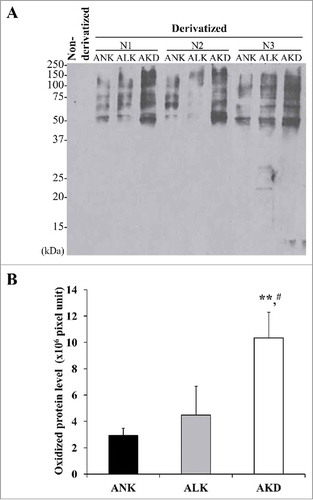
Interactions of the altered proteins involving in oxidative stress pathways implied the intracellular oxidative stress induced by K+ deficiency. Oxidative stress was then verified by immunoblot detection of carbonyl groups in oxidatively modified proteins. OxyBlot analysis revealed approximately 3-fold increase in levels of carbonylated proteins in AKD cells as compared with ANK and ALK groups (). However, no significant difference between ANK and ALK was observed.
Figure 3. Levels. of oxidatively modified proteins. (A): After MDCK cells were maintained in ANK, ALK or AKD medium for 24 h, OxyBlot assay was used to quantify DNP-derivatized or carbonylated proteins (non-derivatized sample served as a negative control). (B): Band intensity was measured. Each bar represents mean ± SD of 3 independent experiments. ** = p < 0.01 vs. ANK; # = p < 0.01 vs. ALK.
Tissue repair was delayed in AKD cells
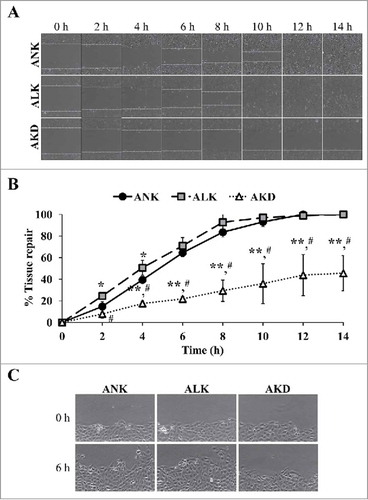
Tissue repair process requires both cell proliferation and cell migration activities. To exclude an effect from cell proliferation, this experiment using scratch assay was done immediately after changing the complete MEM culture medium to the conditioned medium (ANK, ALK or AKD) and the wound size was monitored within 0–14 h after the scratch. The data showed that AKD cells exhibited delayed wound healing as compared with ANK and ALK at all time-points ( and ). In addition, at 14 h, complete wound closure was observed in ANK and ALK groups, whereas AKD cells had only 45% of the tissue repair to close the wound site. Moreover, the protruded margin of the cells at the wound border at mid-point (approximately 6 h) was noticed only in ANK and ALK groups, but was absent in AKD group (), indicating defective migration of AKD cells.
Figure 4. Tissue repair. (A): The cell monolayers were subjected to evaluation of tissue repair activity using scratch assay. Original magnification of 40X in all panels. (B): Percentage of tissue repair was calculated as detailed in “Materials and Methods.” Quantitative data are presented as mean ± SD of 3 independent experiments. * = p < 0.05 vs. ANK; ** = p < 0.01 vs. ANK; # = p < 0.01 vs. ALK. (C): Zoom-in image of the border of the scratched wound to demonstrate protrusion of the cells in ANK and ALK groups to close the wound. Original magnification of 400X in all panels.
AKD reduced cell integrity
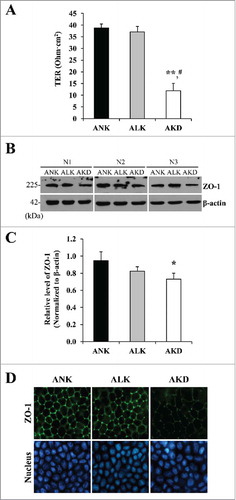
To assess whether K+ deficiency had any effect on epithelial cell integrity, transepithelial electrical resistance (TER) and tight junction assembly (which plays a crucial role to control paracellular barrier function and maintain cell integrity) were investigated. TER was evaluated for determining the ability to maintain paracellular barrier in polarized MDCK cells. AKD had significantly dropped TER (to approximately 1/3 of the control), whereas there was no significant difference between ANK and ALK observed (). To examine tight junction assembly, zonula occludens-1 (ZO-1) expression level and localization were evaluated. Western blot analysis showed that AKD cells had significantly decreased level of ZO-1 ( and ), consistent with the result observed by immunofluorescence study (). However, ZO-1 had no change in its localization (), indicating that K+ deficiency decreased ZO-1expression level but did not affect its translocation.
Figure 5. Cell integrity, transepithelial electrical resistance (TER) and expression of tight junction protein. (A): Tight junction barrier function was evaluated by TER measurement. (B): Expression level of ZO-1 was evaluated by Western blotting. (C): Intensity of ZO-1 band was measured and normalized with that of β-actin, which served as the loading control. (D): Expression and localization of ZO-1 was also examined by immunofluorescence staining. Original magnification was 400X in all panels. Each bar in (A) and (C) represents mean ± SD of 3 independent experiments. * = p < 0.05 vs. ANK; ** = p < 0.01 vs. ANK; # = p < 0.01 vs. ALK.
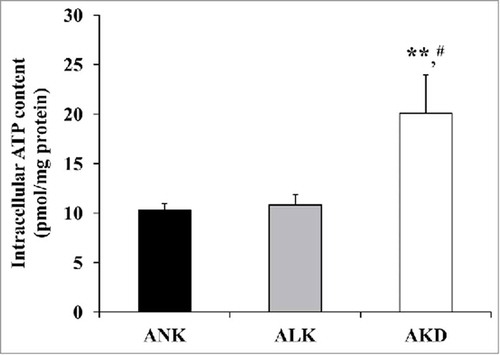
AKD increased intracellular ATP level
According to the predicted network involving metabolic and energy production, intracellular ATP level was determined. Using luciferin-luciferase assay, the significantly increased intracellular ATP level was found only in AKD cells (approximately 2-fold compared with ANK and ALK) ().
Figure 6. Intracellular ATP. After MDCK cells were maintained in ANK, ALK or AKD medium for 24 h, intracellular ATP was extracted and measured by luciferin-luciferase ATP assay. Total ATP level was subtracted with blank control and then normalized by protein amount in each sample. Each bar represents mean ± SD of 3 independent experiments. ** = p < 0.01 vs. ANK; # = p < 0.01 vs. ALK.
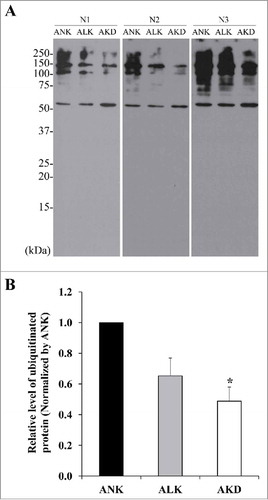
Ubiquitinated protein level was decreased after AKD
Our proteome data showed that K+ deficiency could induce the increased proteasome subunit. It might result in augmentation of proteasomal activity. Since ubiquitinated proteins are substrates for proteasome-dependent protein degradation, Western blotting was performed to detect ubiquitinated proteins as an indirect measurement of proteasomal degradation activity. The results showed that levels of ubiquitin-tagged proteins were significantly decreased in AKD cells and tended to decrease in ALK group (but did not reach a statistically significant threshold) ().
Figure 7. Levels of ubiquitinated proteins. (A): After MDCK cells were maintained in ANK, ALK or AKD medium for 24 h, ubiquitinated proteins were detected by Western blotting. (B): Intensity of ubiquitinated protein bands in each sample was quantitated and normalized with that of ANK. Each bar represents mean ± SD of 3 independent experiments. * = p < 0.05 vs. ANK.
Increased cellular K+ uptake in AKD cells after K+ repletion by increased Na+/K+-ATPase expression
Na+/K+-ATPase is an important transport protein necessary for cellular K+ uptake. To investigate the effect of K+ deficiency on K+ transport, Na+/K+-ATPase expression level was first examined using Western blot analysis. The significantly increase in Na+/K+-ATPase expression level was found in AKD cells, approximately 2-fold as compared with that of ANK and ALK cells ( and ). The ability to uptake K+ was subsequently investigated by measuring the remaining K+ content in the medium after K+ repletion with a medium containing 5.3 mM K+. The K+ content in the repletion medium was significantly reduced in AKD cells at both 1 and 10 min after repletion (). Accordingly, percentage of K+ uptake was strikingly increased in AKD cells approximately 3-fold as compared with that of ANK and ALK cells ().
Figure 8. Na+/K+-ATPase expression and cellular K+ uptake. (A): After MDCK cells were maintained in ANK, ALK or AKD medium for 24 h, expression level of Na+/K+-ATPase was evaluated by Western blotting. (B): Intensity of Na+/K+-ATPase band was measured and normalized with that of β-actin, which served as the loading control. (C): Remaining [K+] in culture supernatant was measured after K+ repletion for 1 and 10 min. (D): Percentage of cellular K+ uptake was then calculated. Each bar in (B)-(D) represents mean ± SD of 3 independent experiments. * = p < 0.05 vs. ANK; ** = p < 0.01 vs. ANK; # = p < 0.01 vs. ALK.
![Figure 8. Na+/K+-ATPase expression and cellular K+ uptake. (A): After MDCK cells were maintained in ANK, ALK or AKD medium for 24 h, expression level of Na+/K+-ATPase was evaluated by Western blotting. (B): Intensity of Na+/K+-ATPase band was measured and normalized with that of β-actin, which served as the loading control. (C): Remaining [K+] in culture supernatant was measured after K+ repletion for 1 and 10 min. (D): Percentage of cellular K+ uptake was then calculated. Each bar in (B)-(D) represents mean ± SD of 3 independent experiments. * = p < 0.05 vs. ANK; ** = p < 0.01 vs. ANK; # = p < 0.01 vs. ALK.](/cms/asset/94cf7cec-233b-4b64-9e17-55dc3ce6748e/kcam_a_1356554_f0008_b.jpg)
Discussion
Hypokalemia is a result of an abnormal K+ homeostasis. Although most of hypokalemic patients are asymptomatic, some of them develop defects in vital organs, including the kidney.Citation1,Citation2 However, molecular and cellular mechanisms underlying hypokalemic nephropathy remained largely unknown. In the present study, we investigated altered cellular functions of the cells underwent K+ deficiency using protein interaction networks to guide for functional studies. By using our previous proteome data setCitation11 and STRING analytical tool, 8 cellular processes have been predicted, including cell proliferation, cell death, oxidative stress, tissue repair, cell integrity, ATP production, proteasome function, and ion transport (). These predicted altered functions were then validated.
Our previous study found that levels of 30 and 46 proteins were significantly altered in AKD cells as compared with ANK and ALK, respectively.Citation11 And there were only 10 proteins that significantly differed between ANK and ALK, indicating that degree of detrimental changes was more severe in AKD than ALK, consistent with the intracellular [K+] in individual groups.Citation11 Among the 8 functions investigated in the present study, only cell proliferation that both ALK and AKD had significant differences from the controlled ANK group, whereas other functional tests showed only AKD to have significant effects and there were no statistically significant differences observed between ANK and ALK groups. These findings were in concordance with our previous expression proteome findingsCitation11 and with clinical manifestations of hypokalemic patients in which mild hypokalemia is associated with minimal or no symptoms, whereas moderate to severe hypokalemia is associated with severe symptoms and/or organ dysfunctions.Citation4-Citation6
In this study, we found a significant decrease in renal tubular cell proliferation without significant change in cell death (). Nevertheless, number of the dead cells in AKD group tended to be increased but did not reach statistically significant threshold. This indicated that cells underwent early phase of K+ deficiency could resist to severe cytotoxicity that could lead to the death. Additionally, the identified altered proteins in network of cell death were not the main effectors for death triggering (i.e., Fas, Bax, and Bcl-2 family proteins).Citation12-Citation15 We thus assumed that decreased expression levels of some proteins might sensitize cells to become just more susceptible to the death. For example, expression of DNA-dependent protein kinase catalytic subunit (DNAPK) in this network, which is an activator for Bax-mediated pro-apoptotic triggering ,Citation16 was increased in AKD cells. Hence, this may facilitate a gradual progression of cell death, which might be a cause of tubular atrophy found in late stage of hypokalemic nephropathy. Moreover, there might be compensatory mechanisms to counteract with these cell death pathways, which most likely overcame such protective regulations at later phase when K+ deficiency was prolonged.
Oxidative stress network was also predicted in this study. Functional analysis showed increased levels of carbonylated proteins, which were irreversibly damaged proteins induced by oxidative stress, in AKD cells (). In contrast, several antioxidant proteins had decreased levels in our previous expression proteomics study,Citation11 including glutathione-S-transferase P (GSTP1), myeloperoxidase (MPO), catalase (CAT) and heat shock protein 90 β (HSP90AB). Their reduction might cause cellular proteins to be more susceptible to oxidative stress. Since protein carbonylation can cause protein conformational and functional changes,Citation17,Citation18 our findings in the present study implied that K+ deficiency not only induced changes in protein expression, but might deprived protein function via oxidative stress-induced protein carbonylation.
Prolonged K+ deficiency can cause irreversible renal tubular damage and functional defects that ultimately lead to end-stage renal disease (ESRD). Tissue repair, therefore, should be considered as it is an essential process for recovering renal tubular integrity after tubular injury. Epithelial regeneration during healing process depends on 2 main factors, including cell migration and proliferation. We demonstrated that K+ deficiency could impair cell migration, and thus subsequently delayed tissue healing process (). Although the scratch assay was performed at an early phase to avoid effect of cell proliferation, other assay at later time-point demonstrated that K+ deficiency also decreased cell proliferation (). These findings suggested that, in fact, K+ deficiency could induce defect in tissue healing via impairments of both migration and proliferation of renal tubular cells. It is possible that the defective cell proliferation and migration were affected by decreased expression of mitogen activated protein kinase 1 (MAPK1),Citation11 which controls cell cycle, integrin signaling, cell migration and wound healing.Citation19-Citation21 We also presumed that impaired tissue healing induced by K+ deficiency might be associated with progressive tubulointerstitial damage and tubular cell atrophy observed in hypokalemic nephropathy.
Tight junction assembly is necessary for preservation of renal epithelial cell functions, including cell polarity, regulation of apical and basolateral localizations of membrane proteins, controlling paracellular transepithelial transports as a barrier.Citation22,Citation23 The barrier function of epithelial sheet, which regulates the passage of ions, water and various macromolecules through paracellular space, is essential for kidney function.Citation22,Citation23 We examined the effect of K+ deficiency on ion leakage through paracellular space by TER measurement. The decreased TER was observed () together with decreased expression level of ZO-1 (tight junction protein) (B-D). However, translocation of ZO-1 was not affected. These findings suggested that decrease expression level of ZO-1 was sufficient to disrupt tight junction and mediate the loss of renal tubular cell integrity and function. In other models, particularly cancer, the decreased expression of tight junction proteins can promote cell migration. It should be noted that our results did not follow such tendency. We found that K+ deficiency perturbed tight junction assembly and also reduced migrating ability of the cells (). This might simply reflect the characteristics of renal epithelial cells, which had inferior migrating activity as compared with the cancer cells. Additionally, hypokalemic condition might affect various cellular functions in a different manner as compared with other stresses or cytotoxic conditions.
Surprisingly, the result revealed that K+ deficiency increased level of intracellular ATP (). From protein interaction network analysis, the increase of ATP level might be a result from the elevated electron transport chain proteins, including ubiquinol-cytochrome c reductase core protein I isoform 2 (UQCRC1) and ATP synthase, H+ transporting, mitochondrial F0 complex synthase (ATP5G3). Their increase identified from our previous expression proteomics study ,Citation11 might accelerate proton driving and subsequently generate more intracellular ATP. Whether the increased intracellular ATP was a compensatory mechanism of the K+-deprived cells or was one among the inducers of deteriorated changes caused by K+-deficiency should be further elucidated.
The reduction of ubiquitin-tagged proteins was also found in AKD cells (). The outcome could be due to either a decrease of ubiquitination or an increase in proteasome activity. In our model, increased levels of proteasome subunits (PSMC2 and PSMA6) observed in our previous expression studyCitation11 might support the increase of proteasome activity. Several lines of evidence have reported that proteasome participates in regulation of ion channels, fibrotic signaling pathways, and cellular adaptation of the kidney after interventions.Citation24-Citation26 However, the precise mechanism underlying the increased proteasome activity and decreased levels of ubiquitinated proteins during K+ deficiency remained unclear and should be further elucidated.
Finally, the effect of K+ deficiency on ion transport, particularly cellular K+ uptake to replete the diminished intracellular K+ content, was also investigated. The data showed an increase in expression level of Na+/K+ -ATPase ( and ), which is responsible for K+ transport in exchange with Na+. While ALK and AKD did not increase cell death, we postulated that there should be some mechanisms to compensate for such K+ deprivation state, e.g. increase in transporter or exchanger activity to enhance cellular K+ uptake from surrounding environment which had only minimal amount of K+ content. Our hypothesis was confirmed by functional analysis to examine cellular K+ uptake after repletion with a medium with normal [K+]. The assay revealed a convincing data indicating that the AKD cells had dramatic enhancement of cellular K+ uptake as compared with other 2 groups ( and ), consistent with findings reported in previous studies.Citation27,Citation28 This might be one of the compensatory mechanisms to preserve renal tubular cells when K+ content was low.
In summary, we used our previous expression proteome data to generate protein interaction networks of the altered proteins induced by K+ deficiency, revealing cell proliferation, cell death, oxidative stress, tissue repair, cell integrity, ATP production, proteasome function, and ion transport as the potential altered cellular functions during K+ deprivation state. Our findings have shown that AKD caused defects in cell proliferation, oxidative stress response, tissue repair and tight junction integrity, but on the other hand, enhanced energy production, proteasome function and cellular K+ uptake. These findings may shed light onto cellular response to K+ deficiency and better understanding of both pathogenic and compensatory mechanisms in hypokalemic nephropathy.
Materials and methods
Protein interaction network analysis
Protein interaction networks were analyzed to guide for subsequent functional investigations. All the altered proteins induced by K+ deficiency identified by mass spectrometry in our previous studyCitation11 were subjected to interaction network analysis using the Retrieval of Interacting Genes/Proteins (STRING) software (version 10) ( http://string-db.org ). This tool generates protein-protein interaction networks base on integration of both physical and functional linking data from databases of experimental repositories, computational predictions, and public available literatures.Citation29 Protein interactions and functional connectivity were used for designing subsequent functional investigations.
Preparation of conditioned culture media
Three types of media, including normal-K+ (ANK) ([K+] = 5.3 mM), low-K+ (ALK) ([K+] = 2.5 mM) and K+-depleted (AKD) (without K+) media were prepared in-house. All compositions including other inorganic salts, amino acids and vitamins are detailed in Supplementary Table S1. All these media were supplemented with 2 mM L-glutamine (Gibco; Grand Island, NY), 1.2% Penicillin G/Streptomycin (Sigma; St. Louis, MO), and 10% fetal bovine serum (FBS) (Gibco). Note that FBS was dialyzed against K+-free Hank's solution (150 mM NaCl, 0.5 mM MgCl2, 0.2 mM Na2HPO4 and 0.4 mM NaH2PO4) at 4°C to remove K+ content before use.
Polarized cell cultivation and induction of K+ deficiency
A renal tubular cell line, Madin-Darby canine kidney (MDCK), was maintained in Eagle's minimum essential medium (MEM) (Gibco) supplemented with 10% heat-inactivated fetal bovine serum (FBS) (Gibco), 1.2% penicillin G/Streptomycin (Sigma) and 2 mM L-glutmine (Sigma). The polarized epithelial cells were generated by growing MDCK cells (7 × 10⁴ cells/well) on 4% collagen type IV-coated membrane insert of Transwell (0.4-µm pore size; Corstar; Cambridge, MA) for 3 d. The cells were maintained in a humidified incubator at 37°C under 5% CO2.
For induction of K+ deficiency, the culture medium was removed and the cells were washed with membrane preservative buffer (PBS containing 1 mM MgCl2 and 0.1 mM CaCl2) 3 times. The cells were further maintained in ANK, ALK or AKD medium in a humidified incubator at 37°C under 5% CO2 for further 24 h and then harvested for functional investigations as follows.
Western blot analysis
Proteins were extracted from cells under ANK, ALK or AKD condition using Laemmli's buffer (0.05 M Tris-HCl (pH 6.8), 4% β-mercaptoethanol, 2% SDS and 10% glycerol). Extracted proteins were quantified by Bradford's method using Bio-Rad Protein Assay (Bio-Rad Laboratories; Hercules, CA). Thereafter, equal amount of total protein was resolved in 12% SDS-PAGE gel (30 µg/lane) and the resolved proteins were transferred onto a nitrocellulose membrane. Non-specific bindings were blocked with 5% skim milk/PBS and the membrane was then incubated with mouse monoclonal anti-ZO-1 (Zymed; San Francisco, CA), rabbit polyclonal anti-ubiquitin (Santa Cruz Biotechnology; Santa Cruz, CA), mouse monoclonal anti-Na+/K+-ATPase (Santa Cruz Biotechnology), or mouse monoclonal anti-β-actin (Santa Cruz Biotechnology) antibody with a dilution of 1:1,000 in 1% skim milk/PBS at 4°C overnight. After washing with PBS, the membrane was further incubated with corresponding secondary antibody conjugated with horseradish peroxidase (1:2,000 in 1% skim milk/PBS) at room temperature (RT) (set at 25°C) for 1 h. Immunoreactive protein bands were visualized by SuperSignal West Pico chemiluminescence substrate (Pierce Biotechnology, Inc.; Rockford, IL) and autoradiography. Band intensity data was obtained using ImageQuant TL software (GE Healthcare; Uppsala, Sweden).
Determination of cell proliferation and cell death
Trypan blue staining was performed to initially discriminate between viable and dead cells. MDCK cells were grown at a density of 1 × 10⁴ cells/well. After treatment, floating cells were collected, whereas the adhered cells were trypsinized by 0.1% trypsin in 2.5 mM EDTA/PBS. After pooling both cell fractions, all the cells were centrifuged at 300 g. Cell pellet was resuspended with 1 ml conditioned medium. Thereafter, 10 µl of the cell suspension was mixed with trypan blue at a ratio of 1:1 and the cells were counted using a hemacytometer cell counting chamber. The total cell number represented cell proliferation, whereas percentage of cell death was calculated using a formula:
Cell death was also quantitated by flow cytometry using annexin V/propidium iodide (PtdIns) co-staining. Briefly, MDCK cells were grown in 6-well plate at a density of 2.5 × 10⁵ cells/well. Adhered and floating cells were collected and washed as described in trypan blue assay. The cells at a final concentration of 1.0 × 10⁵ cells/ml were then resuspended in 1X ice-cold annexin V binding buffer followed by an incubation with 5 µl annexin V conjugated with fluorescein isothiocyanate (FITC) (BD Biosciences; San Jose, CA) in the dark for15 min. Thereafter, 2 µl propidium iodine (PI) (BD Biosciences) was added and incubated with the cells in the dark for further 5 min. The stained cells were finally analyzed by flow cytometry using Accuri C6 flow cytometer (BD Accuri, Beckman Coulter; Fullerton, CA). From a total of 1 × 10⁴ cells analyzed per experimental condition, both apoptotic and necrotic cells were counted as the dead cells and percentage of cell death was calculated using the above formula.
Determination of oxidative stress using OxyBlot assay
The oxidized proteins were measured using OxyBlot (Chemicon International; Temecula, CA), instead of spectrophotometry-based method to eliminate the artifactual effects caused by reaction of nucleic acids and 2, 4-dinitrophenylhydrazine (DNPH).Citation30 For prevention of protein oxidation after cell lysis, proteins were extracted by β-mercaptoethanol-containing lysis buffer (Laemmli's buffer) and immediately derivatized with DNPH.Citation30 After incubation for 15 min, the reaction was promptly stopped by adding neutralizing solution. The derivatized proteins were resolved by 12% SDS-PAGE and then transferred onto a nitrocellulose membrane. After non-specific bindings were blocked with 5% BSA/PBS at RT for 30 min, the membrane was incubated with primary antibody against DNP moiety of the oxidatively modified proteins (rabbit polyclonal anti-DNP antibody; Chemicom) (1:1,000 in 1% BSA/PBS) at RT for 1 h, and then with corresponding secondary antibody conjugated with horseradish peroxidase (Dako, Glostrup, Denmark) (1:2,000 in 1% skim milk/PBS) at RT for 1 h. Finally, the oxidized proteins were detected by SuperSignal West Pico chemiluminescence substrate (Pierce Biotechnology, Inc.) and autoradiography. Intensity data representing oxidized protein level in each sample was obtained using ImageQuant TL software (GE Healthcare). The non-derivatized sample served as a negative control.
Evaluation of tissue repair capacity by scratch assay
Tissue repair capacity of the cells was evaluated by scratch assay. Briefly, MDCK cells were inoculated in 6-well plate with complete MEM supplemented with 10% FBS (Gibco), 1.2% penicillin G/Streptomycin (Sigma) and 2 mM L-glutmine (Sigma) until confluent. The culture medium was then replaced with ANK, ALK or AKD and the cell monolayers were immediately scratched along the culture well diameter using a 200-µl pipette tip to create a cell-free area. After washing with PBS to remove debris and detached cells, the cells were further maintained in a humidified incubator at 37°C with 5% CO2. The scratched wound size was serially measured at indicated time-points (0, 2, 4, 6, 8, 10, 12 and 14 h after the scratch) using BioStation CT (Nikon Corp.; Tokyo, Japan). The captured images were submitted to Tarosoft® Image framework v.0.9.6 (Nikon) to accurately measure the cell-free width in at least 10 positions per sample. Percentage of tissue repair at each time-point was calculated using the formula:
where Distance T0 refered to the wound size at 0 h and Distance Tn was the wound size at the indicated time-point.
Determination of cell integrity by measurement of transepithelial electrical resistance (TER) and expression level of a tight junction protein
Tight junction integrity was investigated as one of the indicators for the cell integrity. The polarized MDCK cells were subjected to TER measurement at 3 different sites in each sample well using Millicell-ERS resistance system (Millipore; Bedford, MA) following manufacturer's instructions. Average resistant value was then subtracted with background obtained from blank control (coated-well without cells using the same conditioned medium). Thereafter, the net resistance was multiplied by the membrane area to obtain the resistance in a unit of Ohm·cm.Citation2
In addition, expression level of zonula occludens-1 (ZO-1), a tight junction associated protein, was evaluated by Western blotting as aforementioned. Moreover, expression and localization of ZO-1 were also examined by immunofluorescence staining. Briefly, the cells were rinsed twice with membrane preservative buffer (PBS containing 1 mM MgCl2 and 0.1 mM CaCl2), fixed with 3.7% paraformaldehyde/PBS at RT for 10 min, and permeabilized with 0.1% triton X-100/PBS at RT for 10 min, followed by blocking non-specific bindings with 1% BSA/PBS for 30 min. The cells were incubated with mouse monoclonal anti-ZO-1 antibody (Zymed) (1:200 in 1% BSA/PBS) at 37°C for 1 h and then with AlexaFluor-488-conjugated goat anti-mouse IgG (Invitrogen/Molecular Probes; Urlington, Canada) (1:2,000 in 1% BSA/PBS) and Hoechst dye (Invitrogen/Molecular Probes) for nuclear staining at RT for 1 h. The inserted membrane was then ripped out followed by mounting with 50% glycerol/PBS on a glass slide. Finally, localization of ZO-1 was examined by a fluorescence microscope (Nikon Eclipse 80i; Nikon, Tokyo, japan).
Measurement of the intracellular ATP level by luciferin-luciferase ATP assay
The treated MDCK cells were washed twice with PBS and lysed with pre-cooled ATP extraction buffer containing 25 mM Tricine buffer (pH 7.8), 100 µM EDTA, 1 mM DTT and 1% Triton X-100. The clarified supernatant was collected after removal of cell debris by centrifugation at 1,000 g and 4°C for 5 min. A total of 10 µl ATP extract was then reacted with 100 µl of the luciferin-luciferase reaction solution (25 mM Tricine buffer (pH 7.8), 0.5 mM D-luciferin, 1.25 µg/ml luciferase, 5 mM MgSO4, 100 µM EDTA, and 1 mM DTT) in 96-well plate at RT in the dark. The luminescence, luciferin-ATP reaction product, was immediately detected by a luminometer (BioTek Synergy H1 Hybrid Multi-Mode microplate Reader) (BioTek instruments; Winooski, VT). Blank control was used for background subtraction and ATP level in each sample was calculated from ATP standard curve. Finally, ATP level was normalized to total protein amount in each sample and is reported as pmol/mg protein.
Investigation of proteasome function
Since ubiquitinated proteins are the substrate for proteasome-dependent protein degradation, proteasome function was determined by Western blot analysis of remained modified proteins as an indirect measurement of proteasomal degradation activity. Protein sample was extracted from cells and subjected to Western blotting using rabbit polyclonal anti-ubiquitin antibody (Santa Cruz Biotechnology) as a primary antibody as detailed above.
Validation of effect of K+ deficiency on Na+/K+-ATPase expression and cellular K+ uptake
Expression of Na+/K+-ATPase, the protein involved in cellular K+ uptake and transport, was quantified after exposure to AKD, ALK or AKD condition by Western blotting using mouse monoclonal anti-Na+/K+-ATPase (Santa Cruz Biotechnology) as a primary antibody as detailed above.
In addition, cellular uptake of K+ after K+ repletion was also examined to evaluate Na+/K+-ATPase activity as a mechanism of cellular adaptive response to K+ deficiency. MDCK cells were incubated with ANK, ALK or AKD medium for 24 h. The cells were washed twice with plain conditioned medium. Dead cells and remaining media were then carefully removed. The cells were incubated with K+ repletion medium (medium containing 5.3 mM K+) and culture supernatant was collected after repletion for 1 and 10 min. Cellular K+ uptake was determined by measurement of the remaining K+ level in culture supernatant using Cobas 8000 Modular Analyzer (Roche Diagnostics Ltd; Rotkreuz, Switzerland). Finally, the remaining K+ concentration and percentage of K+ uptake were compared.
Statistical analysis
All experiments were done in biologic triplicate. The quantitative data are presented as mean ± SD. Multiple comparisons were done by ANOVA with Tukey's post-hoc multiple tests. P values less than 0.05 were considered statistically significant.
Disclosure of potential conflicts of interest
No potential conflicts of interest were disclosed.
Author contributions
CK and VT designed research; CK performed experiments; CK and VT analyzed data; CK and VT wrote the manuscript; All authors reviewed and approved the manuscript.
Supplemental Files
Download PDF (58 KB)Funding
This study was supported by Mahidol University research grant, Office of the Higher Education Commission and Mahidol University under the National Research Universities Initiative, and the Thailand Research Fund (RTA5680004 and IRG5980006). VT is also supported by “Chalermphrakiat” and “Research Staff” Grants, Faculty of Medicine Siriraj Hospital. C. Kapincharanon was supported by Siriraj Graduate Thesis Scholarship.
Related Research Data
References
- Unwin RJ, Luft FC, Shirley DG. Pathophysiology and management of hypokalemia: a clinical perspective. Nat Rev Nephrol. 2011;7:75-84. https://doi.org/10.1038/nrneph.2010.175. PMID:21278718
- Weiner ID, Wingo CS. Hypokalemia–consequences, causes, and correction. J Am Soc Nephrol. 1997;8:1179-88. PMID:9219169
- Lee EY, Yoon H, Yi JH, Jung WY, Han SW, Kim HJ. Does hypokalemia contribute to acute kidney injury in chronic laxative abuse? Kidney Res Clin Pract. 2015;34:109-12. https://doi.org/10.1016/j.krcp.2014.10.009. PMID:26484031
- Thongboonkerd V, Chutipongtanate S, Kanlaya R, Songtawee N, Sinchaikul S, Parichatikanond P, Chen ST, Malasit P. Proteomic identification of alterations in metabolic enzymes and signaling proteins in hypokalemic nephropathy. Proteomics. 2006;6:2273-85. https://doi.org/10.1002/pmic.200500530. PMID:16502468
- Ray PE, Suga S, Liu XH, Huang X, Johnson RJ. Chronic potassium depletion induces renal injury, salt sensitivity, and hypertension in young rats. Kidney Int. 2001;59:1850-8. https://doi.org/10.1046/j.1523-1755.2001.0590051850.x. PMID:11318956
- Suga SI, Phillips MI, Ray PE, Raleigh JA, Vio CP, Kim YG, Mazzali M, Gordon KL, Hughes J, Johnson RJ. Hypokalemia induces renal injury and alterations in vasoactive mediators that favor salt sensitivity. Am J Physiol Renal Physiol. 2001;281:F620–F629. PMID:11553508
- Yan Y, Bai J, Zhou X, Tang J, Jiang C, Tolbert E, Bayliss G, Gong R, Zhao TC, Zhuang S. P2X7 receptor inhibition protects against ischemic acute kidney injury in mice. Am J Physiol Cell Physiol. 2015;308:C463–C472. https://doi.org/10.1152/ajpcell.00245.2014. PMID:25588875
- Gorin Y, Cavaglieri RC, Khazim K, Lee DY, Bruno F, Thakur S, Fanti P, Szyndralewiez C, Barnes JL, Block K, et al. Targeting NADPH oxidase with a novel dual Nox1/Nox4 inhibitor attenuates renal pathology in type 1 diabetes. Am J Physiol Renal Physiol. 2015;308:F1276–F1287. https://doi.org/10.1152/ajprenal.00396.2014. PMID:25656366
- Thongboonkerd V. Proteomic analysis of renal diseases: Unraveling the pathophysiology and biomarker discovery. Expert Rev Proteomics. 2005;2:349-66. https://doi.org/10.1586/14789450.2.3.349. PMID:16000082
- Morigi M, Perico L, Rota C, Longaretti L, Conti S, Rottoli D, Novelli R, Remuzzi G, Benigni A. Sirtuin 3-dependent mitochondrial dynamic improvements protect against acute kidney injury. J Clin Invest. 2015;125:715-26. https://doi.org/10.1172/JCI77632. PMID:25607838
- Peerapen P, Ausakunpipat N, Chanchaem P, Thongboonkerd V. Alterations of proteins in MDCK cells during acute potassium deficiency. Biochim Biophys Acta. 2016;1864:683-96. https://doi.org/10.1016/j.bbapap.2016.03.007. PMID:26976750
- Schelling JR, Nkemere N, Kopp JB, Cleveland RP. Fas-dependent fratricidal apoptosis is a mechanism of tubular epithelial cell deletion in chronic renal failure. Lab Invest. 1998;78:813-24. PMID:9690559
- Skommer J, Brittain T, Raychaudhuri S. Bcl-2 inhibits apoptosis by increasing the time-to-death and intrinsic cell-to-cell variations in the mitochondrial pathway of cell death. Apoptosis. 2010;15:1223-33. https://doi.org/10.1007/s10495-010-0515-7. PMID:20563668
- Yamamoto K, Tomita N, Yoshimura S, Nakagami H, Taniyama Y, Yamasaki K, Ogihara T, Morishita R. Hypoxia-induced renal epithelial cell death through caspase-dependent pathway: role of Bcl-2, Bcl-xL and Bax in tubular injury. Int J Mol Med. 2004;14:633-40. PMID:15375594
- Wei Q, Dong G, Chen JK, Ramesh G, Dong Z. Bax and Bak have critical roles in ischemic acute kidney injury in global and proximal tubule-specific knockout mouse models. Kidney Int. 2013;84:138-48. https://doi.org/10.1038/ki.2013.68. PMID:23466994
- Liu J, Naegele JR, Lin SL. The DNA-PK catalytic subunit regulates Bax-mediated excitotoxic cell death by Ku70 phosphorylation. Brain Res. 2009;1296:164-75. https://doi.org/10.1016/j.brainres.2009.07.101. PMID:19664609
- Castro JP, Ott C, Jung T, Grune T, Almeida H. Carbonylation of the cytoskeletal protein actin leads to aggregate formation. Free Radic Biol Med. 2012;53:916-25. https://doi.org/10.1016/j.freeradbiomed.2012.06.005. PMID:22705366
- Banan A, Zhang Y, Losurdo J, Keshavarzian A. Carbonylation and disassembly of the F-actin cytoskeleton in oxidant induced barrier dysfunction and its prevention by epidermal growth factor and transforming growth factor alpha in a human colonic cell line. Gut. 2000;46:830-7. https://doi.org/10.1136/gut.46.6.830. PMID:10807896
- Kavurma MM, Khachigian LM. ERK, JNK, and p38 MAP kinases differentially regulate proliferation and migration of phenotypically distinct smooth muscle cell subtypes. J Cell Biochem. 2003;89:289-300. https://doi.org/10.1002/jcb.10497. PMID:12704792
- Nelson PR, Yamamura S, Mureebe L, Itoh H, Kent KC. Smooth muscle cell migration and proliferation are mediated by distinct phases of activation of the intracellular messenger mitogen-activated protein kinase. J Vasc Surg. 1998;27:117-25. https://doi.org/10.1016/S0741-5214(98)70298-8. PMID:9474089
- Imayasu M, Shimada S. Phosphorylation of MAP kinase in corneal epithelial cells during wound healing. Curr Eye Res. 2003;27:133-41. https://doi.org/10.1076/ceyr.27.3.133.16055. PMID:14562178
- Balda MS, Whitney JA, Flores C, Gonzalez S, Cereijido M, Matter K. Functional dissociation of paracellular permeability and transepithelial electrical resistance and disruption of the apical-basolateral intramembrane diffusion barrier by expression of a mutant tight junction membrane protein. J Cell Biol. 1996;134:1031-49. https://doi.org/10.1083/jcb.134.4.1031. PMID:8769425
- Denker BM, Sabath E. The biology of epithelial cell tight junctions in the kidney. J Am Soc Nephrol. 2011;22:622-5. https://doi.org/10.1681/ASN.2010090922. PMID:21415157
- Fukasawa H, Yamamoto T, Togawa A, Ohashi N, Fujigaki Y, Oda T, Uchida C, Kitagawa K, Hattori T, Suzuki S, et al. Down-regulation of Smad7 expression by ubiquitin-dependent degradation contributes to renal fibrosis in obstructive nephropathy in mice. Proc Natl Acad Sci U S A. 2004;101:8687-92. https://doi.org/10.1073/pnas.0400035101. PMID:15173588
- Eaton DC, Malik B, Bao HF, Yu L, Jain L. Regulation of epithelial sodium channel trafficking by ubiquitination. Proc Am Thorac Soc. 2010;7:54-64. https://doi.org/10.1513/pats.200909-096JS. PMID:20160149
- Malik B, Yue Q, Yue G, Chen XJ, Price SR, Mitch WE, Eaton DC. Role of Nedd4-2 and polyubiquitination in epithelial sodium channel degradation in untransfected renal A6 cells expressing endogenous ENaC subunits. Am J Physiol Renal Physiol. 2005;289:F107–F116. https://doi.org/10.1152/ajprenal.00179.2002. PMID:15769939
- Hayashi M, Katz AI. The kidney in potassium depletion. I. Na+-K+-ATPase activity and [3H]ouabain binding in MCT. Am J Physiol. 1987;252:F437–F446
- Hayashi M, Katz AI. The kidney in potassium depletion. II. K+ handling by the isolated perfused rat kidney. Am J Physiol. 1987;252:F447–F452
- Szklarczyk D, Franceschini A, Wyder S, Forslund K, Heller D, Huerta-Cepas J, Simonovic M, Roth A, Santos A, Tsafou KP, et al. STRING v10: protein-protein interaction networks, integrated over the tree of life. Nucleic Acids Res. 2015;43:D447–D452. https://doi.org/10.1093/nar/gku1003. PMID:25352553
- Luo S, Wehr NB. Protein carbonylation: avoiding pitfalls in the 2,4-dinitrophenylhydrazine assay. Redox Rep. 2009;14:159-66. https://doi.org/10.1179/135100009X392601. PMID:19695123