
ABSTRACT
Hepatocellular carcinoma (HCC) is the most common subtype of liver cancer. Many patients with hepatocellular carcinoma are diagnosed at an advanced stage because the early symptoms are not obvious. For advanced hepatocellular carcinoma, immunotherapy and targeted therapy seem to be a promising direction. Finding a new prognostic marker for hepatocellular carcinoma and exploring its role in the immune microenvironment is of great value. ABCC transporters have previously been associated with drug resistance in hepatocellular tumors, but the exact mechanism remains unclear. Here, we conducted a study on ABCC5 in HCC and found that the expression of ABCC5 was up-regulated in HCC and was associated with poor prognosis. Further exploration revealed that ABCC5 was associated with immune infiltration of hepatocellular carcinoma. Single-cell analysis revealed a potential relationship between ABCC5 and immune cell differentiation. Therefore, it is significant to continue to explore the role of ABCC5 in hepatocellular carcinoma.
Transporters on the cell membrane mediate the transport of a variety of substrates, including endogenous substances, exogenous substances, ions, drugs, etc [Citation1]. The solute carrier transporter and ATP-binding cassette transporter family are the most important transporters in biology [Citation2–4]. Among them, ABC transporters are widely expressed from bacteria to mammals [Citation5]. By binding and hydrolyzing ATP, ABC transporters power the transport of a wide variety of substrates [Citation2]. ABC transporter plays an important role in human physiology, pathophysiology, pharmacology, and toxicology [Citation6].
The ABCC transporter family is one of the major members of the ABC transporter superfamily, including multidrug resistance-associated proteins (MRPs), sulfonylurea receptors (SURs), and cystic fibrosis transmembrane conductance regulatory proteins (CFTR) [Citation7]. The largest member of the ABCC transporter family is MRPs, including MRP1 (ABCC1), MRP2 (ABCC2), MRP3 (ABCC3), MRP4 (ABCC4), MRP5 (ABCC5), MRP6 (ABCC6), MRP7 (ABCC10), MRP8 (ABCC11), MRP9 (ABCC12) and MRP10 (ABCC13) [Citation8]. Among them, ABCC5 mediates the transmembrane transport of cyclic nucleotides or nucleotide analogs and is currently found to be poorly expressed in many normal tissues, including hepatocytes [Citation9]. However, in liver cells, total parenteral nutrition or toxic allyl alcohol therapy can induce the up-regulation of ABCC5 expression [Citation10]. In LPS-treated rats, ABCC5 expression was strongly induced in liver cells [Citation11]. It can be seen that ABCC5 may be related to liver inflammation, but the specific mechanism is still unclear.
Hepatocellular carcinoma is the most common type of primary liver cancer [Citation12]. In 2018, hepatocellular carcinoma was the sixth most common and the fourth most deadly worldwide [Citation13]. Because the early symptoms of HCC are not obvious, a large proportion of HCC patients are already advanced when they are diagnosed [Citation14]. Therefore, finding a novel biomarker for hepatocellular carcinoma is of great significance for the prognosis of HCC patients. At present, the exploration of the immune microenvironment of hepatocellular carcinoma is in full throttle, and the application of immune checkpoint inhibitors in advanced hepatocellular carcinoma has achieved a good initial effect [Citation15]. However, the current understanding of the immune microenvironment of hepatocellular carcinoma is far from sufficient. Further exploration of the immune pattern of hepatocellular carcinoma has profound implications for understanding its pathogenesis and establishing more effective treatment regimens.
Single-cell sequencing (scRNA-seq) is a revolutionary scientific research technology [Citation16]. Single-cell sequencing focuses first on differences in cell state and then on differences in gene expression [Citation17]. ScRNA-seq analysis can be used to perform cluster analysis according to the gene expression of individual cells [Citation18]. Based on cluster analysis, we were able to identify new and unique immune cell subsets in health and disease, describe random heterogeneity between immune cell groups, and construct developmental “tracks” of immune cells [Citation16].
In this study, we performed the expression analysis, prognostic analysis, immune infiltration analysis, and single-cell analysis to explore the role of ABCC5 in HCC. Our results can provide some references for diagnosis and treatment of HCC.
Methods
Data downloading and processing
We downloaded transcriptome data and clinical data from UCSC Xena. At the same time, we downloaded the transcriptome data (LIHC-count and LIHC-FPKM) and clinical data of 371 HCC and 50 normal liver tissues from the TCGA website. Then, 338 patients with both clinical data and transcriptome data of 17,689 encoding gene expression were obtained by excluding the data with survival time equal to 0 and the data with gene expression number less than 32. The LIHC-count data of HCC were subsequently analyzed for the difference. After the LIHC-FPKM data type is converted to THE LIHC-TPM, the subsequent analysis is performed. We also downloaded a single-cell sequencing dataset (GSE146115) for HCC from the Gene Expression Omnibus(GEO) database. By eliminating the cells with a total number of genes less than 300, a total expression of genes greater than 7000, a percentage of mitochondrial genes greater than 5, and a proportion of red blood cell genes greater than 3, 19,788 genes and 2587 cells were finally obtained.
TIMER2.0 database
TIMER2.0 database (http://timer.cistrome.org/) was used to perform the expression analysis. We click the “exploration” module and enter the gene “ABCC5” in the “Gene Expression” module to obtain the expression of this gene in pan-cancer.
Oncomine database
The Oncomine database (https://www.oncomine.org/resource/login.html) was used as the expression analysis. We entered the gene “ABCC5” in the “searching” box, and then obtained the expression of the gene in a variety of cancers.
Univariate COX regression
To exclude the effects of confounders, univariate COX regression was performed to explore the prognostic value of ABCC in pan-cancer. The indicators included overall survival (OS), disease-specific survival (DSS), and progression-free survival (PFS).
Multivariate COX regression
In order to find independent prognostic factors for HCC, we combined ABCC5 gene expression with other disease-related factors, including pathological stage, T stage, gender, age, etc., to conduct multivariate COX regression.
Immune infiltration analysis
Using the “CIBERSORT” code data available and 22 immune cell comparison documents on the CIBERSORT website, we calculated the immune cell infiltration in HCC samples. At the same time, we eliminated immune cells with 0 gene expression, and finally obtained the proportion of each immune cell.
Single-cell dimension reduction analysis and cluster analysis
The highly variable gene was set at 3000, and the 10 most prominent markers were identified. And then we normalized the data and scaled all the RNAs. Next, PCA principal component analysis was performed on the basis of the 3000 highly variable genes, and the number of PC was set as 6. Finally, the clustered cell cluster was obtained through the tSNE method.
Cell subpopulation annotation
We distinguish immune cells from nonimmune cells by their marker genes (EPCAM, PTPRC, COL2A1). All the cells are then annotated through the “singleR” package to get the cell type for each cluster.
Pseudotime analysis
The “Monocle” R package was used to predict the differentiation state and trajectory of immune cells, and the distribution of different cell clusters in the differentiation process could be analyzed.
Cistrome database
In the Cistrome database, we used the function of Cistrome cancer and then clicked the module of “Cancer Transcription Factor Targets” to obtain a list of Transcription factors, including 317 potential Transcription factors of ABCC5.
Co-expression analysis
Pearson correlation analysis was conducted between the expression of the ABCC5 gene and all other genes, and the conditions of COR>0.6&P < 0.05 were set to obtain the co-expressed genes of ABCC5. Then, we demonstrated the expression pattern of these co-expressed genes during the differentiation of immune cells by heat map.
Gene enrichment analysis
The input co-expressed genes (COR > 0.6&P < 0.05) were compared with the background gene set through the “GOplot” R package for enrichment analysis. The Gene Ontology enrichment consists of three parts: molecular function, biological process, and cell composition.
Gene Set Variation Analysis (GSVA)
We used the “GSVA” package for GSVA analysis. First, we downloaded the gene set “HALLMARK” from the GSEA website as the background gene set for subsequent analysis. Then, the enrichment score of each sample in the pathway was obtained. Finally, the different pathways of the ABCC5 high expression group and low expression group were analyzed by “LIMMA” package, and the different pathways of the ABCC5 high expression group and the low expression group were finally obtained (P < 0.05), which were displayed in the form of the rotated bar chart.
Results
Expression of ABCC5 in pan-cancer
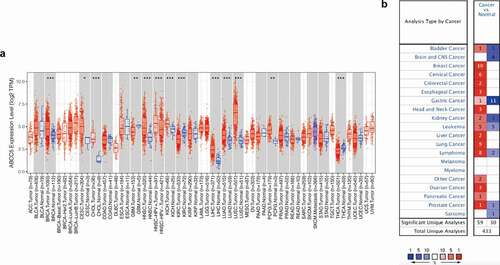
As shown in ()), ABCC5 was differentially expressed in various types of cancer, including BRCA, CSEC, GBM, HNSC, HNSC-HPV, KICH, KIRC, LIHC, LUAD, LUSC, PCPG, and THCA. The expression of ABCC5 was up-regulated in 10 types of cancer (BRCA, CESC, GBM, HNSC, HNSC – HPV, KIRC, LIHC, LUAD, LUSC, PCPG), but down-regulated in PCPG and THCA. In order to further demonstrate the expression of ABCC5 in cancer, we explored its expression through the Oncomine database. As shown in ()), The expression of the ABCC5 gene was up-regulated in a variety of cancers (including breast cancer, esophagus cancer, head and neck cancer, kidney cancer, liver cancer, lung cancer, etc.).
Figure 1. Expression of ABCC5 in pan-cancer. (a)ABCC5 was differentially expressed in various types of cancer, including Breast invasive carcinoma (BRCA), cervical squamous cell carcinoma and endocervical adenocarcinoma (CSEC), Glioblastoma multiforme (GBM), Head and Neck squamous cell carcinoma (HNSC), HNSC-HPV, Kidney Chromophobe (KICH), Kidney renal clear cell carcinoma (KIRC), Liver hepatocellular carcinoma (LIHC), Lung adenocarcinoma (LUAD), Lung squamous cell carcinoma (LUSC), Pheochromocytoma and Paraganglioma (PCPG), and Thyroid carcinoma (THCA). * P < 0.05, ** P < 0.01, and *** P < 0.001. (b)The expression of the ABCC5 gene was up-regulated in a variety of cancers (including breast cancer, esophagus cancer, head and neck cancer, kidney cancer, liver cancer, lung cancer, etc.)
The prognostic value of ABCC5 in pan-cancer
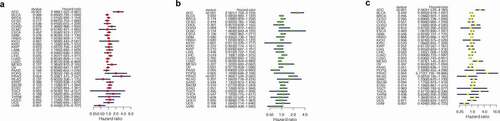
We used different methods to evaluate the prognostic value of ABCC5 in cancer. As shown in (), we found that the high ABCC5 expression was associated with significantly reduced overall survival in two cancers (LIHC, ); LUSC, )). ABCC5 was highly expressed in the above two types of cancer (). To further explore the prognostic value of this gene, we used COX regression to explore its role in overall survival time (OS), progression-free survival (PFS), and Disease-free survival (DFS) of prognosis. As shown in (, no matter in OS, PFS, or DSS, high expression of ABCC5 is associated with poor prognosis of patients with HCC.
Figure 2. The prognostic value of ABCC5 in pan-cancer. (a)High ABCC expression has no prognostic value in BRCA (p = 0.578). (b)High ABCC expression has no prognostic value in GBM (p = 0.199). (c)High ABCC expression has no prognostic value in KICH (p = 0.944). (d)High ABCC expression has no prognostic value in KIRC (p = 0.156). (e)High ABCC expression has no prognostic value in THCA (p = 0.313). (f)High ABCC expression has no prognostic value in CESC (p = 0.506). (g)High ABCC expression has no prognostic value in HNSC (p = 0.382). (h)High ABCC expression is associated with poor prognosis of LIHC (p = 0.009). (i)High ABCC expression has no prognostic value in PCPG (p = 0.352). (j)High ABCC expression is associated with poor prognosis of LUSC (p = 0.009). (k)High ABCC expression has no prognostic value in LUAD (p = 0.659)
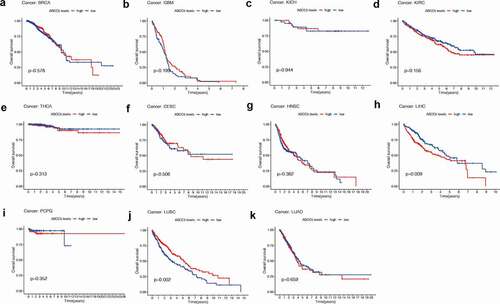
Figure 3. Considering that the survival analysis was influenced by multiple variables of the patient, univariate Cox regression was performed to reduce the influence of other variables. (a)COX regression showed that ABCC5 was a predictor of overall survival (p < 0.001). (b)COX regression showed that ABCC5 was a predictor of progression-free survival (p < 0.001). (c)COX regression showed that ABCC5 was a predictor of disease-free survival (p < 0.001)
Clinical value of ABCC5 expression in HCC
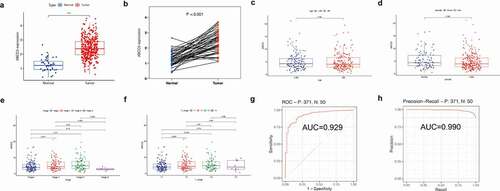
As shown in (), we found that the expression of the ABCC5 gene in HCC was up-regulated regardless of whether the HCC and normal tissue were paired (p < 0.05), which was consistent with our previous findings. Then we investigated the relationship between the expression of this gene and clinical features and found that the expression of ABCC5 was not related to age, and there was no significant difference in the expression of this gene between HCC patients>60 years old and HCC patients≤60 years old ()). Similarly, we also found that in terms of gender, there was no significant difference in the expression of this gene between male and female HCC patients ()). However, we found that the expression of this gene was different in the pathological stage of the tumor and the T stage of the tumor. There was a significant difference between stage 1 and stage 3 of ABCC5 (P < 0.05), and the expression level of ABCC5 in stage 3 was higher than that in stage 1 ()). At the same time, the expression of this gene was different between T1 and T3 (P < 0.05), and the expression level of T3 was also higher than that of T1 ()), which may indicate that the increased expression level of this gene is closely related to the progress of the tumor. Then, we evaluated the diagnostic value of this gene in HCC by plotting the ROC curve and PRC curve. It was found ()) that the AUC under the ROC curve was 0.929, while the AUC under the PRC curve was 0.990, suggesting that this gene could be a good potential diagnostic marker for HCC.
Figure 4. Clinical value of ABCC5 expression in HCC. (a)Without matching between HCC and normal tissues, ABCC5 gene expression in HCC was up-regulated (P < 0.05). (b)The expression of ABCC5 gene in HCC was up-regulated (P < 0.05) after random matching between HCC and normal tissues. (c)The expression of ABCC5 was not related to age, and there was no significant difference in the expression of this gene between HCC patients>60 years old and HCC patients≤60 years old. (d)There was no significant difference in the expression of ABCC5 between male and female HCC patients. (e)There was a significant difference between stage 1 and stage 3 of ABCC5 (P < 0.05), and the expression level of ABCC5 in stage 3 was higher than that in stage 1. (f)The expression of this gene was different between T1 and T3 (P < 0.05), and the ABCC5 expression level of T3 was higher than that of T1. (g, h)We evaluated the diagnostic value of ABCC5 in HCC by plotting the ROC curve (Figure 4(g)) and PRC curve (Figure 4(h)). It was found that the AUC value of ROC curve was 0.929, and the AUC under the PRC curve was 0.990, suggesting that this gene could be a good potential diagnostic marker for HCC
Univariate and multivariate COX analysis
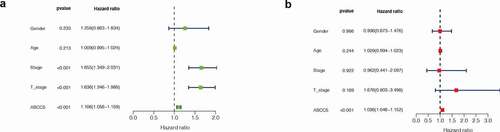
In order to evaluate whether ABCC5 can be an independent prognostic factor in HCC, univariate and multivariate COX analyses were performed. As shown in ()), it was found that in univariate COX analysis, ABCC5 expression, pathological stage, and T stage of tumor were correlated with prognosis (P < 0.05), but in multivariate COX analysis ()), only ABCC5 was correlated with prognosis (P < 0.05). These results suggest that ABCC5 can be an independent prognostic factor in HCC.
Figure 5. Univariate and multivariate COX analysis. (a) In univariate COX analysis, ABCC5 expression, pathological stage, and T stage of tumor were correlated with prognosis of HCC (P < 0.05) (b)In multivariate COX analysis, only ABCC5 was correlated with prognosis (P < 0.05)
Immune infiltration analysis
We used the CIBERSORT method to evaluate the infiltration of immune cells in HCC. ()) shows the proportion of immune cells in each HCC patient. We found that macrophages and T cells were the main immune cells in HCC patients. Then we divided HCC samples into low ABCC5 expression group and high ABCC5 expression group according to the median ABCC5 expression value. It was found that there were 9 different immune cell expressions between the low ABCC5 expression group and high ABCC5 expression group ()), including B cell memory, T cell CD8, T cells CD4 memory resting, T cells Follicular helper, T cells regulatory (Tregs), Monocytes, Macrophages M0, Macrophage M2, Dendritic cells activated. In addition, B cell memory, T cells CD4 memory activated, T cells Follicular helper, T cells regulatory (Tregs), Macrophages M0, and macrophagic cells activated were up-regulated in the high ABCC5 expression group (P < 0.05). T cell CD8, Monocytes, Macrophages M2 were down-regulated in the high ABCC5 expression group (P < 0.05).
Figure 6. Immune infiltration analysis. (a)The proportion of immune cells in each HCC patient. Macrophages and T cells were the main immune cells in HCC patients. (b)There were 9 different immune cell expressions between the low ABCC5 expression group and high ABCC5 expression group, including B cell memory, T cell CD8, T cells CD4 memory resting, T cells Follicular helper, T cells regulatory (Tregs), Monocytes, Macrophages M0, Macrophage M2, Dendritic cells activated. In addition, B cell memory, T cells CD4 memory activated, T cells Follicular helper, T cells regulatory (Tregs), Macrophages M0, and macrophagic cells activated were up-regulated in the high ABCC5 expression group (P < 0.05). T cell CD8, Monocytes, Macrophages M2 were down-regulated in the high ABCC5 expression group (P < 0.05). (c-l)Correlation analysis was conducted between the expression of ABCC5 gene and immune cells, and it was found that ABCC5 gene was correlated with 10 kinds of immune cells (P < 0.05), among which the immune cells positively correlated with ABCC5 were: T cells follicular helper, macrophagic cells resting, Macrophages M0, Eosinophils, B cells memory. ABCC5 negatively related immune cells were: T cell CD8, NK cells resting, Monocytes, Mast cells resting, Macrophage M1 (P < 0.05). (m)The intersection of the immune cells obtained by the above two methods got 6 types of significant immune cell. They were: Macrophages M0, Monocytes, Dendritic cells resting, B cells memory, T cells CD8, T cells Follicular Helper
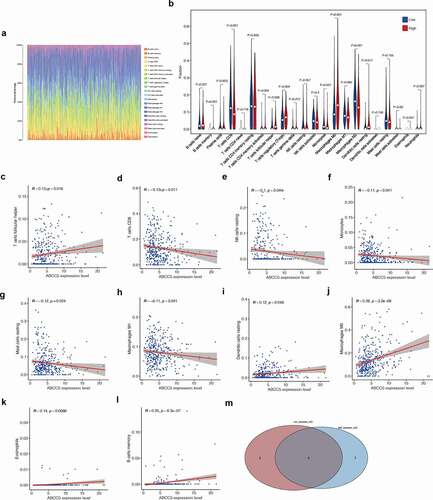
Correlation analysis was conducted between the expression of ABCC5 gene and immune cells, and it was found that ABCC5 gene was correlated with 10 kinds of immune cells (P < 0.05), among which the immune cells positively correlated with ABCC5 were: T cells follicular helper, macrophagic cells resting, Macrophages M0, Eosinophils, B cells memory. ABCC5 negatively related immune cells were: T cell CD8, NK cells resting, Monocytes, Mast cells resting, Macrophage M1 (P < 0.05). Finally, we took the intersection of the immune cells obtained by the above two methods and finally got 6 types of significant immune cell. They were: Macrophages M0, Monocytes, Dendritic cells resting, B cells memory, T cells CD8, T cells Follicular Helper.
Single-cell quality control and dimension reduction cluster analysis
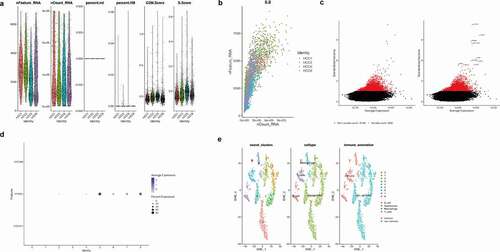
As shown in ()), the total gene expression of each cell fluctuated from 0 to 300,000. In addition, both the number of gene expressions in each cell and the sum of gene expression in the 4 samples of HCC were relatively similar. At the same time, we found that the percentage of mitochondrial genes and red blood cell genes was less than 3%. Moreover, the G2M and S phase scores of the cell cycle were basically similar in the four HCC samples, suggesting that the cell cycle had no significant impact on the subsequent analysis. Then, in ()), we found that the number of genes in the cells was positively correlated with the sum of gene expression, with a correlation of 0.8. In addition, the overall trend of the four samples was similar, suggesting that there was no significant difference between the number of cells and the number of genes detected in the four samples. We then screened 3,000 hypervariable genes from all the genes, shown in red in ()), and tagged the top 10 hypervariable genes. They were JOHAIN, IGLL5, REG3A, HIST1H40, ORP, ELK2AP, SSR4, SPARO, MS4A1, and OOL5. Then we selected the number of PC as 6, carried out PCA principal component analysis and reduced the latitude, and finally obtained 8 cell clusters. Later, we further differentiated immune cells and nonimmune cells in HCC samples. As shown in ()), we found that marker genes of immune cells in Cluster5, 6, 7, and 8, especially PTPRC, were highly expressed, suggesting that 5, 6, 7, and 8 might be immune cells. Finally, as shown in ()), we used the tSNE diagram to show the results of the cell cluster, cell “singlerR” annotation, and immune and nonimmune cells and found that the results of immune cells obtained by immune cell marker gene annotation were consistent with those obtained by singleR package annotation. As can be seen in the figure, the liver parenchyma cells account for a large proportion while immune cells account for a small proportion. Immune cells are divided into Macrophages, T_cells, and B_cells.
Figure 7. Single-cell quality control and dimension reduction cluster analysis. (a)The total gene expression of each cell fluctuated from 0 to 300,000. In addition, both the number of gene expressions in each cell and the sum of gene expression in the 4 samples of HCC were relatively similar. At the same time, we found that the percentage of mitochondrial genes and red blood cell genes was less than 3%. Moreover, the G2M and S phase scores of the cell cycle were basically similar in the four HCC samples, suggesting that the cell cycle had no significant impact on the subsequent analysis. (b)The number of genes in the cells was positively correlated with the sum of gene expression, with a correlation of 0.8. In addition, the overall trend of the four samples was similar, suggesting that there was no significant difference between the number of cells and the number of genes detected in the four samples. (c)3,000 hypervariable genes from all the genes shown in red and the top 10 hypervariable genes. They were JOHAIN, IGLL5, REG3A, HIST1H40, ORP, ELK2AP, SSR4, SPARO, MS4A1, and OOL5. (d)We found that marker genes of immune cells in Cluster 5, 6, 7, and 8, especially PTPRC, were highly expressed, suggesting that 5, 6, 7, and 8 might be immune cells. (e)The results of the cell cluster, cell “singlerR” annotation, and immune and nonimmune cells and the results of immune cells obtained by immune cell marker gene annotation were consistent with those obtained by singleR package annotation
Further analysis of the relationship between ABCC5 and immune cells
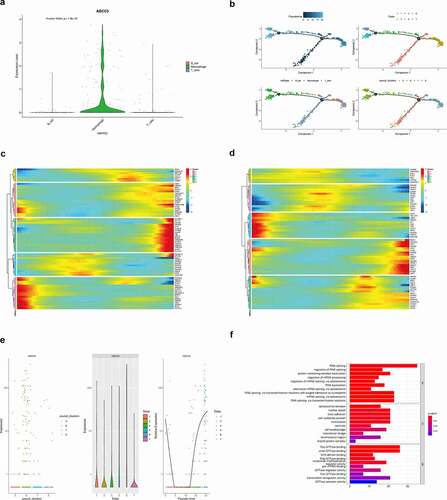
In order to further explore the relationship between the ABCC5 gene and immune cells, we first evaluated the expression of the ABCC5 gene in immune cells, as shown in ()). It was found that compared with B-cell and T_cell, the ABCC5 gene was mainly expressed in Macrophage cells (P < 0.001). In order to further study ABCC5 expression changes during the differentiation of immune cells, we used the “Monocle” package to map the differentiation trajectory of immune cells, as shown in ()). The darker the blue, the earlier the differentiation occurred, that is, the cells differentiated from the dark blue branches to the lighter blue branches. We found that the upper right corner of ()) indicates seven differentiated states of immune cells, with the red at the bottom being the earlier ones. The figure in the lower-left corner of ()) indicates that with the differentiation of immune cells, the earliest differentiated cells may be T-cell, followed by B cell and macrophage. The lower-right corner of ()) shows the distribution of different immune cell clusters during the differentiation of immune cells, that is, red Cluster 5 at the bottom may start to differentiate first, then differentiate into Cluster 7 and 8, and finally differentiate into Cluster 6. At the same time, as shown in ()), during the differentiation of immune cells, the expression changes of gene ABCC5 and its co-expressed genes were grouped into five modules. For example, in the first module, the gene expression was mainly increased first and then decreased (including PDCL, DNAJC18, METTL8, etc.). ABCC5 gene was included in the pink module, suggesting that with the differentiation of immune cells, the expression of ABCC5 and other genes in the module first increased, then decreased, and then increased, which may indicate that ABCC5 plays an important role in the differentiation of immune cells. In ()), we also explored the expression of transcription factors related to the ABCC5 gene during the differentiation of immune cells, and the results suggested that the expression of transcription factors related to the ABCC5 gene also changed during the differentiation of immune cells. As shown in ()), the ABCC5 gene was singled out to explore its specific expression changes during the differentiation of immune cells. It was found that with the development of differentiation, the expression of the ABCC5 gene first decreased, and then increased again when it reached a certain value, suggesting that ABCC5 may play a certain role in the differentiation of immune cells in HCC. Then we further investigated the function of the genes co-expressed with ABCC5, and through GO analysis, we found that these genes were mainly related to RNA synthesis and splicing modification ()).
Figure 8. The relationship between ABCC5 and immune cells. (a)Compared with B-cell and T_cell, the ABCC5 gene was mainly expressed in Macrophage cells (P < 0.001). (b)The differentiation trajectory of immune cells. The darker the blue, the earlier the differentiation occurred, that is, the cells differentiated from the dark blue branches to the lighter blue branches. We found that the upper right corner of (Figure 8(b)) indicates seven differentiated states of immune cells, with the red at the bottom being the earlier ones. The figure in the lower-left corner of (Figure 8(b)) indicates that with the differentiation of immune cells, the earliest differentiated cells may be T-cell, followed by B cell and macrophage. The lower-right corner of (Figure 8(b)) shows the distribution of different immune cell clusters during the differentiation of immune cells, that is, red Cluster 5 at the bottom may start to differentiate first, then differentiate into Cluster 7 and 8, and finally differentiate into Cluster 6. (c)During the differentiation of immune cells, the expression changes of gene ABCC5 and its co-expressed genes were grouped into five modules. For example, in the first module, the gene expression was mainly increased first and then decreased (including PDCL, DNAJC18, METTL8, etc.). ABCC5 gene was included in the pink module, suggesting that with the differentiation of immune cells, the expression of ABCC5 and other genes in the module first increased, then decreased, and then increased, which may indicate that ABCC5 plays an important role in the differentiation of immune cells. (d)Expression of transcription factors related to the ABCC5 gene during the differentiation of immune cells, and the results suggested that the expression of transcription factors related to the ABCC5 gene also changed during the differentiation of immune cells. (e)The ABCC5 gene was singled out to explore its specific expression changes during the differentiation of immune cells. It was found that with the development of differentiation, the expression of the ABCC5 gene first decreased, and then increased again when it reached a certain value, suggesting that ABCC5 may play a certain role in the differentiation of immune cells in HCC. (f)GO analysis found that the coexpressed genes of ABCC5 were mainly related to RNA synthesis and splicing modification
Gene Set Variation Analysis (GSVA)
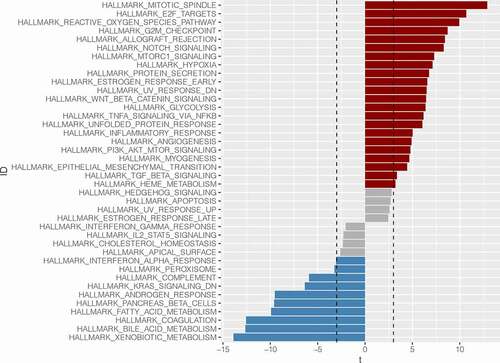
Through GSVA enrichment analysis, we found that genes in the ABCC5 overexpression group were mainly enriched in cell cycle-related pathways, such as HALLMARK_MTOTIC_SPINDLE, HALLMARK_E2F_TARGETS, HALLMARK_G2M_CHECKPOINT pathway (). These pathways play an important role in the occurrence and development of HCC. Meanwhile, we found that the ABCC5 low expression group was mainly related to metabolism-related pathways, such as HALLMARK_XENOBOTIC_METABOLISM, HALLMARK_BILE_ACID_METABOLISM, and HALLMARK_FATTY_ACID_METABLISM ().
Figure 9. Gene Set Variation Analysis (GSVA). Genes in the ABCC5 overexpression group were mainly enriched in cell cycle-related pathways, such as HALLMARK_MTOTIC_SPINDLE, HALLMARK_E2F_TARGETS, HALLMARK_G2M_CHECKPOINT pathway. These pathways play an important role in the occurrence and development of HCC. Meanwhile, we found that the ABCC5 low expression group was mainly related to metabolism-related pathways, such as HALLMARK_XENOBOTIC_METABOLISM, HALLMARK_BILE_ACID_METABOLISM, and HALLMARK_FATTY_ACID_METABLISM
Discussion
Despite the rapid development of new treatments for cancer, a significant proportion of cancer patients are still dying from the development of drug resistance that leads to the spread of cancer [Citation19]. This has led people to think about how to reduce the resistance of tumors while exploring new treatment options. It is generally believed that the emergence of drug resistance is related to the acquisition of new gene mutations by tumor cells, the reactivation of growth signaling pathways, the active expulsion of drugs by tumor cells, and immune reediting [Citation20]. The ABCC transporters were formerly known as multidrug resistance proteins (MRPs) [Citation2]. This nomenclature reflects their importance in tumor drug resistance. A large body of evidence has confirmed that ABCC transporters are associated with acquired drug resistance in a variety of cancers, including hepatocellular carcinoma, but the exact mechanism remains unclear [Citation21]. ABCC5 is a transporter that is poorly expressed in normal hepatocytes but is strongly induced to express when hepatocytes are injured by exogenous or endogenous substances [Citation11]. Therefore, ABCC5 may play an important role in liver diseases, including hepatocellular carcinoma. Now, developments in the tumor microenvironment provide the background for our analysis of the role of ABCC transporters in HCC. It is time to analyze the role of ABCC5 in the tumor microenvironment of hepatocellular carcinoma.
In this study, We first conducted a pan-cancer analysis of ABCC5, then explored the significance of ABCC5 in HCC, and finally conducted a single-cell analysis. We found that ABCC5 expression was up-regulated in HCC and was associated with a poor prognosis. COX regression showed that ABCC5 was an independent prognostic indicator of HCC. Further studies found that ABCC5 was associated with immune cell infiltration in HCC. Therefore, we performed a single-cell analysis to analyze the role of ABCC5 in the immune microenvironment in depth. Single-cell analysis revealed that ABCC5 might be related to the differentiation of immune cells.
Obstacles to improving prognosis in patients with hepatocellular carcinoma include an incomplete understanding of drug resistance and a lack of early prognostic markers [Citation22]. Although the ABCC family has been widely believed to be associated with resistance in HCC, the specific mechanisms are not well understood [Citation2]. We found that ABCC5 expression was up-regulated in hepatocellular carcinoma, and high ABCC5 expression was associated with a poor prognosis of HCC. To a certain extent, this provides an effective prognostic marker for patients with hepatocellular carcinoma, which is significant for improving the prognosis of patients.
Further exploration of the role of ABCC5 in the tumor microenvironment revealed that ABCC5 expression was correlated with immune cell infiltration. These cells include memory B cells, CD8 + T cells, T cells CD4 memory Activated, T cells Follicular Helper, T cells regulatory (Tregs), and Macrophages M0. As we all know, the immune function in the human body is divided into innate immunity and acquired immunity, which exists in both normal defense and tumor immunity [Citation23]. Immunotherapy of tumors is built on these functions. Currently, immunotherapy has become the most promising tumor treatment regimen, successfully improving the prognosis of many solid tumors, such as melanoma [Citation24]. HCC is a highly immune-related tumor [Citation25]. Multiple crosstalks in the immune microenvironment of HCC provide the possibility of tumor immune escape [Citation25]. We found that ABCC5 is associated with immune infiltration in hepatocellular carcinoma, which provides a reference for subsequent exploration of the immune microenvironment.
Heterogeneity exists in all tumors, including inter-tumor heterogeneity and intra-tumor heterogeneity [Citation26]. While bulk RNA sequencing has provided a milestone role in our understanding of cancer genomics, it has limitations [Citation27]. Bulk RNA sequencing treated the tumor as an undifferentiated whole, ignoring its heterogeneity [Citation28]. Single-cell sequencing improves the precision of sequencing and allows us to analyze the cancer genome at the single-cell level [Citation29]. Hence, single-cell analysis has greatly promoted the exploration of the tumor immune microenvironment. Using single-cell analysis, we were able to identify immune subsets and map their differentiation tracks [Citation29]. In this way, we can not only observe the development and activation state of immune cells in the microenvironment of HCC but also study the differences in gene expression of different subsets and the relationship between immune subsets and ABCC5.
Overall, our study provides a novel prognostic marker for hepatocellular carcinoma. In addition, single-cell analysis can provide some new ideas for exploring the immune microenvironment of HCC. This can make sense for understanding the immune microenvironment of hepatocellular carcinoma.
Conclusion
Hepatocellular carcinoma is a tumor with a poor prognosis. ABCC transporters are thought to be associated with drug resistance in hepatocellular carcinoma. Therefore, we explored the significance of ABCC5 in hepatocellular carcinoma. The results showed that ABCC5 was associated with poor prognosis of HCC, and had a potential relationship with immune cell infiltration and differentiation. Our study can provide reference for the diagnosis and treatment of hepatocellular carcinoma.
Acknowledgments
We are very grateful for data provided by databases such as TCGA, GEO.
Disclosure statement
No potential conflict of interest was reported by the authors.
References
- Seeger MA. Membrane transporter research in times of countless structures. Biochim Biophys Acta Biomembr. 2018;1860(4):804–808.
- Liu X. ABC Family Transporters. Adv Exp Med Biol. 2019;1141:13–100.
- Xie J, Ruan S, Zhu Z, et al. Database mining analysis revealed the role of the putative H+/sugar transporter solute carrier family 45 in skin cutaneous melanoma. Channels (Austin). 2021;15(1):496–506.
- Xie J, Zhu Z, Cao Y, et al. Solute carrier transporter superfamily member SLC16A1 is a potential prognostic biomarker and associated with immune infiltration in skin cutaneous melanoma. Channels (Austin). 2021;15(1):483–495.
- Dean M, Rzhetsky A, Allikmets R. The human ATP-binding cassette (ABC) transporter superfamily. Genome Res. 2001;11(7):1156–1166.
- Rempel S, Gati C, Nijland M, et al. A mycobacterial ABC transporter mediates the uptake of hydrophilic compounds. Nature. 2020;580(7803):409–412.
- Revilla-Guarinos A, Zhang Q, Loderer C, et al. ABC Transporter DerAB of Lactobacillus casei Mediates Resistance against Insect-Derived Defensins. Appl Environ Microbiol. 2020;86(14):e00818–20.
- Toyoda Y, Hagiya Y, Adachi T, et al. MRP class of human ATP binding cassette (ABC) transporters: historical background and new research directions. Xenobiotica. 2008;38(7–8):833–862.
- Wang S, Zhuang W, Zhang W, et al. The association of single nucleotide polymorphisms in ABCC5 gene with primary angle closure glaucoma and the ocular biometric parameters in a Northern Chinese Population [published online ahead of print, 2020 Sep 9]. Ophthalmic Res. 2020. DOI:https://doi.org/10.1159/000511454.
- Meyer Zu Schwabedissen HE, Grube M, Heydrich B, et al. Expression, localization, and function of MRP5 (ABCC5), a transporter for cyclic nucleotides, in human placenta and cultured human trophoblasts: effects of gestational age and cellular differentiation. Am J Pathol. 2005;166(1):39–48.
- Meer K, Kessler W, Meyer zu Schwabedissen HE, et al. Sepsis affects cardiac expression of multidrug resistance protein 5 (MRP5, ABCC5), an ABC-type CGMP export pump. Shock. 2007;28(5):564–569.
- Kim DW, Talati C, Kim R. Hepatocellular carcinoma (HCC): beyond sorafenib-chemotherapy. J Gastrointest Oncol. 2017;8(2):256–265.
- Russo FP, Imondi A, Lynch EN, et al. When and how should we perform a biopsy for HCC in patients with liver cirrhosis in 2018? A review. Dig Liver Dis. 2018;50(7):640–646.
- Xu F, Zha G, Wu Y, et al. Overexpressing lncRNA SNHG16 inhibited HCC proliferation and chemoresistance by functionally sponging hsa-miR-93. Onco Targets Ther. 2018;11:8855–8863. Published 2018 Dec 7.
- El Dika I, Khalil DN, Abou-Alfa GK. Immune checkpoint inhibitors for hepatocellular carcinoma. Cancer. 2019;125(19):3312–3319.
- Papalexi E, Satija R. Single-cell RNA sequencing to explore immune cell heterogeneity. Nat Rev Immunol. 2018;18(1):35–45.
- Zheng C, Zheng L, Yoo JK, et al. Landscape of infiltrating T Cells in liver cancer revealed by single-cell sequencing. Cell. 2017;169(7):1342–1356.e16.
- Zhang S, Liu Z, Wu D, et al. Single-Cell RNA-seq analysis reveals microenvironmental infiltration of plasma cells and hepatocytic prognostic markers in HCC with cirrhosis. Front Oncol. 2020;10:596318. Published 2020 Nov 2.
- Wu Q, Yang Z, Nie Y, et al. Multi-drug resistance in cancer chemotherapeutics: mechanisms and lab approaches. Cancer Lett. 2014;347(2):159–166.
- Mullard A. Stemming the tide of drug resistance in cancer. Nat Rev Drug Discov. 2020;19(4):221–223.
- Chaves C, Remiao F, Cisternino S, et al. Opioids and the blood-brain barrier: a dynamic interaction with consequences on drug disposition in brain. Curr Neuropharmacol. 2017;15(8):1156–1173.
- Piñero F, Dirchwolf M, Pessôa MG. Biomarkers in hepatocellular carcinoma: diagnosis, prognosis and treatment response assessment. Cells. 2020;9(6):1370. Published 2020 Jun 1.
- O’Donnell JS, Teng MWL, Smyth MJ. Cancer immunoediting and resistance to T cell-based immunotherapy. Nat Rev Clin Oncol. 2019;16(3):151–167.
- Abbott M, Ustoyev Y. Cancer and the immune system: the history and background of immunotherapy. Semin Oncol Nurs. 2019;35(5):150923.
- Li S, Yang F, Ren X. Immunotherapy for hepatocellular carcinoma. Drug Discov Ther. 2015;9(5):363–371.
- McGranahan N, Swanton C. Clonal heterogeneity and tumor evolution: past, present, and the future. Cell. 2017;168(4):613–628.
- Assefa AT, Vandesompele J, Thas O. SPsimSeq: semi-parametric simulation of bulk and single-cell RNA-sequencing data. Bioinformatics. 2020;36(10):3276–3278.
- Bao X, Shi R, Zhao T, et al. Integrated analysis of single-cell RNA-seq and bulk RNA-seq unravels tumour heterogeneity plus M2-like tumour-associated macrophage infiltration and aggressiveness in TNBC. Cancer Immunol Immunother. 2021;70(1):189–202.
- Farlik M, Sheffield NC, Nuzzo A, et al. Single-cell DNA methylome sequencing and bioinformatic inference of epigenomic cell-state dynamics. Cell Rep. 2015;10(8):1386–1397.