
 ?Mathematical formulae have been encoded as MathML and are displayed in this HTML version using MathJax in order to improve their display. Uncheck the box to turn MathJax off. This feature requires Javascript. Click on a formula to zoom.
Abstract
To plan cluster-randomized trials with sufficient statistical power to detect intervention effects on student achievement, researchers need multilevel design parameters, including measures of between-classroom and between-school differences and the amounts of variance explained by covariates at the student, classroom, and school level. Previous research has mostly been conducted in the United States, focused on two-level designs, and limited to core achievement domains (i.e., mathematics, science, reading). Using representative data of students attending grades 1–12 from three German longitudinal large-scale assessments (3,963 14,640), we used three- and two-level latent (covariate) models to provide design parameters and corresponding standard errors for a broad array of domain-specific (e.g., mathematics, science, verbal skills) and domain-general (e.g., basic cognitive functions) achievement outcomes. Three covariate sets were applied comprising (a) pretest scores, (b) sociodemographic characteristics, and (c) their combination. Design parameters varied considerably as a function of the hierarchical level, achievement outcome, and grade level. Our findings demonstrate the need to strive for an optimal fit between design parameters and target research context. We illustrate the application of design parameters in power analyses.
Educational research strongly moved toward evidence-based policies and practices at the outset of the 21st century, when educational stakeholders around the world increasingly demanded sound evidence of what actually works to foster student achievement (Kultusministerkonferenz, Citation2015; Organisation for Economic Co-operation and Development [OECD], Citation2007; Slavin, Citation2002). Formal education is usually organized within intact classrooms and schools. Further, various interventions operate by definition at the group level, such as teaching methods, curricular programs, or school reforms (Bloom, Citation2005; Boruch & Foley, Citation2000; Cook, Citation2005). A fundamental question of evidence-based education is therefore whether results on the effectiveness of interventions tested in small-scale laboratory experiments can be replicated when implementing these interventions, for instance, in the regular school day by teachers at the classroom or school level (see, e.g., Gersten et al., Citation2015). An efficient way for educational researchers to address this concern is to conduct large-scale experiments where entire classrooms or schools rather than individual students are randomly assigned to the treatment or control condition. Studies of this type are known as cluster-randomized trials (CRTs; Donner & Klar, Citation2000; Raudenbush, Citation1997), place-based trials (Bloom, Citation2005), or group-randomized trials (Murray, Citation1998). CRTs can provide unbiased causal inferences about the impacts of interventions in the field at larger scales, and thus generate reliable knowledge to inform evidence-based educational policies and practices (Institute of Education Sciences & National Science Foundation, Citation2013; Slavin, Citation2002; Spybrook, Shi, et al., Citation2016).
Given their scale, CRTs are by nature very expensive. Hence, when planning such trials educational researchers should make every effort to ensure that their study design will allow for valid causal conclusions (Shadish et al., Citation2002). In this respect, a power analysis is an essential step in the planning phase of any CRT (American Educational Research Association, Citation2006, p. 37; American Psychological Association, Citation2019, pp. 83–84). However, power analysis for CRTs is particularly challenging as it requires reasonable assumptions on design parameters that take into account the multilevel (i.e., nested) structure of the outcome data. The reviews on CRTs in educational research (Spybrook & Raudenbush, Citation2009; Spybrook, Shi, et al., Citation2016) indicated that most studies (between 82 and 90%) had at least three hierarchical levels (e.g., students nested within classrooms, and classrooms nested within schools), with treatment allocation at either the classroom or school level. Thus, most educational researchers conducting CRTs need multilevel design parameters that inform about the proportions of variance located at the student, classroom, and school level, as well as the respective amounts of variance that can be explained by vital covariates (e.g., pretest scores or sociodemographic characteristics) at these levels. Crucially, leading scholars strongly recommend using empirically established estimates of design parameters that match the target population, the target hierarchical level, and the target outcome measure rather than conventional benchmarks with unclear ties to the research context under investigation (Bloom et al., Citation2008; Brunner et al., Citation2018; Lipsey et al., Citation2012). To date, most knowledge on design parameters is based on U.S. samples, only pertains to two-level designs (i.e., students within schools), and is limited to mathematics, science, and reading achievement (cf. Spybrook, Citation2013; Spybrook & Kelcey, Citation2016). Hence, the overarching goal of this article is to substantially expand the empirical body of knowledge on design parameters for CRTs in these three major dimensions. Our study is the first to compile (normative distributions of) design parameters with standard errors that are relevant to (I) the German school context or similar school systems, (II) three- as well as two-level designs, and (III) a broad variety of achievement domains.
Statistical Framework
Researchers need several multilevel design parameters to perform power analyses for CRTs aimed at enhancing student achievement based on three-level designs (Bloom et al., Citation2008; Hedges & Rhoads, Citation2010; Konstantopoulos, Citation2008a), where students at level one (L1) are nested within classrooms at level two (L2) which, in turn, are nested within schools at level three (L3):Footnote1 (a) intraclass correlations quantifying the proportions of total variance in students’ achievement that can be attributed to achievement differences between classrooms within schools (
) and between schools (
), as well as (b) the amounts of variance in students’ achievement that can be explained by covariates, typically measured as squared multiple correlations
at the student (
), classroom (
), and school level (
).
The intraclass correlation at L2 is given by
(1)
(1)
and at L3 by
(2)
(2)
where
represents the total variance in students’ achievement across all individual students, with
and
denoting the variances between students within classrooms in schools, between classrooms within schools, and between schools, respectively.
0 implies that there are no between-classroom or between-school achievement differences, but rather that the total variance in students’ achievement is located at L1.
1 means, inversely, that students within a classroom do not differ in their achievement, but rather that the total variance in students’ achievement is located at L2 and L3.
A major challenge when designing a CRT is to ensure adequate precision (i.e., small standard errors) for any estimated intervention effects. It is well-documented that vital covariates (e.g., pretest scores or sociodemographic characteristics) may significantly raise the precision of randomized experiments (e.g., Bloom et al., Citation2007; Hedges & Hedberg, Citation2007a, Citation2013; Konstantopoulos, Citation2012; Raudenbush, Citation1997; Raudenbush et al., Citation2007). Covariates remove noise in the variance of an outcome measure (i.e., reduce ), which improves the signal of the intervention effect (Raudenbush et al., Citation2007, p. 18). Although not necessary for validity, covariates can operate in CRTs at various hierarchical levels. When covariates explain a substantial proportion of variance in an outcome (in particular at higher levels), they are an efficient way to improve statistical power and precision, and thus reduce the required sample sizes and therefore the cost of CRTs (Bloom et al., Citation2007; Konstantopoulos, Citation2012; Raudenbush, Citation1997).
The explained variance at L1 is computed as
(3)
(3)
at L2 as
(4)
(4)
and at L3 as
(5)
(5)
Here,
and
are the covariate-adjusted within-classroom variance at L1, within-school variance at L2, and between-school variance at L3, respectively.
and
denote a set of covariates introduced at L1, L2, and L3, respectively. Typically, multilevel modeling is applied to estimate the variance components
and
as well as the covariate-adjusted variance components
and
(for further details, see Supplemental Online Material A on the Open Science Framework at https://osf.io/2w8nt). Of note,
and
may include covariates assessed at L1 which are aggregated to L2 and/or L3 (e.g., the classroom and school mean of a pretest) as well as covariates assessed only at L2 (e.g., class size) or L3 (e.g., school size). Note that aggregated L1 covariates should be entered as group-mean centered variables in the multilevel models. Doing so ensures that the covariates explain variance only at the level at which they are specified (Konstantopoulos, Citation2008a, Citation2012). Consequently, the
values (that may vary between 0 and 1) quantify the proportions of the variances observed at each level that can be explained by a certain set of covariates at the corresponding level.
The values for the design parameters and
at each level are entered into power calculations to determine the number of students, classrooms, and schools that are needed to achieve a certain minimum detectable effect size (
Bloom, Citation1995). The
can be described as the smallest true intervention effect that a study design could detect with confidence (Jacob et al., Citation2010) and thus is a measure of the precision of a CRT (Bloom, Citation2005). In formal terms, the
is defined as the smallest possible standardized intervention effect that can be detected in a study of a certain sample size with, by convention, a power of
0.80 and a significance level of
0.05 in a two-tailed test (Bloom et al., Citation2008). Since the
is standardized with respect to the total student-level standard deviation in the outcome, it can be conceived as a standardized effect size measure. For instance, an
of 0.25 implies 80% power to detect an intervention effect on the outcome measure of one quarter of the total student-level standard deviation (Bloom et al., Citation2007).
The size of the depends on the type of CRT. Assuming no covariates and equal variances for the treatment and control group, the
of a three-level CRT with treatment assignment at L3 is calculated as follows (see Bloom et al., Citation2008, Equation [2]):
(6)
(6)
where
is the harmonic mean number of students per classroom,
is the harmonic mean number of classrooms per school, and
is the total number of schools. The multiplier
is a function of the t-distributions specific to
and
for the applied test procedure (i.e., one- or two-tailed) with
degrees of freedom (for details, see Bloom, Citation2005, pp. 158–160). For example, when 20 or more schools are randomly assigned to both the treatment and the control condition (i.e.,
40),
equals approximately 2.8 (Bloom et al., Citation2008). Finally,
represents the proportion of schools assigned to the treatment group. From EquationEquation (6)
(6)
(6) , it becomes clear that the
increases with growing values of
Adding covariates yields an adjusted (see Bloom et al., Citation2008, Equation [3]):
(7)
(7)
with
degrees of freedom where
is the number of L3 covariates. Given that
and
are fixed values, adding covariates (especially at higher levels), as shown in EquationEquation (7)
(7)
(7) , leads to a lower
or in other words, a higher precision of the CRT.
The formula for the adjusted of a three-level multisite or blocked CRT (MSCRT; e.g., Konstantopoulos, Citation2008b; Raudenbush & Liu, Citation2000), where treatment assignment occurs at L2 subclusters (e.g., classrooms) within L3 clusters (serving as sites or blocks; e.g., schools), is given in Dong and Maynard (Citation2013, pp. 53–55):
(8)
(8)
where
is the effect size variability at L3 (i.e., the heterogeneity of the intervention effect
across schools) with
denoting the between-school variance in
Further,
is defined as the proportion of
that can be explained by covariates at L3:
where
is the covariate-adjusted effect size variability at L3. If
is considered to be constant across schools (as represented by a fixed effect),
and
equal zero and thus, the first term within the square root (i.e.,
) vanishes and is dropped from EquationEquation (8)
(8)
(8) . In this fixed effect scenario,
becomes
where
is the number of L2 covariates. If
is considered to vary across schools (as represented by a random effect),
is
1. As in the computation of the unadjusted
for CRTs, the values for
and
equal zero (and are therefore dropped from EquationEquation [8]
(8)
(8) ) when no covariates are used.
Previous Empirical Research on Multilevel Design Parameters
A critical question that any educational researcher faces when performing power analyses is which values of and
at each hierarchical level should be entered in the equations presented above. Unfortunately, many applied researchers (still) draw on conventional guidelines: For example, they interpret values of
0.01 as “small,”
0.10 as “medium,” and
0.25 as “large” (LeBreton & Senter, Citation2008, p. 838). These guidelines, though, were proposed as “operational definitions,” with the strong recommendation to use better estimates whenever possible—“better” means that they should match the target population, hierarchical level, and outcome measure of the study (e.g., Cohen, Citation1988, pp. 12–13 and 534; Lipsey et al., Citation2012, p. 4). Thus, what do we know about design parameters at the various levels for student achievement?
International Research
First, in the United States, the body of knowledge on design parameters has substantially expanded in recent years (cf. Spybrook, Citation2013; Spybrook & Kelcey, Citation2016), especially for the core achievement domains mathematics, science, and reading. summarizes design parameters based on U.S. samples as reported in previous research.
Figure 1. Results from previous research on multilevel design parameters for student achievement in elementary and secondary school in the United States: (a) Between-classroom () and between-school differences (
), and explained variances by (b) pretest scores, (c) sociodemographic characteristics, and (d) pretest scores and sociodemographic characteristics at the student (
), classroom (
), and school level (
). Note. Boxplots show distributions across all domains. The distributions in mathematics/science/reading are based on 341/12/370 values for elementary school (grades 1–6) and 266/93/223 values for secondary school (grades 7–12). The underlying data table can be obtained from the Open Science Framework (https://osf.io/2w8nt). In the upper panels of , design parameters obtained from two-level models (students at L1 within schools at L3) are shown as reported in the following studies: Bloom et al. (Citation1999) reported
for elementary schools in 1 city. Bloom et al. (Citation2007) reported
and
for pretests and sociodemographics for elementary and secondary schools in 5 districts. Brandon et al. (Citation2013) reported upper bounds of the means of
across several years for elementary and secondary schools in 1 state. Hedberg et al. (Citation2004) reported
and
for sociodemographics for elementary schools in 120 districts and for secondary schools on a nationwide basis (values are retrieved from Schochet, Citation2008). Hedges and Hedberg (Citation2007a) reported
and
for pretests, sociodemographics, and their combination for elementary and secondary schools on a nationwide basis (across districts and states). Hedges and Hedberg (Citation2013) reported
and
for pretests and sociodemographics for elementary and secondary schools in 11 states (with between-district variance pooled into between-school variance within states). Schochet (Citation2008) reported
for elementary schools based on 3 studies conducted in 6 cities, 12 districts, and 7 states, respectively. Spybrook, Westine, et al. (Citation2016) reported means of
and
across several years for pretests and sociodemographics for elementary and secondary schools in 3 states. Westine et al. (Citation2013) reported means of
and
across 5 years for pretests, sociodemographics, and their combination for elementary and secondary schools in 1 state. In the lower panels of , design parameters obtained from three-level models (students at L1 within classrooms at L2 within schools at L3) are shown as reported in the following studies: Jacob et al. (Citation2010) reported
and
for pretests, sociodemographics and their combination for elementary schools in 6 districts. Xu and Nichols (Citation2010) reported
and
for pretests, sociodemographics, and their combination for elementary and secondary schools in 2 states. Zhu et al. (Citation2012) reported
and
for pretests for elementary and secondary schools on a nationwide basis.
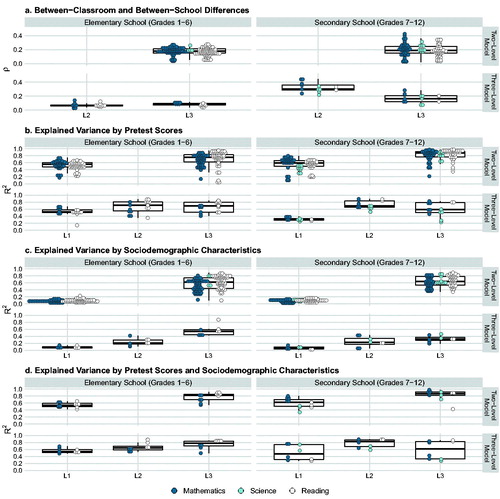
Second, it is evident from that most studies in the United States have catalogued design parameters that are relevant for planning two-level CRTs (i.e., students within schools; see upper panels in ). Despite expected variation across samples, domains, and grade levels, this line of research indicates that the variance attributable to between-school achievement differences in the United States only occasionally exceeds a value of 0.25 (see ).
In contrast, few studies have compiled variance components for three-level designs (i.e., students within classrooms within schools; see lower panels in ). reveals that intraclass correlations at L2 vary by grade level. For instance, in the study by Zhu et al. (Citation2012), values of were usually smaller than 0.14 (with
0.10) in both mathematics and reading in elementary school. In secondary school, however, Zhu et al. (Citation2012) reported between-classroom differences within a range of 0.29
0.38 in tests related to mathematics and science (with 0.07
0.17). The authors argue that this increase in
probably reflects a more extensive student tracking within secondary schools than within elementary schools (Zhu et al., Citation2012, p. 53).
Third, a small number of studies outside the United States have investigated intraclass correlations focusing on between-school achievement differences. The study by Kelcey et al. (Citation2016) drew on representative samples of grade 6 students in 15 sub-Saharan African countries. Their results showed that between-school differences in mathematics and reading varied widely across countries (0.08 0.60). Zopluoglu (Citation2012) reanalyzed data from several cycles of the Trends in International Mathematics and Science Study (TIMSS) and Progress in International Reading Literacy Study (PIRLS) and found that
varied considerably across countries in mathematics, science and reading. For example, in the year 2007 cycle of TIMSS, the average intraclass correlation at L3 in mathematics was
0.27 across 44 countries (
0.14, 0.07
0.62) in grade 4, and
0.31 across 57 countries (
0.14, 0.03
0.65) in grade 8. Similar results were found for science and reading. Finally, capitalizing on five cycles of the Programme for International Student Assessment (PISA) with representative data from 15-year-old students from 81 different countries and economies, Brunner et al. (Citation2018) found large international variation in between-school achievement differences with median values of
lying around 0.40 (ranging from 0.10 to over 0.60). In sum, these results from international studies clearly show that design parameters obtained for the United States do not generalize well to the large majority of other countries. For instance, the analyses by Brunner et al. (Citation2018, p. 21) reveal that in about 80% of the countries that participated in PISA, achievement differences at L3 are (much) larger than those typically found for U.S. schools.
Fourth, pretest scores have proven to be highly powerful in explaining variance in students’ achievement at all levels (e.g., Bloom et al., Citation2007; Hedges & Hedberg, Citation2007a; Westine et al., Citation2013; Zhu et al., Citation2012; see ). For example, in the study by Zhu et al. (Citation2012, p. 66, Table A1), median values for the proportions of variance explained by pretests were 0.59,
0.72, and
0.52.
Table 1. Results from previous large-scale studies on student achievement in Germany: Between-classroom () and between-school differences (
) by grade and domain.
Fifth, as a rule, sociodemographic characteristics (i.e., as typically represented by a covariate set comprising socioeconomic status, gender, and migration background) explain a smaller proportion of variance in students’ achievement at L1, and a larger proportion at L3. As shown in , in the United States (e.g., Bloom et al., Citation2007; Hedges & Hedberg, Citation2013; Spybrook, Westine, et al., Citation2016), values of typically lie in the range of 0.42–0.79. The corresponding average values of
typically lie around 0.10. This general pattern of results was also found for sub-Saharan countries in the study by Kelcey et al. (Citation2016) as well as in the analyses of Brunner et al. (Citation2018) for 81 countries participating in PISA. Notably, these international studies also demonstrated that achievement differences adjusted for sociodemographics varied widely across countries. For example, values of
for reading ranged between 0.18 and 0.89 across countries (Brunner et al., Citation2018).
To the best of our knowledge, only Jacob et al. (Citation2010) and Xu and Nichols (Citation2010) have provided empirical estimates of for the application of sociodemographic covariates. Drawing on data from 3rd graders, Jacob et al. (Citation2010) reported that sociodemographics explained 42%/20% of the variance located at L2 for mathematics/reading achievement. In the investigation of Xu and Nichols (Citation2010) the proportions of explained variance at L2 varied by state, domain, and grade level: The values for
in elementary school were between 0.11 (mathematics; Florida) and 0.32 (reading; North Carolina), and in secondary school between 0.05 (mathematics; Florida) and 0.44 (geometry; North Carolina).
Sixth, drawing on data from the United States for K–12th graders, Hedges and Hedberg (Citation2007a) found that sociodemographics provided (almost) no incremental gain in explaining variance in mathematics and reading at either L1 or L3, once pretests were controlled for at these levels. However, the analyses of Jacob et al. (Citation2010, Table 2) as well as Xu and Nichols (Citation2010, Table NC-7) suggest that sociodemographics may contribute to the prediction over and above pretests, especially at L2 (see ).
Table 2. Number of students (L1), classrooms (L2), and schools (L3), and median cluster sizes by grade, large-scale study, and school track.
Research in Germany
To date, design parameters for student achievement in Germany have typically been reported in the context of research on educational effectiveness or social inequalities, mainly as ancillary results. Hence, the knowledge base is scattered and design parameters for Germany have not been systematically summarized. provides an overview of intraclass correlations as reported in several key German large-scale studies.
The following results are noteworthy in : First, intraclass correlations were only available at L3 for the majority of studies, and these differed markedly between elementary school and secondary school. Elementary school values of lay between 0.15 and 0.27, whereas secondary school values of
lay between 0.41 and 0.62. In the very few studies where intraclass correlations at L2 were reported, they appeared rather small (with
0.04) compared to between-school differences. Finally, the many empty cells in demonstrate that the existing empirical research on design parameters for German schools is limited to selected hierarchical levels, achievement domains, and grades.
Second, as in most countries, the amount of variance explained by sociodemographics differs substantively between levels in Germany. For example, in the reanalysis of data from five PISA cycles by Brunner et al. (Citation2018), the average proportion of L1 variance explained by socioeconomic status, gender, and migration background was 0.09/0.09/0.10 for German students’ achievement in mathematics/science/reading. On the other hand, the respective average proportion of explained L3 variance was
0.75/0.77/0.77. Similar patterns of results were also found in other studies (Baumert et al., Citation2003; Knigge & Köller, Citation2010). Of note, to the best of our knowledge, multilevel models have not yet been used to decompose the variance that can be explained by pretests at L1, L2, and L3 for German schools.
Third, the design parameters reported in refer to the general (i.e., total) student population. At Germany’s elementary level, there is only a single type of elementary school across all 16 federal states (“Grundschule”; up to grade 4 in most German federal states). However, at the secondary level, Germany’s school system is characterized—like many other countries (Salchegger, Citation2016)—by tracking into different school types that cater to students with different performance levels. Typically, five major school types are distinguished in large-scale studies: the academic track school (“Gymnasium”; up to grade 12 or 13), vocational school (“Hauptschule”; up to grade 9 or 10), intermediate school (“Realschule”; up to grade 10), multitrack school (“Schulen mit mehreren Bildungsgängen”; up to grade 9, 10, 12, or 13), and comprehensive school (“Gesamtschule”; up to grade 12 or 13). Notably, all federal states offer schools in the academic track but they vary with respect to the other school types. In the remainder of this article, we will therefore subsume the latter four school types under the umbrella term “non-academic track” to describe this broad class of schools.
Importantly, when statistically controlling for mean-level differences between school types in secondary education (e.g., by introducing school type as a L3 covariate), may decrease markedly. For instance, Baumert et al. (Citation2003, p. 270) found that around 47%/45% of the total variance in mathematics/reading achievement of 9th graders were accounted for by differences between school types whereas 7%/12% were attributable to differences between schools of the same type; the remaining 46%/43% were attributable to differences between students within schools. Drawing on data from the German federal state North Rhine-Westphalia, Baumert et al. (Citation2003) also delineated that the amount of variance attributable to school types may increase with higher grades, while the amount of variance attributable to differences between schools of the same type decreases. In summary, these results for the German school system have two implications: First, school types are an important feature of the German school system that explain a substantial proportion of between-school differences in students’ achievement and, second, design parameters obtained for certain grades cannot be easily generalized to other grades.
The Present Study
Multilevel design parameters that are tied to the target population, hierarchical level, and outcome measure are indispensable for designing CRTs on student achievement with sufficient statistical power and precision. However, our literature review showed that the corresponding empirical knowledge base is limited in several ways: First, existing compendia of design parameters are based almost exclusively on U.S. samples, whereas the body of knowledge is rather weak for Germany and other countries with similar school systems. Second, most previous research on design parameters focused on two-level structures (i.e., students within schools), but little research has been done using three-level analyses yielding classroom-level estimates in the United States and elsewhere. Third, design parameters are most frequently available for the core achievement domains mathematics, science, and reading. Yet, contemporary educational curricula go far beyond these core domains (National Research Council, Citation2011; OECD, Citation2018): They cover a multifaceted skills portfolio including, for instance, verbal skills in foreign languages and domain-general skills such as information and communication technology literacy and problem solving. Although cognitive outcomes of different domains are correlated, their unique characteristics may introduce considerable variation in design parameters and, therefore, in the required sample sizes for CRTs (see Westine et al., Citation2013). Finally, it is important to quantify the statistical uncertainty associated with empirically estimated design parameters due to sampling error (Hedges et al., Citation2012). To date, standard errors or confidence intervals have rarely been reported for and
at L1 and L3 (Hedges & Hedberg, Citation2007a, Citation2007b, Citation2013; Jacob et al., Citation2010) and, as far as we are aware, never at L2.
The present study directly addresses these research gaps. Specifically, this is the first study to rigorously investigate design parameters and their standard errors (I) based on rich, large-scale data from German samples spanning the entire school career (grades 1–12), (II) for three- as well as two-level designs, and (III) for a very wide array of achievement domains. Following prior work (e.g., Bloom et al., Citation2007; Hedges & Hedberg, Citation2007a, Citation2013; Westine et al., Citation2013), we use pretest scores and sociodemographic characteristics as covariates at each level to determine the increase in the precision of CRTs when estimating causal effects on student achievement. We analyze three-level design parameters (i.e.,
and
) and two-level design parameters (i.e.,
and
) for the general student population. Given that tracking is a key characteristic of the secondary school system in Germany and many other school systems around the world (Salchegger, Citation2016), we additionally estimate design parameters both by adjusting them for mean-level differences in achievement between school types as well as separately for the academic and non-academic track. Finally, we illustrate how the present design parameters can be applied in power analysis in the planning phase of CRTs.
Method
Large-Scale Assessment Data
This study drew on several national probability samples from three German longitudinal large-scale assessments: the National Educational Panel Study (NEPS; Blossfeld et al., Citation2011), the Assessment of Student Achievements in German and English as a Foreign Language (DESI; DESI-Konsortium, Citation2008), and the longitudinal extension of the year 2003 cycle of the Programme for International Student Assessment (PISA-I-Plus 2003, 2004 [PISA-I+]; PISA-Konsortium Deutschland, Citation2006). NEPS is an ongoing complex multi-cohort study on the interplay of student achievement, educational processes, and life outcomes across the lifespan. We analyzed data from students attending grades 1–12 using the starting cohorts (SC) 2, 3, and 4. DESI investigated the development of first (i.e., German) and foreign language (i.e., English) achievement during grade 9. PISA-I+ focused on the development of mathematics and science achievement from grade 9 to 10 and additionally contains assessments of reading and problem solving in grade 9.
All studies followed a multistage sampling procedure. In NEPS-SC3 and -SC4, as well as in DESI and PISA-I+, two entire classrooms per school were randomly drawn (Aßmann et al., Citation2011; Beck et al., Citation2008; Prenzel et al., Citation2006). For NEPS-SC2, the sample did not consist of intact classrooms but rather was representative of children entering elementary school (Aßmann et al., Citation2011).
Our analysis sample of NEPS-SC2 included students who took part in the study in grade 1. It was composed of two subsamples: students who started participating as 4-year-old kindergarten children (school year 2010/11, wave 1) and a refreshment sample of 1st graders (2012/13, wave 3), both providing data up to grade 4 (2015/16, wave 6). The analysis sample of NEPS-SC3 comprised students from grade 5 (2010/11, wave 1) up to 9 (2014/15, wave 6) and, again, included two subsamples: 5th graders of wave 1, and a refreshment sample of grade 7 students (2012/13, wave 3). For NEPS-SC4, we analyzed data from students from grade 9 (2010/11, wave 1) up to 12 (2013/14, wave 7). For DESI, we analyzed data of the full student sample at the outset (wave 1) and end (wave 2) of grade 9 in 2003/04. The analysis sample of PISA-I+ covered students from grade 9 (2002/03, wave 1) up to 10 (2003/04, wave 2). Datasets for each large-scale study and grade consisted of those students who participated in the studies in the respective grade and for whom the exclusion criteriaFootnote2 did not apply. contains detailed information on sample sizes by grade, large-scale study, and school track. The sample sizes varied from 3,963 students from 168 schools (NEPS-SC4, grade 12) and
14,640 students in 975 classrooms in 518 schools (NEPS-SC4, grade 9). Notably, no sample from the three large-scale studies comprises 8th grade students as achievement tests were not conducted in this grade. Furthermore, in the German school system, the majority of 11th and 12th graders are not grouped in intact classrooms, but rather attend courses that are specific to the subject taught at different ability levels (e.g., basic and advanced courses). Information on classroom affiliation in grades 11–12 consequently did not exist.
Measures
Achievement Outcomes
We examined a broad spectrum of domain-specific and domain-general achievement measures (for a comprehensive overview, see Table A5 in the Supplemental Online Material A). The datasets included data at L1 in various domains: mathematics, science, specific verbal skills in German as a first language (reading comprehension, reading speed, spelling, grammar, vocabulary, writing, argumentation, listening), and specific verbal skills in English as a foreign language (reading comprehension, text reconstruction, language awareness, writing, listening). Likewise, we investigated domain-general areas: declarative metacognition, information and communication technology, problem solving, and basic cognitive functions (perception speed, reasoning).
Assessments were conducted in all grades from 1 to 12 except grade 8. All tests were administered using a paper-and-pencil format. Test scores were provided either as weighted likelihood estimates (WLE; Warm, Citation1989) that were derived from item-response models, or as sum or mean scores that were computed by the number of correctly solved items.
Pretest Scores
For each outcome measure, we used the corresponding previously-collected domain-identical achievement score as predictor, if available. If there were multiple pretests from different years for a certain domain, we selected the pretest with the smallest time lag between pre- and posttest. When studying mathematics, science, and German vocabulary and grammar as outcomes in grade 1, and basic cognitive functions in grade 2, we included the corresponding pretests that were assessed in kindergarten (waves 1 and 2 of NEPS-SC2). If no domain-identical pretest was available, we used predictors that were conceptually related to the target outcome (so-called “proxy” pretests; Shadish et al., Citation2002, p. 118; see Table A6 in the Supplemental Online Material A). However, some grade-specific achievement outcomes did not have any relevant pretest available.
Sociodemographic Characteristics
We used four sociodemographic characteristics as covariates. Specifically, we used two measures of socioeconomic status, including the highest International Socio-Economic Index of Occupational Status within a family (HISEI; Ganzeboom & Treiman, Citation1996) and an indicator of the highest educational attainment within the family. The highest educational attainment was based on the greatest number of years of schooling completed within a family (ranged between 9 and 18) for NEPS and PISA-I+ and the highest school-leaving qualification within a family (with 1 = no qualification up to 5 = “Abitur”) for DESI. Indicator variables were used to represent students’ gender (0 = male, 1 = female) and migration background (0 = no migration background, 1 = migration background).
Statistical Analyses
Missing Data
Missing data are an unavoidable reality in any large-scale assessment (for missing data statistics, see Tables A7–A11 in the Supplemental Online Material A). Across all datasets, the total percentage of missing values varied from 6% (NEPS-SC2, grade 3) to 32% (NEPS-SC2, grade 1). The highest missing rates occurred in pretests measured in the first two waves of NEPS-SC2, as only a small share of the kindergarten children continued participating in NEPS after entering elementary school. To deal with missing data we used (groupwise) multilevel multiple imputation and generated 50 multiply imputed datasets for each large-scale study and grade using the mice (van Buuren & Groothuis-Oudshoorn, Citation2011) and miceadds (Robitzsch et al., Citation2018) packages (for details, see Supplemental Online Material A).
Multilevel Models
Adapting the approach of Hedges and Hedberg (Citation2007a), we estimated four sets of three-level (i.e., students within classrooms within schools) and two-level (i.e., students within schools) multilevel latent (covariate) models (Lüdtke et al., Citation2008) with random intercepts for each grade and achievement outcome. Notably, all covariates were assessed at L1. The classroom and school means of these covariates were estimated by applying the default options for the latent multilevel modeling framework as implemented in Mplus 8 (Muthén & Muthén, Citation2017), and thus were entered as latent group means in the models. Doing so also implies that in the three-level models both L1 covariates and L2 means were “implicitly” centered at the respective classroom and school means (Muthén & Muthén, Citation2017, pp. 274–275).
Model set 1 was an intercept-only model that did not contain any covariates. Model set 2 was a pretest covariate(s) model that drew on the respective pretest scores (or proxy pretest scores, if necessary) as predictors at each level. Model set 3 was a sociodemographic covariates model that included at each level students’ socioeconomic status (i.e., HISEI and the highest educational attainment within the family), gender, and migration background. Model set 4 was a pretest and sociodemographic covariates model that combined the pretest covariate(s) model and the sociodemographic covariates model. All analysis models are specified in Equations (A13)–(A30) in the Supplemental Online Material A.
To estimate design parameters at L1, L2, and L3 for grades 1–10, we applied three-level modeling. For grades 11–12, we specified two-level models to estimate design parameters at L1 and L3 because German education in grades 11 and 12 is usually not organized within intact classrooms. As noted above, secondary students in Germany are tracked into different school types. We therefore also applied two different adjustments to model sets 1–4 to estimate design parameters in secondary education taking tracking into account. First, we adjusted the design parameters for mean-level differences in achievement between school types. To accomplish this, we added dummy-coded indicator variables representing the various school types as covariates at L3 in all multilevel models (see Table A12 in the Supplemental Online Material A). Second, we examined model sets 1–4 separately for the subpopulations of students in the academic and non-academic track.
Finally, we ran model sets 1–4 as two-level models for grades 1–10 for the general student population (both with and without adjusting for mean-level differences between school types), and separately for the academic and non-academic track. This approach allows us to provide design parameters at L1 and L3 that are appropriate for research lacking information at the classroom level.
Estimation of Design Parameters and Standard Errors
The analyses were conducted in three steps. First, model sets 1–4 were run separately for each large-scale study, grade, achievement outcome, and for each of the 50 imputed datasets in Mplus 8 (Muthén & Muthén, Citation2017) using the maximum-likelihood estimator with robust standard errors (MLR) which were computed based on a sandwich estimator.Footnote3 These analyses were run via R (R Core Team, Citation2018) using the MplusAutomation package (Hallquist & Wiley, Citation2018).
Second, the calculation of the design parameters and their standard errors was done in R (R Core Team, Citation2018) using the estimates obtained in the first step: We employed EquationEquations (1)(1)
(1) and Equation(2)
(2)
(2) to calculate
and
respectively, EquationEquations (3)
(3)
(3) , Equation(4)
(4)
(4) , and Equation(5)
(5)
(5) to calculate
and
respectively, as well as Equations (A18) and (A22) displayed in the Supplemental Online Material A to calculate school-type-adjusted values of
and
respectively. The standard errors of the
values were computed using the formulas for large sample variances in unbalanced three-level designs (i.e., with unequal cluster sizes) presented in Hedges et al. (Citation2012, Equations [7]–[9]), and the formula for the large sample variance in unbalanced two-level designs given in Donner and Koval (Citation1980, Equation [3]). The standard errors of the
values were calculated drawing on Hedges and Hedberg (Citation2013, p. 451).
Third, the design parameters and standard errors obtained in the second step were pooled across imputations using Rubin’s (Citation1987) rules in R (R Core Team, Citation2018) using the mitml package (Grund et al., Citation2019) to combine the estimates into a single set of results and to obtain standard errors that take into account within and between imputation variance. Of note, for grade 9, design parameters for the same achievement domain were available from several large-scale studies. We integrated these results in R (R Core Team, Citation2018) with the metafor package (Viechtbauer, Citation2010) and applied a meta-analytic fixed effects model to determine the average design parameter estimates across the grade 9 samples (Hedges & Vevea, Citation1998).Footnote4
Results
The complete compilation of multilevel design parameters, corresponding standard errors, and normative distributions are available in Tables B1–B16 in the Supplemental Online Material B on the Open Science Framework (https://osf.io/2w8nt; see also ). aggregates the results based on three-level (grades 1–10) and two-level (grades 11–12) models for the general student population (with and without adjustment for mean-level differences between school types), the academic track, and the non-academic track, yielding normative distributions of design parameters. visualizes the results for the general student population as well as the school-type-adjusted results at L3 by grade level and achievement domain.
Figure 2. Multilevel design parameters for student achievement for the general student population without and with adjustment for mean-level differences between school types: (a) Between-classroom () and between-school differences (
), and explained variances by (b) pretest scores, (c) sociodemographic characteristics, and (d) pretest scores and sociodemographic characteristics at the student (
), classroom (
), and school level (
). Note. Boxplots show distributions across all achievement domains. For grades 1–10, design parameters are based on three-level models (students at L1 within classrooms at L2 within schools at L3). For grades 11–12, design parameters are based on two-level models (students at L1 within schools at L3) as 11th and 12th grade students did not attend intact classrooms, but rather the grouping of students varied depending on the subject taught. This means that design parameters at L2 (i.e.,
and
) were estimated for grades 1–10 only. In , intraclass correlations
were estimated in intercept-only models (model set 1). In , explained variances
by pretests were estimated in pretest covariate(s) models (model set 2). In , explained variances
by sociodemographics were estimated in sociodemographic covariates models (model set 3). In , explained variances
by pretests and sociodemographics were estimated in pretest and sociodemographic covariates models (model set 4). To estimate design parameters that were adjusted for mean-level achievement differences between school types offered in German secondary education (L3 adjusted), dummy-coded indicator variables representing the various school types were added as additional covariates at L3. The complete collection of design parameters is available in Tables B1, B3, B5, B7, B9, B11, B13, and B15 in the Supplemental Online Material B on the Open Science Framework (https://osf.io/2w8nt).
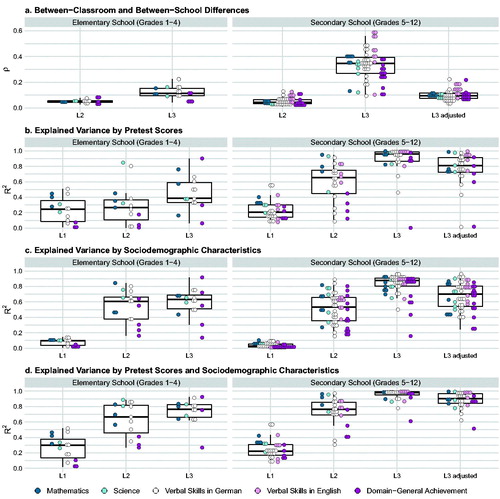
Table 3. Normative distributions of multilevel design parameters for student achievement: (a) Between-classroom () and between-school differences (
), and explained variances by (b) pretest scores, (c) sociodemographic characteristics, and (d) pretest scores and sociodemographic characteristics at the student (
), classroom (
), and school level (
).
Design Parameters for the General Student Population
The results obtained for the intercept-only models demonstrated substantial between-school differences in students’ achievement across grade levels and domains. As displayed in , values of were noticeably smaller in elementary (
(
)
0.11) than in secondary school (
(
) = 0.35; see also ). Moreover, achievement differences at L3 varied widely between outcome measures and grade levels, and even within grade levels (see and B1): In elementary school,
ranged from 0.04 (e.g., basic cognitive functions in reasoning, grade 2) to 0.22 (German vocabulary, grade 1), and in secondary school from 0.09 (German reading comprehension, grade 12) to 0.59 (English language awareness in grammar, grade 9). Compared to between-school differences, between-classroom differences were considerably smaller ranging from
0.03 (e.g., German grammar, grade 1) to
0.09 (basic cognitive functions in perception speed, grade 2) in elementary school (
(
) = 0.05), and from 0.01 (declarative metacognition, grade 9) to 0.13 (e.g., German reading speed, grade 5) in secondary school (
(
) = 0.04; see , and B1).
The results of the pretest covariate(s) models showed that pretest scores (including proxy pretests) explained substantial amounts of variance in students’ achievement at all hierarchical levels with median values of 0.21,
0.51, and
0.89 across elementary and secondary school (see Table B2). and reveal that the effectiveness of pretests in reducing variability in students’ achievement at L1 was relatively consistent across grade levels with
(
)
0.24/0.20 in elementary/secondary school. The explanatory power of pretests at L2 and L3, however, depended on the grade level: Pretests explained substantively larger proportions of L2 and L3 variance in secondary school (median values:
0.65,
0.96) than in elementary school (median values:
0.27,
0.39). The corresponding standard errors were exceptionally large in grade 1 (e.g., German grammar:
(
)
0.34,
(
)
0.32; see Table B1). The proportion of explained variance varied considerably across domains for all grade levels (0.01
0.56, 0.00
0.95, 0.00
1.00; see Table B2).
The results of the sociodemographic covariates models indicated that these student characteristics were in general very powerful predictors at L2 and L3 across grade levels (median values: 0.55,
0.85) but considerably less effective at L1 (
(
)
0.04; see Table B2). Again, we found a wide range in the amount of variance explained by sociodemographic characteristics across outcome measures (0.00
0.14, 0.16
0.89, 0.14
0.97; see Table B2). Broken down by grade levels as mapped in and , median values for
at L1/L2 were greater in elementary than secondary school with 0.10/0.61 and 0.03/0.53, respectively. At L3 explained variances were lower in elementary (
(
)
0.63) than in secondary school (
(
)
0.88) instead.
As evident from , the results of the pretest and sociodemographic covariates models suggested that pretests and sociodemographics may explain incremental amounts of variance in students’ achievement over and above each other (see also ): In secondary school, this was most noticeable at L2, where we observed a significant increase in the median value for of 0.12 relative to the pretest covariate(s) models. In elementary school, the respective gains were even larger at both L2 (
(
)
0.40) and L3 (
(
)
0.38). Averaged across grade levels, pretests plus sociodemographics could explain about 23% of the variance at L1, 75% at L2, and 95% at L3 (see Table B2).
Design Parameters With Adjustment for Mean-Level Achievement Differences Between School Types
When comparing the design parameters with and without adjustment for mean-level achievement differences between secondary school types, we observed several key results (see and ). First, when adjusting for mean-level differences, intraclass correlations at L2 were slightly larger (0.02 0.18,
(
)
0.06) whereas intraclass correlations at L3 were considerably smaller (0.03
0.22;
(
)
0.10). Second, the results obtained for the adjusted pretest covariate(s) models showed that the explanatory power of pretests remain roughly the same at L1 and L2 with median
values of 0.21 and 0.63, respectively, but that it was decreased at L3 (
(
)
0.81). Third, the pattern of results from the adjusted sociodemographic covariates models largely mirrored the results of the unadjusted pretest covariate(s) models. Fourth, in the adjusted pretest and sociodemographic covariates models, median amounts of explained variance remained unchanged at L1/L2 (22%/77%), but were slightly decreased at L3 (90%).
Design Parameters for the Academic and Non-Academic Track
The following major findings emerged from the analyses performed separately for the academic track and the non-academic track (see ). First, the results of the intercept-only models showed that between-classroom differences in students’ achievement for the academic (0.01 0.21;
(
)
0.05) and non-academic track (0.01
0.15;
(
)
0.06) were very similar. However, median proportions of achievement differences located at L3 were found to be smaller in the academic than non-academic track, with 6% (ranging between 0.01
0.23) and 20% (ranging between 0.07
0.36), respectively. Second, the results of the pretest covariate models demonstrated that pretests explained on average about the same amount of variance at L1/L2 in both tracks (20%/approximately 63%). The amount of variance explained at L3, however, was smaller in the academic track (
(
)
0.68) than the non-academic track (
(
)
0.88). Third, the pattern of results from the sociodemographic covariates models mirrored those obtained from the pretest covariate(s) models. Fourth, the results obtained from the pretest and sociodemographic covariates models revealed that the amount of incremental variance explained by either the pretests or sociodemographics differed only marginally between the academic and non-academic track at all levels.
Design Parameters for Two-Level Versus Three-Level Designs
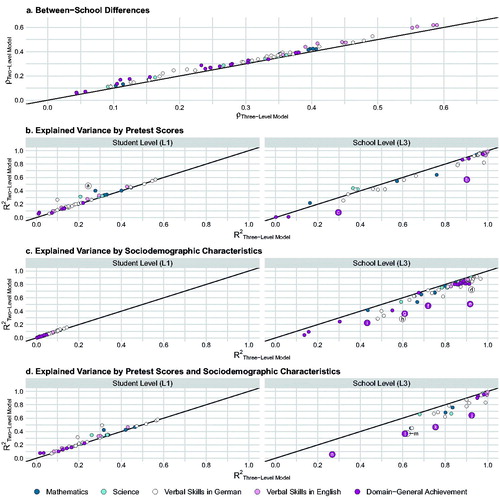
We additionally studied design parameters and standard errors for student achievement assuming only a two-level structure (i.e., students within schools) for grades 1–10 to simulate situations where no classroom-level information is available. Concerning the (unadjusted) results obtained for the general student population, values for and
are highly similar between two- and three-level designs, as clearly seen in , indicating that information at L2 barely affects the design parameters. On the other hand, applying two-level instead of three-level models underestimated the values for
in several cases, sometimes considerably. Similar patterns of results were observed when these comparisons were performed for the adjusted and track-specific design parameters (see Figures A1–A3 in the Supplemental Online Material A).
Figure 3. How much bias may result in design parameters for student achievement for the general student population at the student (L1) and school level (L3) when the classroom level (L2) is ignored? Comparison of corresponding design parameters obtained from three-level models versus two-level models: (a) Between-school differences (), and variances explained by (b) pretest scores, (c) sociodemographic characteristics, and (d) pretest scores and sociodemographic characteristics at the student (
) and school level (
). Note. The graph juxtaposes corresponding design parameters estimated by three-level models (x-coordinate; students at L1 within classrooms at L2 within schools at L3) with design parameters estimated by two-level models (y-coordinate; students at L1 within schools at L3). The black line marks congruence of three- and two-level design parameters. Larger labeled dots exceed a deviation of ± 0.20 between three- and two-level design parameters. For example, in , left grid (“Student Level (L1)”), the dot labeled with “a” (representing German vocabulary in grade 1) shows that
was 0.24 when specifying a three-level pretest covariate model, whereas
was 0.47 when specifying a two-level pretest covariate model. aVocabulary (NEPS-SC2, grade 1). bDeclarative metacognition (NEPS-SC2, grade 3). cBasic cognitive functions: Reasoning (NEPS-SC2, grade 2). dReading speed (DESI, grade 9, wave 2). eDeclarative metacognition (NEPS-SC2, grade 1). fDeclarative metacognition (NEPS-SC2, grade 3). gBasic cognitive functions: Perception speed (NEPS-SC3, grade 9). hReading speed (NEPS-SC2, grade 2). iBasic cognitive functions: Perception speed (NEPS-SC3, grade 5). jDeclarative metacognition (NEPS-SC2, grade 3). kBasic cognitive functions: Reasoning (NEPS-SC2, grade 2). lBasic cognitive functions: Perception speed (NEPS-SC3, grade 9). mReading speed (NEPS-SC2, grade 2). nBasic cognitive functions: Perception speed (NEPS-SC2, grade 2).
Applications
This section discusses three research scenarios to illustrate how the design parameters and their standard errors that we provided in this article can be used in power analyses to plan CRTs (and MSCRTs) on student achievement. can help researchers select an appropriate set of design parameters as a function of key characteristics of the planned intervention. For each scenario, we assumed that classrooms or schools would be randomly assigned to the experimental conditions in equal shares (i.e., 50% of the target [sub]clusters obtain the educational treatment, and the remaining 50% represent the control group; P = 0.50). Further, we assume a two-tailed test with a significance level of 0.05 and set the desired power at 80% (
0.80). A constitutive step when planning CRTs is to define a reasonable value for the
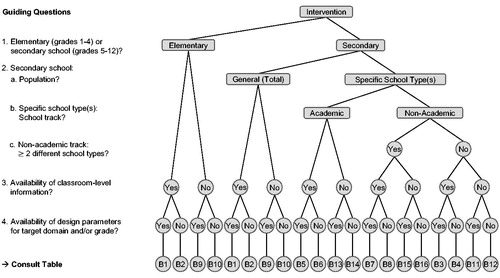
this decision can take into account political, economic, and programmatic perspectives or a combination thereof (see Bloom, Citation2006; Brunner et al., Citation2018; Schochet, Citation2008, for thorough discussions). We used the package PowerUpR (Bulus et al., Citation2019) in R (R Core Team, Citation2018) for the calculations.
Figure 4. Flow chart to guide the choice of design parameters as a function of key characteristics of the target intervention. Note. Tables B1–B16 can be retrieved from Supplemental Online Material B. A comprehensive overview of the achievement measures analyzed in the present study is given in Table A5 in the Supplemental Online Material A. The Supplemental Online Materials are available on the Open Science Framework (https://osf.io/2w8nt).
Scenario 1: How Many Schools Are Required for a CRT?
Research Team 1 would like to conduct a three-level CRT on the effectiveness of a school-wide intervention to improve 4th graders mathematical achievement. Team 1 plans to sample 3 classrooms with
20 students per classroom from every school. The researchers are interested in
the number of schools necessary to detect a typical intervention effect on student achievement. According to the research synthesis by Hill and colleagues (Citation2008), the mean standardized effect size for intervention effects on student achievement ranges between 0.20
0.30 across domains and grade levels. Thus, Team 1 choses a target intervention effect size of
0.25. After consulting , Team 1 chooses Table B1 containing the appropriate estimates of design parameters for their study. According to this table, the intraclass correlations at L2 and L3 for mathematics in grade 4 were
0.05 and
0.10, respectively. As recommended in Hedges et al. (Citation2012) and Jacob et al. (Citation2010), the researchers want to take into account the statistical uncertainty (due to sampling error) associated with these point estimates. Team 1, therefore, determines the lower and upper bound estimates for
by computing the 95% confidence interval of
and
using their standard errors of
(
)
(
)
0.02 (see Table B1). The lower bound of the 95% confidence interval of
is thereby computed as 0.05
1.96
0.02
0.01 and the upper bound as 0.05
1.96
0.02
0.09. Analogously, the 95% confidence interval of
equals 95% CI [0.06, 0.14]. When using these values for the power calculations, Team 1 needs
42 schools for the lower bound estimates,
68 schools for the point estimates, and
94 schools for the upper bound estimates of
To improve statistical precision, Team 1 plans to assess pretest scores and to use them as covariates. As listed in Table B1, the explained variances and corresponding standard errors for a mathematics pretest were 0.40 (
0.01),
0.35 (
0.04), and
0.76 (
0.03). These values yield a lower bound estimate for
of 0.40
1.96
0.01
0.38 and an upper bound estimate for
of 0.40
1.96
0.01
0.42. Likewise, the 95% confidence intervals of
and
are 95% CI [0.27, 0.43] and 95% CI [0.70, 0.82], respectively. Hence, when including a pretest and using the point estimates of
and
the required number of schools is
28 for the lower bound estimates,
24 for the point estimates, and
20 for the upper bound estimates of the
values.
When opting for a conservative approach, Team 1 should use the upper bound estimates of and the lower bound estimates of
at each hierarchical level (i.e.,
0.09,
0.14,
0.38;
0.27;
0.70), resulting in a required number of schools of
38. Of note, if Team 1 employed pretests as well as sociodemographic characteristics as covariates, the required number of schools would decrease significantly (
26, when using the upper bound estimates of
and lower bound estimates of
at each level). In conclusion, Team 1 should carefully balance the cost of additionally assessing sociodemographics against the cost of sampling a larger number of schools to achieve an equal level of precision (see Schochet, Citation2008).
Scenario 2: Which MDES Is Attainable for a CRT?
Suppose that research Team 2 plans a three-level CRT to study the impact of an intervention that is intended to affect students’ history achievement in comprehensive schools (grades 5–12). Due to budgetary constraints (see Spybrook, Shi, et al., Citation2016), a fixed maximum number of 40 schools (with
2 classrooms, and
20 students each) are at the researchers’ disposal. Given these limits, the primary concern of Team 2 is to ensure that the attainable
lies within the range of typical intervention effects on student achievement (i.e., 0.20
0.30; Hill et al., Citation2008). Team 2 consults to find the suitable table of design parameters. Since the intervention is targeted at a single, specific school type within the non-academic track, Team 2 uses the design parameters that are adjusted for mean-level differences between school types. Moreover, since design parameters for history are not available, Team 2 consults Table B4 outlining the normative distributions across the various achievement domains to determine small (i.e., 25th percentile [P25]), medium (i.e., median), and large values (i.e., 75th percentile [P75]) of the design parameters. Entering the respective values for the intraclass correlations (P25:
0.04,
0.08; median:
0.06,
0.10; P75:
0.09,
0.12; see Table B4), Team 2 learns that the attainable
is 0.32/0.35/0.39 for small/medium/large values of
and
Including both pretests and sociodemographics as covariates (P25:
0.17,
0.70,
0.84; median:
0.22,
0.77,
0.90; P75:
0.31,
0.86,
0.97; see Table B4) and using the 75th percentiles of the values for
and
(as more conservative upper bounds), the respective values for the
reduce to 0.20/0.18/0.14 for small/medium/large values of
at the various levels. Consequently, Team 2 can be quite confident that their CRT design offers sufficient sensitivity to detect a true intervention effect within the desired range when including both pretests and sociodemographics.
Scenario 3: How Many Schools Are Required for an MSCRT?
Research Team 3 would like to study the effects of a new teaching method involving learning software developed to enhance grade 9 students’ English listening comprehension skills in the academic track. Due to practical constraints (e.g., limited availability of computers in the schools), classrooms within schools (serving as sites or blocks) are randomly assigned to experimental conditions, making this design a three-level MSCRT. Since most academic track schools have at least four 9th grade classrooms of at least 20 students each, Team 3 plans to have 4 and
20. Team 3 considers an intervention effect of
0.10 policy-relevant (see Bloom, Citation2006; Bloom et al., Citation2007; Brunner et al., Citation2018; Schochet, Citation2008). Since the goal of Team 3 is to generalize the study findings to the population of German academic track schools beyond those sampled for their MSCRT, they treat the school effects as random (Bloom et al., Citation2017; Bloom & Spybrook, Citation2017; Spybrook & Raudenbush, Citation2009). Recall, this requires a reasonable assumption on the estimate of the cross-site effect size variability
According to Weiss et al. (Citation2017), the values for the standard deviations of standardized intervention effects across schools often range between 0.10
0.25. Since schools in the academic track form a comparatively homogeneous sample, Team 3 assumes that
0.15, that is
0.02. Team 3 consults and chooses Table B5 for the appropriate design parameters. Team 3 draws on the estimates that were meta-analytically pooled across 9th grade samples, with
0.19 and
0.07 (see Table B5). Under these conditions and in the absence of covariates,
181 schools are necessary to detect an intervention effect of
0.10, if it exists. To raise statistical precision, Team 3 intends to assess vital sociodemographics. The researchers enter the meta-analytically pooled
values at L1 and L2 given for the sociodemographic covariates models in the power calculations (
0.01,
0.72; see Table B5). A particular challenge is to define the amount of variance in
that can be explained by L3 covariates because empirical guidance on values for
is scarce. According to Schochet et al. (Citation2014) as well as Weiss et al. (Citation2014), site-level covariates may explain a substantial proportion of
Nevertheless, as can be derived from EquationEquation (8)
(8)
(8) , when
and
are rather small,
has a negligible effect on statistical power and precision, and thus, on the required number of schools. Opting for a conservative approach, Team 3 assumes that sociodemographics will explain considerably less variability in the intervention effect across schools compared to between-school differences in achievement (i.e., 1/10). Following this rationale, Team 3 estimates
0.10
0.87
0.10
0.09. Using sociodemographics as covariates at all levels decreases the required number of schools markedly to
74. Team 3 should therefore sample at least
74 schools (with
4 classrooms of
20 students each) and include vital sociodemographics in their study design in order to uncover a true intervention effect of
0.10 with confidence.
Discussion
CRTs on the effectiveness of large-scale educational interventions are valuable tools to inform evidence-based educational policies and practices (Institute of Education Sciences & National Science Foundation, Citation2013; Slavin, Citation2002; Spybrook, Shi, et al., Citation2016). When planning CRTs, educational researchers need reliable multilevel design parameters that match the target population, hierarchical level, and outcome domain to derive the number of students, classrooms, and schools needed to ensure sufficient statistical power to detect intervention effects. Capitalizing on data from three German longitudinal large-scale assessments, the present study provides three- and two-level design parameters (and respective standard errors) for student achievement across a very broad array of domains throughout the school career. This research expands the existing body of knowledge in three major dimensions.
(I) Expanding the Knowledge Base of Design Parameters to Germany
The large majority of previous research provided design parameters for the United States. We added design parameters based on German samples of 1st to 12th graders to this knowledge base. We observed the following key results:
First, for the general student population, we found substantially larger (unadjusted) between-school differences in achievement than those typically reported for U.S. samples. In our study, the average value of lay around 0.31, whereas in the United States
does not often exceed 0.25 (e.g., Bloom et al., Citation2007; Hedges & Hedberg, Citation2013; Spybrook, Westine, et al., Citation2016). This difference between schools in Germany and the United States corroborates the results of international studies pointing to a significant variation of
across countries (Brunner et al., Citation2018; Kelcey et al., Citation2016; Zopluoglu, Citation2012). Looking at different grade levels, however, yields a more differentiated picture. As mentioned before, the German school system is characterized by an early tracking into different school types that cater to students with different performance levels. In elementary school, the discrepancy between the results from the United States (with
(
)
0.18; see ) and the present German samples (with
(
)
0.11) was, therefore, considerably smaller than the discrepancy observed for secondary school. When German students were placed into different school types in secondary education, achievement differences at L3 were considerably smaller in the United States (
(
)
0.19; see ) than in Germany (
(
)
0.35). This finding supports previous results from German large-scale studies indicating that values of
are larger in secondary than in elementary school (see ). However, when adjusting for mean-level differences between school types or when conducting the analyses separately for schools in the academic or non-academic track, values of
dropped considerably. This observation is well-aligned with past research showing that school types explain a vast proportion of achievement differences between schools in Germany (Baumert et al., Citation2003).
Second, we replicated and extended the well-documented finding that covariates are a powerful way to increase statistical power and precision of CRTs in educational research. Specifically, we confirmed the discovery that pretest scores are highly effective in explaining variance, especially at higher levels (Bloom et al., Citation2007; Hedges & Hedberg, Citation2007a; Spybrook, Westine, et al., Citation2016). Overall, pretests explained about 21% of the variance at L1 and 89% of the variance at L3. We also observed substantial variation in the amounts of variance explained by pretests. Very low values of might be partly due to the application of proxy pretests in some instances. In line with previous research (e.g., Bloom et al., Citation2007; Hedges & Hedberg, Citation2013; Westine et al., Citation2013), we also found that the explanatory power of sociodemographic characteristics was quite strong at L3, but relatively weak at L1: While sociodemographics on average explained 85% of between-school variability in students’ achievement, the amount of variance explained at L1 was relatively low with an average of about 4%. Finally, sociodemographics contributed to the prediction of variance over and above pretests (and vice versa) at all levels. In our analyses, the combined covariate set, however, was markedly less effective at L1 than in studies in the United States, but more effective at L3. Divergences in the composition of variance components might explain this observation: Achievement differences at L1 are more pronounced in the United States than in Germany, leading to a better signal-to-noise ratio at L1 for U.S. samples, whereas the reverse pattern was found at L3, resulting in a better signal-to-noise ratio in Germany than in the United States (Raudenbush et al., Citation2007).
(II) Providing Three-Level Design Parameters and Standard Errors for the Student, Classroom, and School Level
Previous research has established a wealth of two-level design parameters (i.e., students within schools). Yet, little was known about classroom-level estimates within schools. Further, the statistical uncertainty associated with the design parameters (particularly those at L2) was rarely reported—although it is a decisive piece of information when conducting power analyses (Hedges et al., Citation2012; Jacob et al., Citation2010). To address these gaps, we fitted multilevel latent (covariate) models (Lüdtke et al., Citation2008) with three levels (i.e., students within classrooms within schools) whenever students were in intact classroom settings (i.e., for grades 1–10) and estimated standard errors for all design parameters. We observed the following key results:
First, in line with previous research from Germany (see ), between-classroom differences in students’ achievement were substantially smaller in size than between-school differences. In total, values for were around 0.05 and usually smaller than 0.13. These values appeared relatively stable across grade levels, but varied by domain to a certain degree. Overall, our results suggested markedly lower achievement differences at L2 than in the United States, especially in secondary school (elementary school in the United States:
(
)
0.07,
0.14; secondary school in the United States:
(
)
0.30,
0.45; Jacob et al., Citation2010; Xu & Nichols, Citation2010; Zhu et al., Citation2012).
Second, the explanatory power of both pretests and sociodemographics at L2 strongly varied as a function of achievement domain and grade level. Values for ranged from 0.00 to 0.95 for pretests, from 0.16 to 0.89 for sociodemographics, and from 0.27 to 0.97 when combining both covariate sets. Sociodemographics consistently contributed incremental amounts of variance to the prediction of students’ achievement over and above pretests (and vice versa), in particular at L2. These results align with those presented in Jacob et al. (Citation2010). Therefore, depending on the level of treatment assignment, collecting data on sociodemographics in addition to measuring baseline achievement appears to be a sound strategy to improve the precision of CRTs. Notably, the wide range observed for
and the corresponding standard errors may be attributable to estimation error caused by the very small size of certain variance components at L2 (Jacob et al., Citation2010, p. 177).
Third, we specified two-level models to assess the degree of bias when omitting information on the classroom-level cluster variance structure. In line with existing research addressing this question (Xu & Nichols, Citation2010; Zhu et al., Citation2012), we found negligible deviations between the intraclass correlations as estimated based on three-level versus two-level designs. Some values for were markedly higher in three-level than two-level models. As Xu and Nichols (Citation2010, pp. 28–29) described, the degree of bias should hinge on the degree of clustering in the outcome at L2: If there is substantial between-classroom variability, the omission of L2 can lead to severely biased design parameters at L1 and/or L3, and thus to erroneous results in power analyses. Our findings suggest that students’ achievement varied only to a small degree at L2 for most outcome measures. Thus, the present results suggest that ignoring the classroom-level variance and using two-level instead of three-level design parameters is unlikely to produce biased estimates from power analyses for the German school context, at least regarding intraclass correlations. Nevertheless, we recommend educational researchers to use three-level design parameters for sample size calculations whenever these parameters are available to obtain the most accurate results in power analysis for CRTs.
Fourth, capitalizing on data from three large-scale studies allowed us to achieve a satisfactory to high level of precision when estimating design parameters (in terms of small standard errors). A major exception was found in the large standard errors of the estimates for and
primarily in grade 1, obtained from the pretest covariate(s) models involving pretests assessed in kindergarten. The high percentage of missing values (over 90%) in these measures induced significant variation across the imputed datasets (i.e., between-imputation variance) resulting in large standard errors. When planning CRTs, we therefore recommend that researchers apply the provided values in their power analyses with caution (e.g., using conservative strategies as illustrated in the applications), or use both pretests and sociodemographics as covariates in grade 1 as we observed much smaller standard errors for design parameters in this case.
(III) Providing Design Parameters for a Very Broad Array of Achievement Domains
The bulk of previously presented design parameters were restricted to mathematics, science, and reading achievement. However, schools aim to foster a considerably broader spectrum of achievement domains. Thus, in addition to the core domains, we also estimated design parameters that have not previously been available, including specific verbal skills in student’s first language (i.e., German) and foreign languages (i.e., English), and domain-general measures such as declarative metacognition, information and communication technology, problem solving, and basic cognitive functions. We observed the following key results:
First, the present findings corroborate those from previous research stressing that design parameters do not generalize well across achievement (sub)domains (e.g., Spybrook, Westine, et al., Citation2016; Westine et al., Citation2013; Xu & Nichols, Citation2010). Specifically, median values of between-classroom and between-school differences were typically lower for domain-general achievement ( 0.04,
0.24) and science (
0.04,
0.29), and higher for verbal skills in English as foreign language (
0.07,
0.45) than for other domains (mathematics:
0.05,
0.35; verbal skills in German as first language:
0.05,
0.33).
Second, the present study showed that design parameters may even not generalize well across skills of the same domain. For instance, we examined German reading comprehension and German reading speed in grade 5: and
were strikingly different from each other for these outcome measures (reading comprehension:
0.04, and
0.32; reading speed:
0.13 and
0.19).
Taken together, these findings underscore the importance of striving for the best fit between design parameters and target achievement measure when performing power analyses for CRTs because borrowing design parameters that do not match well can yield severely biased sample size requirements (Westine et al., Citation2013).
Limitations and Outlook
This study has several limitations. First, given the large international variability of design parameters detected in previous studies (e.g., Brunner et al., Citation2018; Zopluoglu, Citation2012), our findings are first and foremost applicable to the German school system. Notably, the school systems in Austria, Czech Republic, Hungary, Slovak Republic, and Turkey are also characterized by an early onset of school-level tracking after elementary school as in Germany (Salchegger, Citation2016). When design parameters are not available, intervention researchers conducting trials in such countries may apply the present design parameters in their power analyses because they are still better guesses than conventional benchmarks.
Second, we did not apply sampling weights. Hence, our results are representative only for those students selected for the present analyses. In general, the present design parameters are likely somewhat less accurate compared to those obtained from analyses using sampling weights. However, differences may be small as indicated in previous studies drawing on international large-scale assessment data (e.g., Wenger et al., Citation2018).
Third, the present design parameters were derived from national probability samples. Federal states within Germany as well as districts within federal states may vary in their mean achievement levels. The outcome measures analyzed in this article contain some degree of variance that may be located at those higher levels. Thus, the reported values for between-school differences may be considered upper bound rather than lower bound estimates (see Hedges & Hedberg, Citation2007a, Citation2013).
Fourth, the present design parameters focus on student achievement as outcomes. Yet, apart from cognitive achievement, educational curricula worldwide identify a large range of further outcomes as key learning targets in school (World Economic Forum, Citation2015), such as social and emotional skills (e.g., skills needed for task performance, to cooperate with others, or to regulate emotions; OECD, Citation2017). Future research should therefore also supply design parameters for these skills (see, e.g., Brunner et al., Citation2018).
Fifth, the present design parameters go well with outcome measures that are identical or highly similar to the measures that were used in NEPS, DESI, or PISA-I+. Researchers should be cautious when relying on the present design parameters for planning CRTs with outcome measures that differ substantially from those used in the present study (see Brunner et al., Citation2018).
Finally, we provided standard errors for design parameters that quantify the statistical uncertainty associated with these estimates due to sampling error. Importantly, variability in research contexts (e.g., student populations, outcome measures) may further increase statistical uncertainty. When planning CRTs for research designs that are not covered in our study (e.g., for modestly dissimilar student populations and outcome measures), we recommend using our compilation of normative distributions of design parameters (Tables B2, B4, B6, B8, B10, B12, B14, and B16). In general, little is still known about the factors that affect the value of design parameters (e.g., why certain values equal 1.00; see ). An important next step for future research is therefore to conduct meta-analyses that quantify variability in design parameters across research contexts and examine moderator variables (e.g., outcome domain, onset of school type tracking, time lag between pre- and posttest, reliability of measures) that might explain this variability.
Conclusion and Recommendations
Capitalizing on representative data from three German longitudinal large-scale assessments, our study provides reliable three- and two-level design parameters with standard errors for a broad spectrum of achievement domains across the school career. Design parameters varied considerably as a function of the hierarchical level, achievement outcome, and grade level. Importantly, our analyses show that pretest and sociodemographic covariates improve the precision of educational CRTs at the student, classroom, and school level over and above each other. The present design parameters and their standard errors are therefore fundamental when planning CRTs in the German or similar school systems. Specifically, researchers may benefit from consulting to select the set of design parameters that offers the best fit to the planned educational intervention (e.g., in terms of population, domain, grade level) so CRTs can be adequately powered to generate high-quality evidence of what actually works to foster student achievement in Germany and elsewhere.
Open Scholarship

This article has earned the Center for Open Science badge for Open Materials. The materials are openly accessible via the Open Science Framework at https://osf.io/2w8nt.
Supplemental Material B
Download MS Excel (3.5 MB)Supplemental Material A
Download PDF (524.4 KB)Acknowledgments
While working on her dissertation, Sophie E. Stallasch was a predoctoral fellow at the International Max Planck Research School on the Life Course (LIFE, https://www.imprs-life.mpg.de; participating institutions: Max Planck Institute for Human Development, Berlin, Germany; Freie Universität Berlin, Germany; Humboldt University of Berlin, Germany; University of Michigan, Ann Arbor, MI, USA; University of Virginia, Charlottesville, VA, USA; University of Zurich, Switzerland).
We would like to thank Elizabeth J. Parks-Stamm for her editorial assistance with this article.
Disclosure Statement
No potential conflict of interest was reported by the author(s).
Data Availability Statement
A more detailed description of methods and results (Supplemental Online Material A), a comprehensive compilation of design parameters (Supplemental Online Material B), the R and Mplus scripts that underlie the statistical analyses of this article, and brief descriptions of where and how to access the data and material are available on the Open Science Framework at https://osf.io/2w8nt.
This article uses data from the National Educational Panel Study (NEPS): Starting Cohort 2–Kindergarten, https://doi.org/10.5157/NEPS:SC2:6.0.1, Starting Cohort 3–5th Grade, https://doi.org/10.5157/NEPS:SC3:7.0.1, and Starting Cohort 4–9th Grade, https://doi.org/10.5157/NEPS:SC4:9.1.1. NEPS is carried out by the Leibniz Institute for Educational Trajectories (LIfBi) in cooperation with a nationwide German network. Moreover, this article uses data from the Assessment of Student Achievements in German and English as a Foreign Language (DESI), https://doi.org/10.5159/IQB_DESI_v1, and from the Programme for International Student Assessment – International Plus 2003, 2004 (PISA-I-Plus 2003, 2004), https://doi.org/10.5159/IQB_PISA_I_Plus_v1.
Additional information
Funding
Notes
1 Equivalent specifications for two-level designs (where students at L1 are nested within schools at L3) are recorded in the Supplemental Online Material A on the Open Science Framework (https://osf.io/2w8nt).
2 The exclusion criteria applied for the present analyses are outlined in the Supplemental Online Material A. Table A1 itemizes the number of excluded students. Sensitivity analyses showed no systematic differences in the study measures between students that were included and those that were excluded (see Tables A2–A4).
3 In very few cases, negative values or estimation problems occurred. Different strategies applied to resolve these estimation issues are described in the Supplemental Online Material A.
4 After careful consideration we decided not to use sampling weights in our analyses. As we had to exclude students who did not meet the criteria required for our analyses, applying the weights to the remaining students would have no longer represented the total German student population.
References
- American Educational Research Association. (2006). Standards for reporting on empirical social science research in AERA publications. Educational Researcher, 35(6), 33–40. https://doi.org/10.3102/0013189X035006033
- American Psychological Association (Ed.). (2019). Publication manual of the American Psychological Association (7th ed.). American Psychological Association.
- Aßmann, C., Steinhauer, H. W., Kiesl, H., Koch, S., Schönberger, B., Müller-Kuller, A., Rohwer, G., Rässler, S., & Blossfeld, H.-P. (2011). Sampling designs of the National Educational Panel Study: Challenges and solutions. Zeitschrift Für Erziehungswissenschaft, 14(S2), 51–65. https://doi.org/10.1007/s11618-011-0181-8
- Baumert, J., Köller, O., Lehrke, M., & Brockmann, J. (2000). Anlage und Durchführung der Dritten Internationalen Mathematik- und Naturwissenschaftsstudie zur Sekundarstufe II (TIMSS/III)—Technische Grundlagen [Design and implementation of the Third Trends in International Mathematics and Science Study (TIMSS/III)—technical information]. In J. Baumert, W. Bos, & R. Lehmann (Eds.), TIMSS/III. Dritte Internationale Mathematik- und Naturwissenschaftsstudie. Mathematische und naturwissenschaftliche Bildung am Ende der Schullaufbahn: Vol. 1: Mathematische und naturwissenschaftliche Grundbildung am Ende der Pflichschulzeit (pp. 31–84). Leske + Budrich.
- Baumert, J., Trautwein, U., & Artelt, C. (2003). Schulumwelten—Institutionelle Bedingungen des Lehrens und Lernens [School contexts—institutional conditions for teaching and learning]. In Deutsches PISA-Konsortium (Ed.), PISA 2000. Ein differenzierter Blick auf die Länder der Bundesrepublik Deutschland (pp. 261–331). Leske + Budrich. https://doi.org/10.1007/978-3-322-97590-4_11
- Beck, B., Bundt, S., & Gomolka, J. (2008). Ziele und Anlage der DESI-Studie [Objectives and design of the DESI study]. In DESI-Konsortium (Ed.), Unterricht und Kompetenzerwerb in Deutsch und Englisch. Ergebnisse der DESI-Studie (pp. 11–25). Beltz.
- Bloom, H. S. (1995). Minimum detectable effects: A simple way to report the statistical power of experimental designs. Evaluation Review, 19(5), 547–556. https://doi.org/10.1177/0193841X9501900504
- Bloom, H. S. (2005). Randomizing groups to evaluate place-based programs. In H. S. Bloom (Ed.), Learning more from social experiments. Evolving analytic approaches (pp. 115–172). Russell Sage Foundation.
- Bloom, H. S. (2006). The core analytics of randomized experiments for social research. MDRC Working Papers on Research Methodology. http://www.mdrc.org/sites/default/files/full_533.pdf
- Bloom, H. S., Bos, J. M., & Lee, S.-W. (1999). Using cluster random assignment to measure program impacts. Statistical implications for the evaluation of education programs. Evaluation Review, 23(4), 445–469. https://doi.org/10.1177/0193841X9902300405
- Bloom, H. S., Raudenbush, S. W., Weiss, M. J., & Porter, K. (2017). Using multisite experiments to study cross-site variation in treatment effects: A hybrid approach with fixed intercepts and a random treatment coefficient. Journal of Research on Educational Effectiveness, 10(4), 817–842. https://doi.org/10.1080/19345747.2016.1264518
- Bloom, H. S., Richburg-Hayes, L., & Black, A. R. (2007). Using covariates to improve precision for studies that randomize schools to evaluate educational interventions. Educational Evaluation and Policy Analysis, 29(1), 30–59. https://doi.org/10.3102/0162373707299550
- Bloom, H. S., & Spybrook, J. (2017). Assessing the precision of multisite trials for estimating the parameters of a cross-site population distribution of program effects. Journal of Research on Educational Effectiveness, 10(4), 877–902. https://doi.org/10.1080/19345747.2016.1271069
- Bloom, H. S., Zhu, P., Jacob, R., Raudenbush, S. W., Martinez, A., & Lin, F. (2008). Empirical issues in the design of group-randomized studies to measure the effects of interventions for children. MDRC Working Papers on Research Methodology. https://www.mdrc.org/sites/default/files/full_85.pdf
- Blossfeld, H.-P., Roßbach, H.-G., & von Maurice, J. (Eds.). (2011). Education as a lifelong process: The German National Educational Panel Study (NEPS). VS Verlag für Sozialwissenschaften.
- Böhme, K., & Weirich, S. (2012). Der Ländervergleich im Fach Deutsch [National Assessment Study in German]. In P. Stanat, H. A. Pant, K. Böhme, & D. Richter (Eds.), Kompetenzen von Schülerinnen und Schülern am Ende der vierten Jahrgangsstufe in den Fächern Deutsch und Mathematik. Ergebnisse des IQB-Ländervergleichs 2011 (pp. 103–116). Waxmann.
- Boruch, R. F., & Foley, E. (2000). The honestly experimental society: Sites and other entities as the units of allocation and analysis in randomized trials. In L. Bickman (Ed.), Validity and social experimentation: Donald campbell’s legacy (pp. 193–239). SAGE.
- Brandon, P. R., Harrison, G. M., & Lawton, B. E. (2013). SAS code for calculating intraclass correlation coefficients and effect size benchmarks for site-randomized education experiments. American Journal of Evaluation, 34(1), 85–90. https://doi.org/10.1177/1098214012466453
- Brunner, M., Keller, U., Wenger, M., Fischbach, A., & Lüdtke, O. (2018). Between-school variation in students’ achievement, motivation, affect, and learning strategies: Results from 81 countries for planning group-randomized trials in education. Journal of Research on Educational Effectiveness, 11(3), 452–478. https://doi.org/10.1080/19345747.2017.1375584
- Bulus, M., Dong, N., Kelcey, B., & Spybrook, J. (2019). PowerUpR: Power analysis tools for multilevel randomized experiments. R package version 1.0.4. https://CRAN.R-project.org/package=PowerUpR
- Cohen, J. (1988). Statistical power analysis for the behavioral sciences (2nd ed). Lawrence Erlbaum Associates.
- Cook, T. D. (2005). Emergent principles for the design, implementation, and analysis of cluster-based experiments in social science. Annals of the American Academy of Political and Social Science, 599(1), 176–198. https://doi.org/10.1177/0002716205275738
- DESI-Konsortium (Ed.). (2008). Unterricht und Kompetenzerwerb in Deutsch und Englisch: Ergebnisse der DESI-Studie [Teaching and acquisition of competencies in German and English as a foreign language: Results from the DESI study]. Beltz.
- Dong, N., & Maynard, R. (2013). PowerUp!: A tool for calculating minimum detectable effect sizes and minimum required sample sizes for experimental and quasi-experimental design studies. Journal of Research on Educational Effectiveness, 6(1), 24–67. https://doi.org/10.1080/19345747.2012.673143
- Donner, A., & Klar, N. (2000). Design and analysis of cluster randomization trials in health research. Hodder Education.
- Donner, A., & Koval, J. J. (1980). The large sample variance of an intraclass correlation. Biometrika, 67(3), 719–722. https://doi.org/10.1093/biomet/67.3.719
- Ganzeboom, H. B. G., & Treiman, D. J. (1996). Internationally comparable measures of occupational status for the 1988 international standard classification of occupations. Social Science Research, 25(3), 201–239. https://doi.org/10.1006/ssre.1996.0010
- Gersten, R., Rolfhus, E., Clarke, B., Decker, L. E., Wilkins, C., & Dimino, J. (2015). Intervention for first graders with limited number knowledge: Large-scale replication of a randomized controlled trial. American Educational Research Journal, 52(3), 516–546. https://doi.org/10.3102/0002831214565787
- Grund, S., Robitzsch, A., & Lüdtke, O. (2019). Mitml: Tools for multiple imputation in multilevel modeling. R package version 0.3-7. https://CRAN.R-project.org/package=mitml
- Haag, N., & Roppelt, A. (2012). Der Ländervergleich im Fach Mathematik [National Assessment Study in mathematics]. In P. Stanat, H. A. Pant, K. Böhme, & D. Richter (Eds.), Kompetenzen von Schülerinnen und Schülern am Ender der vierten Jahrgangsstufe in den Fächern Deutsch und Mathematik. Ergebnisse des IQB-Ländervergleichs 2011 (pp. 117–127). Waxmann.
- Hallquist, M. N., & Wiley, J. F. (2018). MplusAutomation: An R package for facilitating large-scale latent variable analyses in Mplus. Structural Equation Modeling: A Multidisciplinary Journal, 25(4), 621–638. https://doi.org/10.1080/10705511.2017.1402334
- Hedberg, E. C., Santana, R., & Hedges, L. V. (2004). The variance structure of academic achievement in America. Annual meeting of the American Educational Research Association, San Diego, CA.
- Hedges, L. V., & Hedberg, E. C. (2007a). Intraclass correlation values for planning group-randomized trials in education. Educational Evaluation and Policy Analysis, 29(1), 60–87. https://doi.org/10.3102/0162373707299706
- Hedges, L. V., & Hedberg, E. C. (2007b). Intraclass correlations for planning group randomized experiments in rural education. Journal of Research in Rural Education, 22(10), 1–15. http://jrre.vmhost.psu.edu/wp-content/uploads/2014/02/22-10.pdf
- Hedges, L. V., & Hedberg, E. C. (2013). Intraclass correlations and covariate outcome correlations for planning two- and three-level cluster-randomized experiments in education. Evaluation Review, 37(6), 445–489. https://doi.org/10.1177/0193841X14529126
- Hedges, L. V., Hedberg, E. C., & Kuyper, A. M. (2012). The variance of intraclass correlations in three- and four-level models. Educational and Psychological Measurement, 72(6), 893–909. https://doi.org/10.1177/0013164412445193
- Hedges, L. V., Rhoads, C. (2010). Statistical power analysis in education research. National Center for Special Education Research. https://ies.ed.gov/ncser/pubs/20103006/pdf/20103006.pdf
- Hedges, L. V., & Vevea, J. L. (1998). Fixed- and random-effects models in meta-analysis. Psychological Methods, 3(4), 486–504. https://doi.org/10.1037/1082-989X.3.4.486
- Hill, C. J., Bloom, H. S., Black, A. R., & Lipsey, M. W. (2008). Empirical benchmarks for interpreting effect sizes in research. Child Development Perspectives, 2(3), 172–177. https://doi.org/10.1111/j.1750-8606.2008.00061.x
- Institute of Education Sciences & National Science Foundation. (2013). Common guidelines for education research and development. https://www.nsf.gov/pubs/2013/nsf13126/nsf13126.pdf
- Jacob, R. T., Zhu, P., & Bloom, H. S. (2010). New empirical evidence for the design of group randomized trials in education. Journal of Research on Educational Effectiveness, 3(2), 157–198. https://doi.org/10.1080/19345741003592428
- Kelcey, B., Shen, Z., & Spybrook, J. (2016). Intraclass correlation coefficients for designing cluster-randomized trials in Sub-Saharan Africa education. Evaluation Review, 40(6), 500–525. https://doi.org/10.1177/0193841X16660246
- Knigge, M., & Köller, O. (2010). Effekte der sozialen Zusammensetzung der Schülerschaft [Impact of the social classroom composition of schools]. In O. Köller, M. Knigge, & B. Tesch (Eds.), Sprachliche Kompetenzen im Ländervergleich (pp. 227–244). Waxmann.
- Konstantopoulos, S. (2008a). The power of the test for treatment effects in three-level cluster randomized designs. Journal of Research on Educational Effectiveness, 1(1), 66–88. https://doi.org/10.1080/19345740701692522
- Konstantopoulos, S. (2008b). The power of the test for treatment effects in three-level block randomized designs. Journal of Research on Educational Effectiveness, 1(4), 265–288. https://doi.org/10.1080/19345740802328216
- Konstantopoulos, S. (2012). The impact of covariates on statistical power in cluster randomized designs: Which level matters more? Multivariate Behavioral Research, 47(3), 392–420. https://doi.org/10.1080/00273171.2012.673898
- Kultusministerkonferenz. (2015). Gesamtstrategie der Kultusministerkonferenz zum Bildungsmonitoring. https://www.kmk.org/fileadmin/Dateien/veroeffentlichungen_beschluesse/2015/2015_06_11-Gesamtstrategie-Bildungsmonitoring.pdf
- LeBreton, J. M., & Senter, J. L. (2008). Answers to 20 questions about interrater reliability and interrater agreement. Organizational Research Methods, 11(4), 815–852. https://doi.org/10.1177/1094428106296642
- Lehmann, R., & Lenkeit, J. (2008). ELEMENT. Erhebung zum Lese- und Mathematikverständnis. Entwicklungen in den Jahrgangsstufen 4 bis 6 in Berlin. Abschlussbericht über die Untersuchungen 2003, 2004 und 2005 an Berliner Grundschulen und grundständigen Gymnasien [ELEMENT: Study of reading and mathematics literacy. Development from grades 4 to 6 in Berlin. Final research report on the 2003, 2004, and 2005 assessments at primary schools and undergraduate academic tracks in Berlin]. Humboldt-Universität zu Berlin. https://www.researchgate.net/profile/Jenny_Lenkeit/publication/273380369_ELEMENT_Erhebung_zum_Lese-_und_Mathematik-verstandnis_-_Entwicklungen_in_den_Jahrgangsstufen_4_bis_6_in_Berlin_Abschlussbericht_uber_die_Untersuchungen_2003_2004_und_2005_an_Berliner_Grundschulen_und_/links/553f61600cf23e796bfb38c2.pdf?origin=publication_detail
- Lipsey, M. W., Puzio, K., Yun, C., Hebert, M. A., Steinka-Fry, K., Cole, M. W., Roberts, M., Anthony, K. S., & Busick, M. D. (2012). Translating the statistical representation of the effects of education interventions into more readily interpretable forms. National Center for Special Education Research. http://eric.ed.gov/?id=ED537446
- Lüdtke, O., Marsh, H. W., Robitzsch, A., Trautwein, U., Asparouhov, T., & Muthén, B. (2008). The multilevel latent covariate model: A new, more reliable approach to group-level effects in contextual studies. Psychological Methods, 13(3), 203–229. https://doi.org/10.1037/a0012869
- Martin, M. O., Foy, P., Mullis, I. V. S., & O’Dwyer, L. M. (2013). Effective schools in reading, mathematics, and science at the fourth grade. In M. O. Martin & I. V. S. Mullis (Eds.), TIMSS and PIRLS 2011: Relationships among reading, mathematics, and science achievement at the fourth grade—implications for early learning (pp. 109–179). TIMSS & PIRLS International Study Center, Boston College. https://timssandpirls.bc.edu/timsspirls2011/downloads/TP11_Relationship_Report.pdf
- Martin, M. O., Mullis, I. V. S., Gregory, K. D., Hoyle, C., & Shen, C. (2000). Effective schools in science and mathematics: IEA’s Third International Mathematics and Science Study. International Study Center, Boston College. https://timssandpirls.bc.edu/timss1995i/TIMSSPDF/T95_EffSchool.pdf
- Murray, D. M. (1998). Design and analysis of group-randomized trials. Oxford University Press.
- Muthén, L. K., & Muthén, B. O. (2017). Mplus user’s guide (8th ed.). Muthén & Muthén.
- National Research Council (Ed.). (2011). Assessing 21st century skills: Summary of a workshop. National Academies Press. https://doi.org/10.17226/13215
- Organisation for Economic Co-operation and Development. (2007). Evidence in education: Linking research and policy. OECD Publishing. https://doi.org/10.1787/9789264033672-en
- Organisation for Economic Co-operation and Development. (2017). Social and emotional skills. Well-being, connectedness and success. OECD Publishing. http://www.oecd.org/education/school/UPDATED%20Social%20and%20Emotional%20Skills%20-%20Well-being,%20connectedness%20and%20success.pdf%20(website).pdf
- Organisation for Economic Co-operation and Development. (2018). The future of education and skills. OECD Publishing. https://www.oecd.org/education/2030-project/about/documents/E2030%20Position%20Paper%20(05.04.2018).pdf
- PISA-Konsortium Deutschland (Ed.). (2006). PISA 2003. Untersuchungen zur Kompetenzentwicklung im Verlauf eines Schuljahres [PISA 2003. Investigating competence development throughout one school year]. Waxmann.
- Prenzel, M., Carstensen, C. H., Schöps, K., & Maurischat, C. (2006). Die Anlage des Längsschnitts bei PISA 2003 [The longitudinal design of PISA 2003]. In PISA-Konsortium Deutschland (Ed.), PISA 2003. Untersuchungen zur Kompetenzentwicklung im Verlauf eines Schuljahres (pp. 29–62). Waxmann.
- R Core Team. (2018). R: A language and environment for statistical computing. R Foundation for Statistical Computing. https://www.R-project.org
- Raudenbush, S. W. (1997). Statistical analysis and optimal design for cluster randomized trials. Psychological Methods, 2(2), 173–185. https://doi.org/10.1037/1082-989X.2.2.173
- Raudenbush, S. W., & Liu, X. (2000). Statistical power and optimal design for multisite randomized trials. Psychological Methods, 5(2), 199–213. https://doi.org/10.1037/1082-989X.5.2.199
- Raudenbush, S. W., Martínez, A., & Spybrook, J. (2007). Strategies for improving precision in group-randomized experiments. Educational Evaluation and Policy Analysis, 29(1), 5–29. https://doi.org/10.3102/0162373707299460
- Robitzsch, A., Grund, S., & Henke, T. (2018). miceadds: Some additional multiple imputation functions, especially for mice. R package version 2.15-6. https://CRAN.R-project.org/package=miceadds
- Rubin, D. B. (1987). Multiple imputation for nonresponse in surveys. Wiley.
- Salchegger, S. (2016). Selective school systems and academic self-concept: How explicit and implicit school-level tracking relate to the big-fish-little-pond effect across cultures. Journal of Educational Psychology, 108(3), 405–423. https://doi.org/10.1037/edu0000063
- Schochet, P. Z. (2008). Statistical power for random assignment evaluations of education programs. Journal of Educational and Behavioral Statistics, 33(1), 62–87. https://doi.org/10.3102/1076998607302714
- Schochet, P. Z., Puma, M., & Deke, J. (2014). Understanding variation in treatment effects in education impact evaluations: An overview of quantitative methods. Institute of Education Sciences (IES). https://ies.ed.gov/ncee/pubs/20144017/pdf/20144017.pdf
- Senkbeil, M. (2006). Die Bedeutung schulischer Faktoren für die Kompetenzentwicklung in Mathematik und in den Naturwissenschaften [The relevance of school context factors for competence development in mathematics and science]. In PISA-Konsortium Deutschland (Ed.), PISA 2003. Untersuchungen zur Kompetenzentwicklung im Verlauf eines Schuljahres (pp. 277–308). Waxmann.
- Shadish, W. R., Cook, T. D., & Campbell, D. T. (2002). Experimental and quasi-experimental designs for generalized causal inference. Houghton Mifflin Company.
- Slavin, R. E. (2002). Evidence-based education policies: Transforming educational practice and research. Educational Researcher, 31(7), 15–21. https://doi.org/10.3102/0013189X031007015
- Spybrook, J. (2013). Introduction to special issue on design parameters for cluster randomized trials in education. Evaluation Review, 37(6), 435–444. https://doi.org/10.1177/0193841X14527758
- Spybrook, J., & Kelcey, B. (2016). Introduction to three special issues on design parameter values for planning cluster randomized trials in the social sciences. Evaluation Review, 40(6), 491–499. https://doi.org/10.1177/0193841X16685646
- Spybrook, J., & Raudenbush, S. W. (2009). An examination of the precision and technical accuracy of the first wave of group-randomized trials funded by the institute of education sciences. Educational Evaluation and Policy Analysis, 31(3), 298–318. https://doi.org/10.3102/0162373709339524
- Spybrook, J., Shi, R., & Kelcey, B. (2016). Progress in the past decade: An examination of the precision of cluster randomized trials funded by the U.S. Institute of Education Sciences. International Journal of Research & Method in Education, 39(3), 255–267. https://doi.org/10.1080/1743727X.2016.1150454
- Spybrook, J., Westine, C. D., & Taylor, J. A. (2016). Design parameters for impact research in science education: A multistate analysis. AERA Open, 2(1), 1–15. https://doi.org/10.1177/2332858415625975
- van Buuren, S., & Groothuis-Oudshoorn, K. (2011). mice: Multivariate imputation by chained equations in R. Journal of Statistical Software, 45(3), 1–67. https://doi.org/10.18637/jss.v045.i03
- Viechtbauer, W. (2010). Conducting meta-analyses in R with the metafor package. Journal of Statistical Software, 36(3), 1–48. https://doi.org/10.18637/jss.v036.i03
- Warm, T. A. (1989). Weighted likelihood estimation of ability in item response theory. Psychometrika, 54(3), 427–450. https://doi.org/10.1007/BF02294627
- Weiss, M. J., Bloom, H. S., & Brock, T. (2014). A conceptual framework for studying the sources of variation in program effects. Journal of Policy Analysis and Management, 33(3), 778–808. https://doi.org/10.1002/pam.21760
- Weiss, M. J., Bloom, H. S., Verbitsky-Savitz, N., Gupta, H., Vigil, A. E., & Cullinan, D. N. (2017). How much do the effects of education and training programs vary across sites? Evidence from past multisite randomized trials. Journal of Research on Educational Effectiveness, 10(4), 843–876. https://doi.org/10.1080/19345747.2017.1300719
- Wenger, M., Lüdtke, O., & Brunner, M. (2018). Übereinstimmung, Variabilität und Reliabilität von Schülerurteilen zur Unterrichtsqualität auf Schulebene: Ergebnisse aus 81 Ländern. Zeitschrift Für Erziehungswissenschaft, 21(5), 929–950. https://doi.org/10.1007/s11618-018-0813-3
- Westine, C. D., Spybrook, J., & Taylor, J. A. (2013). An empirical investigation of variance design parameters for planning cluster-randomized trials of science achievement. Evaluation Review, 37(6), 490–519. https://doi.org/10.1177/0193841X14531584
- World Economic Forum. (2015). New vision for education. Unlocking the potential of technology. http://www3.weforum.org/docs/WEFUSA_NewVisionforEducation_Report2015.pdf
- Xu, Z., & Nichols, A. (2010). New estimates of design parameters for clustered randomization studies. Findings from North Carolina and Florida. National Center for Analysis of Longitudinal Data in Education. http://www.urban.org/sites/default/files/alfresco/publication-pdfs/1001394-New-Estimates-of-Design-Parameters-for-Clustered-Randomization-Studies.pdf
- Zhu, P., Jacob, R., Bloom, H., & Xu, Z. (2012). Designing and analyzing studies that randomize schools to estimate intervention effects on student academic outcomes without classroom-level information. Educational Evaluation and Policy Analysis, 34(1), 45–68. https://doi.org/10.3102/0162373711423786
- Zopluoglu, C. (2012). A cross-national comparison of intra-class correlation coefficient in educational achievement outcomes. Eğitimde ve Psikolojide Ölçme ve Değerlendirme Dergisi, 3(1), 233–270.