
Abstract
Few studies have focused on dose-response analyses of multi-strain probiotics in the general adult population. This study aimed at comparing how a low- and high-dose of a multi-strain probiotic supplement (containing Lactobacillus helveticus R0052, Lactobacillus rhamnosus R0011, Lactobacillus casei R0215, Pediococcus acidilactici R1001, Bifidobacterium breve R0070, Bifidobacterium longum ssp. longum BB536, Lactobacillus plantarum R1012, Lactococcus lactis ssp. lactis R1058) affected microbiota composition, transit persistence and safety in adults. After a 7-d baseline, participants were randomized to receive capsules containing 5 or 25 billion CFU, or placebo daily for 28 days, followed by a 7-d washout. Digestive health and general wellness were assessed. Fecal microbiota composition was analyzed using 16S rRNA gene amplicon sequencing and strain persistence, by qPCR. Participants’ gastrointestinal and general wellbeing were unaffected. No adverse events were associated with either dose. Supplemented strains contributed to the Lactobacillus and Bifidobacterium genera detected in stool, with 0.40 ± 0.11% and 0.51 ± 0.26%, respectively, in the high-dose group. Strain-specific qPCR assays revealed variable levels of post-intervention persistence between strains. Sequencing and composition analyses using the 16S V4 region revealed a decrease in Holdemania and increase in Bacteroidales. The formulation was well tolerated in this sample of the general adult population, even at the higher dose. The strains appear to have influenced microbiota composition minimally, as expected in the absence of dysbiosis, and consistently with the dose administered. Overall, the results provide a rationale to study the effects this formulation on microbiota composition in individuals exhibiting dysbiosis associated with metabolic disorders or obesity.
Introduction
Several studies in both animals and humans support the positive effects of probiotics on health and wellness in individuals with dysbiosis-related conditions (Dolan et al. Citation2016; Pizano et al. Citation2017; Williamson et al. Citation2017; Finley et al. Citation2018). In humans, compelling evidence is accumulating to support a beneficial effect of probiotics on gastrointestinal dysfunction and depressive-like symptoms (Wallace and Milev Citation2017; Parker et al. Citation2018; Nadeem et al. Citation2019). In addition, an increasing level of attention is being directed toward the role of probiotics in other dysbiosis-associated diseases and disorders such as obesity, cardiovascular disease, diabetes, and cancer (Hampe and Roth Citation2017; Gopalakrishnan et al. Citation2018; Mazloom et al. Citation2019; Tang et al. Citation2019). However, the extent to which multi-strain probiotic formulations can affect microbiota composition in a general adult population remains to be established.
Especially in the absence of dysbiosis, probiotics are not expected to exert major or persisting effects on microbiota composition owing to the high level of resilience of a homeostatic microbiota to external perturbations (Kristensen et al. Citation2016; Sommer et al. Citation2017). Dysbiosis is defined by a loss of homeostasis in the intestinal microbiota, often characterized by a lowered microbial diversity, the loss of beneficial microbes, or an overabundance of deleterious ones (Kriss et al. Citation2018). However, its corollary remains undefined in terms of composition; the core microbial signature of a ‘normal’ or ‘healthy’ microbiota appears to vary significantly among individuals according to genetics, age, geography or lifestyle-related factors (Greenhalgh et al. Citation2016). Consequently, studies assessing the effects of a variety of probiotic formulations on microbiota composition in populations described as healthy have produced mixed results so far (Kristensen et al. Citation2016). Nevertheless, even if the identification of a “healthy” microbial signature remains elusive, the need for evaluating the safety and understanding the effects of specific probiotic formulations on intestinal microbiota profile commands for an assessment in a general population of adults without known dysbiosis-associated diseases. Few studies in humans have evaluated the individual behavior of several bacterial strains ingested simultaneously in terms of microbiota contribution and intestinal persistence after ingestion (Mennini et al. Citation2019; Taverniti et al. Citation2019). Therefore, conducting more studies in various samples of the general population is essential to gather insight into individual strain characteristics when administered within probiotic blends, such as persistence, as well as to refine our general understanding of emerging concepts about microbiota functional composition, such the significance of the Firmicutes-Bacteroidetes (FB) ratio in non-diseased individuals.
Hence, the primary aim of this study was to determine the impact of a low- and high-dosage multi-strain proprietary blend (containing Lactobacillus helveticus R0052, Lactobacillus rhamnosus R0011, Lactobacillus casei R0215, Pediococcus acidilactici R1001, Bifidobacterium breve R0070, Bifidobacterium longum ssp. longum BB536 Lactobacillus plantarum R1012, Lactococcus lactis ssp. lactis R1058) on fecal microbiota composition in adults. Specifically, considering the prominent role of Bifidobacteria and Lactobacilli species for intestinal function and diseases, we aimed at assessing the effect of this probiotic formulation on Bifidobacteria and Lactobacilli abundance in a general adult population. Secondary aims were to assess the safety and tolerance of a high probiotic dose on digestive health, including stool frequency, gastrointestinal symptoms and stool form, as well as on general wellness in adults. In addition, individual probiotic strain persistence and overall fecal microbiota composition were examined, with a focus on the dose-dependent effects of this probiotic formulation on commensal bacteria homeostasis using standard microbiota profiling metrics, such as relative taxonomic abundance, microbial diversity, and changes in the relative abundance of phyla underlying the Firmicutes-Bacteroidetes ratio.
Materials and methods
Participants
Adults aged 18–34 years were recruited in Florida, USA through flyers and posters. Exclusion criteria included: known allergy to milk, soy, gluten or gluten sensitivity; current medications for constipation or diarrhea; antibiotics within the four weeks preceding randomization; probiotic supplementation and refusal to discontinue for a minimum of two weeks prior to the study; previous or current treatment for any diseases or illnesses such as gastrointestinal disease (gastric ulcers, Crohn’s, celiac, ulcerative colitis, etc.); other chronic diseases (diabetes, kidney disease, etc.) or immune-compromising diseases or conditions (HIV/AIDS, autoimmune, hepatitis, cancer, transplant patient etc.); current smoker; and pregnant or lactating. In addition, the IPAQ (International Physical Activity Questionnaire) (Craig et al. Citation2003) was used to exclude very sedentary individuals and elite athletes (e.g. professional/college athletes, marathon runners). The study was approved by the University of Florida’s Institutional Review Board (IRB)-01 and conducted according to guidelines established by the Declaration of Helsinki. The study prototol is registered at clinicaltrials.gov (NCT02693314). Participants were informed of the aims, requirements and potential risk/benefits of the study, and provided their written consent indicating their full understanding of the study protocol.
Study design
The study followed a double-blind, randomized, parallel design (). After providing consent, participants completed a 7-day baseline period. On day 8, after confirmation of inclusion/exclusion criteria, eligible participants were randomized to receive one capsule per day containing either five billion or 25 billion CFU of the probiotic supplement, or placebo for 28 days, followed by a 7-day washout period. Briefly, out of 112 individuals screened, 69 eligible individuals were enrolled in the study and randomized into each of the 3 groups (n = 23/group) (). Randomization was performed using a computer-generated, sealed envelope method and completed by an individual not otherwise involved in the study. At the end of the intervention period, participants returned any unconsumed supplements for compliance monitoring.
Figure 1. Schematics of study design. The placebo-controlled study followed a three-arm parallel design. Participants (n = 23 per arm) were randomized at the end of a 7-day baseline period, which was followed by a 28-day intervention period (placebo or probiotic at either 5 or 25 billion of colony forming units (CFU)/capsule) and a 7-day washout period. Stool samples were collected within the 6 h preceding visits 1 (Baseline), 2 (End-of-Treatment), and 3 (Washout).
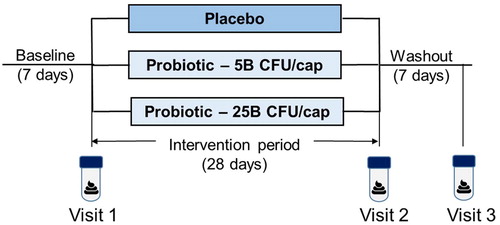
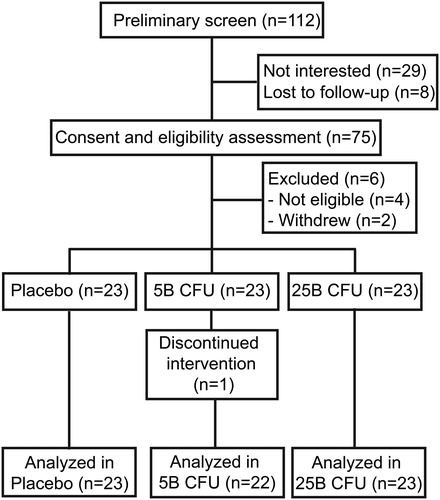
Figure 2. Study Flow Diagram. Diagram showing participants’ allocation and progression throughout the study.
Probiotic supplement
The Jarro-Dophilus EPS® and EPS® High-Potency probiotic supplements formulated at five billion and 25 billion CFU/capsule, respectively, were assessed in this study. The formulations contain a blend of eight strains, with the same relative proportions between strains in the 5B and 25B capsules. The included strains are: Lactobacillus helveticus R0052, Lactobacillus rhamnosus R0011, Pediococcus acidilactici R1001, B. longum ssp. longum BB536, L. casei R0215, L. plantarum R1012, B. breve R0070, Lactococcus lactis ssp. lactis R1058. Both probiotic formulations and the sensorially identical placebo were prepared in vegetarian capsules composed of hydroxypropylmethylcellulose and an aqueous-based enteric coating and contained potato starch, magnesium stearate, and vitamin C. The supplements were provided by Lallemand Health Solutions Inc. (Mirabel, Quebec, Canada) in identical containers labeled with two random codes for each intervention.
Study protocol
During the pre-baseline, intervention and washout periods, participants completed daily online questionnaires regarding stool frequency, stool consistency, gastrointestinal symptoms and compliance, and the Gastrointestinal Symptom Rating Scale (GSRS) was completed weekly (Revicki et al. Citation1998). Daily symptoms were rated from 0 (none) to 6 (very severe) and averaged into five syndromes with the exception of Sleep which was rated from 1 to 5 (1 = 5–6 h, 2 = 6–7 h, 3 = 7–8 h, 4 = 8–9 h, 5 > 9 h). GSRS symptoms were rated on a 7-point scale from 1 (no discomfort at all) to 7 (very severe discomfort). Body weight was assessed with a digital scale (Seca® model 874) and height with a portable stadiometer (Seca® model 217). Body weight was reassessed the end of the intervention and washout periods. Demographic information was taken at baseline. Participants collected a stool sample at baseline, at week 4 of intervention and in the final two days of the washout period. Participants were provided with Fisherbrand® commode collection kits for stool collection and asked to deliver the stool on ice within 4 h of defecation. Stools were sampled and processed within 6 h of defecation. The occurrence of adverse events was surveyed at each visit.
DNA extraction from fecal samples
Total genomic DNA was isolated from approximately 250-350 mg of homogenized fecal samples as previously described (MacPherson et al. Citation2018). Briefly, extraction was performed using the QIAamp® Fast DNA Stool Mini Kit (Qiagen, Hilden, Germany) as per manufacturer’s instructions, with the following modifications: Two washes with 0.05 M phosphate buffer were done prior to the addition of InhibitEX (Qiagen, Germany), and a 0.1 mm zirconia/silica bead beating step (∼250–350 mg/tube, 4 m/s for 1 min × 3) was performed before centrifugation of samples to pellet stool particles. DNA purity was assessed by 260/280 ratios. All DNA samples had ratios between 1.8 and 2.0, which were further processed for qPCR and 16S V4 amplicon sequencing.
Quantitative Real-Time PCR (qPCR) of microbial species and strains
Genus-specific PCR assays were performed using the CFX384™ Touch Real-Time PCR Detection System (Bio-Rad, USA) and plate preparation was automated using the epMotion 5075 tc liquid handling robot (Eppendorf, Germany), as previously described (Ford et al. Citation2020). Strain-specific qPCR assays were performed using the ViiA7 Real-Time PCR System (ThermoFisher Scientific, USA) (Alyousif et al. Citation2018) The standard curve for each bacterial strain was generated from feces spiked with 109 bacteria of the strain under investigation, with total cell counts obtained using the fluorescent nucleic acid stain SYTO™ 24 (ThermoFisher Scientific, USA) on the Accuri™ C6 Flow Cytometer (BD BioSciences, USA). DNA recovered from spiked feces using the modified QIAamp® Fast DNA Stool Mini Kit (Qiagen, Germany) protocol was serially diluted (10-fold) to generate the template for the standard curve ranging from 108 to 103 bacteria. The standard curve DNA for absolute Bifidobacterium genus quantification consisted of spiking a total of 1010 bacteria from six different Bifidobacterium species into a fecal matrix followed by DNA extraction as mentioned above. DNA was serially diluted (10-fold) to generate the template for the standard curve ranging from 109 to 105. The Lactobacillus genus standard curve consisted of spiking three Lactobacilli species into a fecal matrix at a total count of 1010 bacteria for each primer set.
All qPCR reaction mixtures consisted of 300 nM of the appropriate primer set, 1X SYBR Select® MasterMix (Thermo Fisher Scientific, USA) for a final reaction volume of 10 or 25 µL for the 384- and 96-well plates, respectively. 1 or 2.5 µL of 1/5 diluted DNA from fecal samples was added to each well of the 384- and 96-well reaction plates, respectively. The cycling conditions for all primer sets included a 2 min hold at 50 °C, a 2 min hold at 95 °C and 40 cycles of 95 °C for 15 s, 50 °C for 30 s and 72 °C for 30 s. All assays were followed by a dissociation curve from 60 °C to 95 °C. All primer sequences used are provided in Table S1.
Amplification and sequencing of the bacterial 16S rRNA gene
As previously described (MacPherson et al. Citation2018), bacterial 16S rRNA gene libraries were prepared according to the Illumina’s “16S Metagenomic Sequencing Library Preparation” guide (Part # 15044223 Rev. B), with the following modification: the Qiagen HotStarTaq MasterMix was used for the first PCR (“amplicon PCR”) and reagent volumes were halved for the second PCR (“index PCR”). The 515f (5′-GTGCCAGCMGCCGCGGTAA-3′) and 806 R (5′-GGACTACHVGGGTWTCTAAT-3′) template-specific primers flanked with appropriate overhang adapter sequences were used. The first PCR (“amplicon PCR”) was carried out for 25 cycles with annealing temperatures of 55 °C. Samples were diluted and pooled prior to loading on an Illumina MiSeq, and sequenced using a 500-cycle MiSeq Reagent Kit v3.
Microbiota composition analyses using 16S V4 sequences
The raw 16S V4 amplicon sequencing results were imported as a QIIME2 zipped artifact (as a .qza file format, the working format for qiime’s pipeline), which includes detailed record of all parameters of every subsequent analysis step, ensuring a high level of reproducibility from raw data up to figure production (Bolyen et al. Citation2019). High-quality reads were trimmed to 240 bp and filtered using the QIIME quality-filter q-score default parameters. Amplicon sequences were then grouped in the format of ASVs (Amplicon Sequence Variants) with the Deblur software implemented in QIIME2 and the relative frequency table was generated (artifact-encapsulated biom format table) (Amir et al. Citation2017). Upon examination of the table’s per sample sequence counts, the sampling depth of 3 203 was chosen for the core-metrics diversity analyses (Kruskal and Wallis 1952; McDonald et al. Citation2012; Bokulich et al. Citation2013). The taxonomic identity of the ASVs has been attributed with a sk-learn classification algorithm trained on the GreenGenes database on the full length of the 16S (DeSantis et al. Citation2006; Pedregosa et al. Citation2011).
Statistical analyses
Statistical analyses for qPCR results were conducted using the Prism Software v8.2 (GraphPad). Equivalence testing was conducted on the daily questionnaire syndromes, symptoms and the GSRS syndromes. A tolerance of 0.4 was used for the equivalence testing of daily questionnaire syndromes and symptoms, with the exception of hours of sleep, where a tolerance of 0.5 was used. When mean symptom or syndrome scores were significant (p < 0.05), a practical equivalence between the treatment groups was indicated. Psychological health and hours of sleep were analyzed by ANCOVA due to nonequivalent pairs at baseline. For the GSRS syndrome equivalence testing, a tolerance was set at 0.4 for abdominal pain, diarrhea, constipation, and indigestion, and 0.5 for reflux. BSFS were categorized into slow (type 1 and 2), normal transit (type 3, 4, and 5), and fast (type 6 and 7) and frequencies were compared.
Results
Allocation of participants and baseline characteristics
shows the study design. Of the 112 participants screened, 69 were randomized into three arms (n = 23 per arm), namely the placebo (P), probiotic supplement at five billion CFU (5B) or 25 billion CFU (25B). A total of 68 participants completed the six-week study as one participant in the 5B intervention group lost interest in the study and withdrew (). There was no significant difference between groups in terms of baseline demographic information nor compliance rates (%) for supplement intake, questionnaire completion and stool sample collection ().
Table 1. Baseline characteristics of participants and compliance rates.
Enrolled participants were deemed healthy owing to the absence of diagnosed medical conditions or self-reported illnesses (see exclusion criteria), although no specific health assessments were performed. The consumption of probiotic supplements or probiotic-supplemented foods was not allowed, but dairy products and fermented foods were not specifically forbidden; the diet was uncontrolled to preserve the lifelike nature of the study population and avoid introducing a dietary change that could alter microbiota composition.
Daily questionnaires
The daily questionnaire syndromes of gastrointestinal distress, cephalic, epidermal, ear-nose-throat, emetic, and psychological health (Table S2) were concluded equivalent across all intervention groups by period comparisons as were individual symptoms (diarrhea, constipation, hours of sleep, stool frequency) (Table S3). For the score of hours of sleep category, the placebo, five billion and 25 billion CFU groups were concluded equivalent with equivalence value of 0.5. However, the placebo group was concluded nonequivalent to the five billion and 25 billion CFU groups during baseline. In addition, the scores of hours of sleep were nonequivalent between the five billion and the 25 billion CFU groups in week 4 of treatment and the washout period.
Gastrointestinal Symptom Rating Scale
The abdominal pain, diarrhea, and constipation syndromes of the GSRS were concluded equivalent across all intervention groups and periods using a tolerance value of 0.4 (Table S4). Similar results were found for the reflux syndrome (tolerance value of 0.5). For the indigestion syndrome, all comparisons were equivalent with the exception of the placebo and five billion CFU group during the baseline and the second week of treatment.
Bristol Stool Form Scale
The Bristol Stool Form scale was used as a proxy to classify the participants’ transit time into three categories: slow, normal, or fast (Lewis and Heaton Citation1997). The distribution of stool form categories was equivalent between groups (Table S5).
Safety monitoring
Adverse reactions and events were recorded at each study visit to monitor product safety. No adverse events related to the probiotic intervention were reported. No serious adverse events were reported in any of the study arms.
Strain recovery and compliance analyses by qPCR
For the eight strains contained in the supplemented probiotic formulation, recovery from the feces was assessed using strain-specific qPCR assays on samples collected at the baseline (V1), end-of-treatment (V2) and washout (V3) visits. The studied formulation contained four Lactobacillus strains (), as well as two Bifidobacterium strains ( and ), Lactococcus lactis ssp. lactis () and Pediococcus acidilatici (), which were all detectable in a dose-dependent manner in the feces of most participants at end-of-treatment (V2) using strain-specific qPCR assays, as shown by the median level of abundance (red lines).
Figure 3. Abundance of supplemented strains in fecal samples. Dot plots showing the absolute abundance (Log10 bacteria/g wet feces) in all participants for (A) L. rhamnosus R0011, (B) L. helveticus R0052, (C) L. plantarum R1012, (D) L. casei R0215, (E) B. breve R0070, (F) B. longum ssp longum BB536, (G) L. lactis ssp lactis R1058, and (H) P. acidilactici R1001. The red line represents the median. The dashed line represents the minimum amount that can be detected by qPCR for each strain. N.D., Not detected.
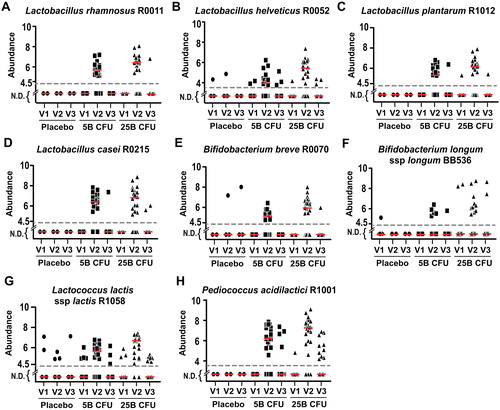
For some strains, a few instances of spurious detection were observed at baseline (V1) in each group receiving the probiotic supplement (, and 3H), although these represent a small percentage of positive detection compared to that observed at the end of the intervention (V2) (). In the placebo group, the six instances of positive detection for Lactoccus lactis ssp. lactis R1058 result from five participants. However, for L. helveticus R0052 and B. breve R0070, instances of positive detection in the placebo group result from a single participant for each strain (Figure S1).
Table 2. Percentage of participants showing positive detection, and persistence rate for each strain.
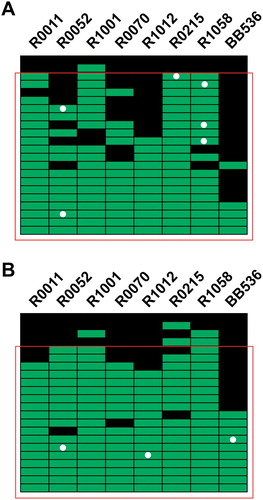
More participants demonstrated positive detection for one of the strains at V1 in the 5B (n = 6) compared to the 25B group (n = 3) (). For most strains, the percentage of positive detection at V2, which represents the proportion of participants with positive recovery of the strain at the end of the intervention, was higher in the 25B than in the 5B group. Of note, this dose-related increase in the proportion of participants with positive detection was observed despite the slightly lower compliance rate for supplement intake in the 25B group based on counting leftover capsules at the end of the intervention period (). To assess whether compliance to the supplement intake could be confirmed by qPCR, we compiled the positive detections for each participant in the 5B () and 25B () groups. In both groups, few participants displayed positive detections for less than two strains. By assuming compliance in participants showing positive detection for at least three strains out of eight, the compliance established by qPCR is ∼ 91% and 82% in the 5B and 25B groups, respectively, which is below the self-reported compliance for supplement intake ().
Figure 4. Compliance analysis by strain-specific qPCR assays. (A) Compliance analysis of participants in the five Billion CFU intervention, (B) and in the 25 Billion CFU intervention. Each line represents one participant, and each column represents a strain. Positive detection at visit 2 (End-of-Treatment) are depicted in green, while the absence of detection is represented by a black square. The white dots denote a participant for which the strain was detected at visit 1 (Baseline). The red square comprises participants with detection of at least three strains out the 8 strains in the supplements.
Strain-specific qPCR assays also revealed that some strains remained detectable at the end of the 7-day washout period (). Interestingly, overall persistence (evaluated as the percentage of positive detections observed at the end of the washout period (V3) over positive detections at V2) appeared to vary in a strain-dependent manner (). Some strains displaying a marginal frequency of positive detections at V3, such as L. rhamnosus R0011 and B. breve R0070, were detected at a similarly low frequency (< 3%) in the control conditions (i.e. placebo group or probiotics groups at baseline). The low frequency or positive detection at V3 for L. plantarum R1012 and L. casei R0215 also suggests a minimal capacity for persistence in the studied population (∼ 7%). For three of the eight strains, namely B. longum BB536, L. helveticus R0052 and L. lactis R0158, the frequency of positive detection was similar in the controls and after the washout period. However, because positive detections at V3 were observed in participants whom had demonstrated an increase at V2, except for 2 instances in the 5B group, the positive detections at V3 can be positively attributed to strain persistence rather than to spurious detection events at both the 5B (Figure S2A) and 25B doses (Figure S2B). For B. longum ssp. longum BB536, although being generally lower in all groups, the frequency of detection increased in a dose-dependent manner at V2 in a subset of participants. Lastly, with its negligible to null frequency of detection in control conditions, the P. acidilactici strain appears to persist strongly after washout (36.8%), and more extensively at the 25B dose than at the 5B dose ( and S2).
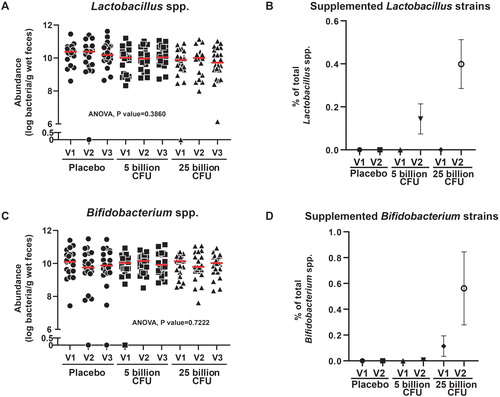
Effect of the intervention on total Lactobacilli and Bifidobacteria abundance
The total Bifidobacteria and Lactobacilli abundance assessed by qPCR were similar between groups or visits (). However, the strain- and genus-specific quantification by qPCR revealed a modest but detectable dose-dependent contribution of the supplemented product at V2, with values of 0.40 ± 0.11% for Lactobacillus strains and 0.51 ± 0.26% for Bifidobacterium strains in the 25B group ().
Figure 5. Absolute levels of Lactobacillus and Bifidobacterium genera in the feces and relative contribution of supplemented Lactobacillus and Bifidobacterium strains. (A) Dot plot showing qPCR results combined from three primer sets, to estimate the abundance of the total Lactobacillus spp. in each participant. (B) Average contribution of supplemented Lactobacillus strains to the Lactobacillus genera in each group. (C) Dot plot showing the qPCR detection of the Bifidobacterium spp. (D) Average contribution of supplemented Bifidobacterium strains to the Bifidobacterium genera in each group. N.D., Not detected.
Microbiota composition analyses
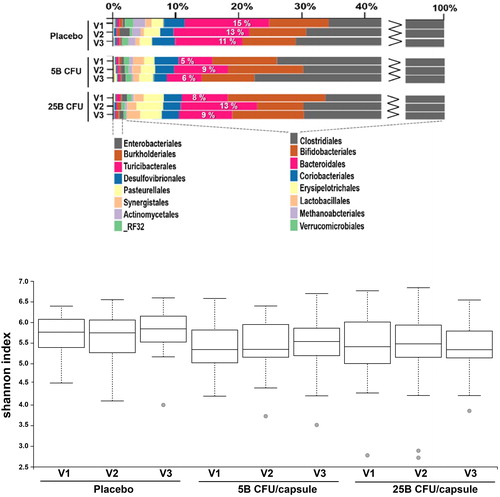
Next, we examined whether the supplemented probiotic formulation could have exerted a broader effect on the gut microflora by extending our analyses to overall microbiota composition using taxonomic abundance and diversity metrics. Hence, the 16S V4 amplicon sequencing data was further examined for trends or changes linked to the interventions with individual samples grouped according to treatment and visit, and general comparisons were performed at the Order level. The Bacteroidales relative abundance increased at V2 in a dose-related manner compared to levels at V1 () and returned near baseline levels at V3 for both the 5B and 25B group, while they remained similar in the placebo group at all three visits. However, we observed no difference between groups in terms of alpha diversity () nor beta-diversity (not shown) according to treatment or visit.
Figure 6. Comparative analysis of microbiota composition and alpha-diversity between groups. (A) Bar chart of taxonomic abundance at the Order level, showing the percentage of Bacteroidales in each group. (B) Box plot showing the distribution of Shannon alpha-diversity index, for participants in each group.
Considering the inherently high dimensionality of microbiome taxonomic attributed datasets (i.e. high variability at baseline), we hypothesized that using a machine learning algorithm could help identify small changes related to the interventions. Indeed, machine learning algorithms, such as the Random Forest (RF) classifier implemented in the MicrobiomeAnalyst online server, are highly indicated to reduce the information into interpretable models and/or classify the samples to predict original grouping based on microbiome composition (Dhariwal et al. Citation2017).
The Random Forest analysis predicted the original metadata category of samples more efficiently (lower error rate) for the 25B than for the 5B group (Figure S3A). The classification was based primarily on Pediococcus abundance in these groups (Figure S3B). Using a bootstrap analysis strategy (n = 23) (Ning et al. Citation2014), Pediococcus remained the main grouping driver in 100% of the analyses, while Holdemania influenced the grouping minimally but consistently (91.3% of the times) (Figure S3C). Other species were identified by the RF classifier with less reproducibility (i.e. between 21.7% and 65.2% of the times). Despite an apparent pattern related to treatment, the Peptostreptococcus original count abundance returned a value of zero for all groups (data not shown). On the other hand, both the Pediococcus and Holdemania genera displayed a pattern of relative abundance related to probiotic supplementation, as seen on the original counts abundance bar graphs (Figure S3D).
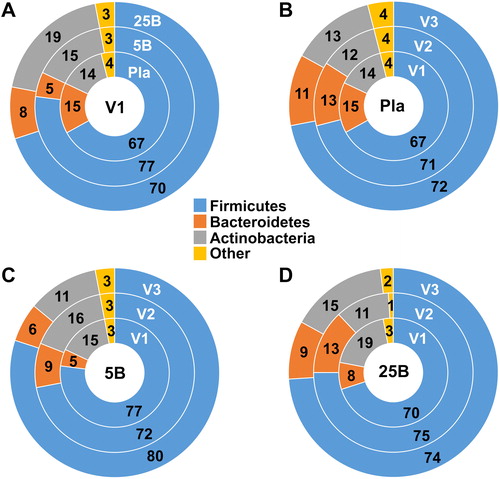
The Firmicutes genus Holdemania was correlated with impaired lipid and glucose metabolism clinical indicators (Lippert et al. Citation2017). Conversely, members of the Bacteroidetes phylum, which comprises the order Bacteroidales, were inversely correlated with metabolic disease parameters as they were enriched in non-obese individuals without metabolic syndrome (Lippert et al. Citation2017). In addition, species from the Bacteroidales order (namely the Bacteroides) have been identified as potential drivers of leanness in another study (Ridaura et al. Citation2013). Considering that Bacteroidales increased at visit 2 in the 5B and 25B groups, while Holdemania decreased during and after probiotic supplement administration, we explored the possibility that the Firmicutes-Bacteroidetes ratio could be influenced by the probiotic supplement.
We therefore looked at the phylum distribution at level 2 in all groups at baseline and observed some marked differences in the relative proportion of Bacteroidetes and Firmicutes between groups (). While it is not possible to extrapolate the reason(s) for this difference between groups at baseline, we wanted to assess if and how probiotic supplementation affected that distribution throughout the study by looking at the within group changes at each of the three visits (). As expected, the phylum distribution remained similar throughout the study in the placebo group (). Conversely, in accordance with results from other analyses, we observed an increase in the relative proportion of Bacteroidetes in both supplemented groups at visit 2 (). However, while the proportion of Firmicutes was found decreased in the 5B group at visit 2 (), it appeared to increase slightly in 25B group at visit 2 ().
Figure 7. Comparative analysis of phyla abundance between groups and visits. Donut charts comparing phyla abundance (A) at baseline (Visit 1) for all groups, and at all visits for (B) the Placebo, (C) Probiotic five Billion, and (D) Probiotic 25 Billion groups. Numbers represent percent abundance. V1, visit 1; V2, visit 2; V3, visit 3; Pla, Placebo group; 5B, five Billion CFU group; 25B, 25 Billion CFU group.
Discussion
Here, in addition to demonstrating the safety of the studied multi-strain formulation in a general adult population through the absence of adverse events, we show that, even at the higher dose, the formulation did not adversely affect the gastrointestinal function nor sleeping patterns in adults deemed generally healthy. Furthermore, as expected in the absence of dysbiosis, the supplemented probiotic formulation contributed to microbiota composition minimally, proportionally to the dose administered, and transiently for most strains. However, some positive changes in microbiota composition could be identified despite the absence of effect of the supplement on microbiota diversity; this was expected considering that microbiota diversity is generally normal in the general adult population.
While all strains contained in the product were recovered from the feces in a dose-dependent manner after the intervention, our results reveal that each strain possessed a specific behavior in terms of persistence after the supplementation period. Only a few studies have used quantitative strain-specific qPCR analyses to monitor the transit of supplemented bacterial strains, most of which focusing on single probiotic strains (Tuohy et al. Citation2007; Ahlroos and Tynkkynen Citation2009; Nagulesapillai et al. Citation2017; Arioli et al. Citation2018; Radicioni et al. Citation2019). However, a study using a 4-strain blend administered at a low (seven billion CFU) and high dose (70 billion CFU) reported results consistent with ours; they observed a longer post-intervention persistence with the higher supplement dose (70 billion CFU) for three out of the four supplemented strains (Taverniti et al. Citation2019). In our study, persistence, which was assessed once after a 7-day washout period, was observed in more participants at the 25B dose than in the 5B dose. Taken together, these studies expose the need, and validate the approach to use, for characterizing single strains within multi-strain probiotic blends in general adult populations.
Indeed, the high level of variability in the composition of a ‘healthy’ or ‘normal’ microbiota is now well recognized (Gevers et al. Citation2012; Falony et al. Citation2016; Lavelle and Hill Citation2019). Many factors have been identified for their fundamental role in shaping an individual’s microbiota composition, including diet, physical activity level, BMI, age, gender, geography, household sharing and cohabitation, pets, blood parameters, stool consistency, medications and health (Dill-McFarland et al. Citation2019; Lavelle and Hill Citation2019). The often arbitrary, co-occurrence of several of these factors explains the high interpersonal variability observed among groups of the general population in terms of microbiota composition, and this despite any appearance of homogeneity based on a pre-determined selection of baseline characteristics (de Boer et al. Citation2015).
To overcome the interpersonal variability observed between groups in terms of microbiota composition at baseline, we used a Random Forest (RF) machine learning algorithm, which successfully classified the samples into the original grouping based on Pediococcus abundance, most likely detecting the supplemented strain P. acidilactici. In addition, the RF algorithm also identified Holdemania as a genus with a minor but consistent effect on the grouping, revealing at the same time that the Holdemania genus was decreased specifically at visit 2 in participants receiving the supplements. The fact that this genus was also decreased at visit 3 (washout) in both the 5B and 25B groups suggests that a persistent effect of the supplemented product on microbiota composition might have occurred, which could possibly be related to the persistence of the supplemented strains. Interestingly, another study reported a decrease in the Firmicutes genus Holdemania in healthy adults following a 1-month course of a probiotic supplement containing Lactobacillus rhamnosus HN001 and Bifidobacterium longum BB536 (Toscano et al. Citation2017).
This study had strengths and limitations. Strengths included the recruitment of a population with minimal exclusion criteria to preserve the lifelike nature of a population considered free from preexisting dysbiosis-associated conditions. To this end, we did not specifically advise against the consumption of fermented foods and all analyses were performed on all participants who completed the trial regardless of their diet or antibiotic consumption during the trial. Only one participant in the 25B group received antibiotics for a skin infection unrelated to the supplement. We cannot exclude that keeping this participant in the analyses could have introduced some variability in the microbiota composition. Another limitation is that the current study examined only short-term safety. Additional research should explore the long-term effects of higher doses of specific probiotics on microbiota profile.
This study demonstrates the safety of the supplemented product, even at the highest dose tested, in a sample of the general adult population independently of baseline microbiota composition interpersonal variability. Supplemented strains were detected in the feces proportionally to the dose administered. Although the supplemented product only affected microbiota composition minimally, the increase in Bacteroidales and decrease in Holdemania following supplement administration suggest that assessing the potential positive impacts of this formulation in individuals with obesity or metabolic disease is warranted based on existing literature. In addition, further characterization of individual strain persistence using time-course analyses is required and should be assessed in future studies.
ijds_a_1749751_sm3093.zip
Download Zip (10.1 MB)Declaration of interest
The work was supported by a grant from Lallemand Inc. WJD, ALF, AF and MC report no conflict of interest. AT, AP, VN, JA, CWM and TAT are employees of the Rosell Institute for Microbiome and Probiotics, the research group of Lallemand Health Solutions Inc.
Additional information
Notes on contributors
Annie Tremblay
Dr. Annie Tremblay joined the Rosell Institute for Microbiome and Probiotics (RIMaP) in October 2018. She holds a Ph.D. in Biochemistry from McGill University, a M.Sc. in Pharmaceutical Sciences, and a B.Sc. in Biomedical Sciences from the University of Montreal. As a professional medical writer certified (MWC®) by the American Medical Writers Association, Dr Tremblay is responsible for writing scientific and medical content for both the clinical and the pre-clinical research platforms of the RIMaP.
Asmaa Fatani
Ms. Asmaa Fatani holds a B.S from King Abdul Aziz University (KAU)(2006) and a MS in Food Science and Nutrition from the University of Florida (2016). She is currently pursuing a doctoral program in Nutritional Sciences at University of Florida and is expected to earn her degree in 2021.
Amanda L. Ford
Dr. Amanda L. Ford holds a M.S. in Management from the Hough Graduate School of Business (2011) and a PhD in Nutritional Sciences (2017) with a minor in Agricultural Education and Communication from the University of Florida. She is currently the Nutrition Manager for Red Lobster Corporation.
Amanda Piano
Ms. Amanda Piano joined the Rosell Institute for Microbiome and Probiotics (RIMaP) as a Research Scientist in February 2018. She is responsible for the strain-specific primer design to quantify Lallemand probiotic strains in clinical samples by quantitative Real-Time PCR to ensure participant compliance and strain persistence. Ms. Piano has implemented an automated pipeline for clinical sample analyses, including the automation of both DNA extraction and 384-well Real-Time PCR plate preparation. Before joining the RIMaP, Ms Piano completed her M.Sc. in Biology at Concordia University followed by a Graduate Certificate in Biotechnology at McGill University.
Varuni Nagulesapillai
Ms. Varuni Nagulesapillai joined Lallemand in 2013 while pursuing a Master in Biotechnology at McGill University, which she obtained in 2014. As a Research Scientist in the RIMaP clinical laboratories, she developed and implemented a primer design pipeline and real-time PCR (qPCR) assays for the detection and quantification of probiotic strains in clinical samples. She now holds a Clinical Research Specialist position within the clinical research team, in which she manages clinical trials developed and supported by Lallemand Health Solutions.
Jeremie Auger
Mr. Jérémie Auger joined the Rosell Institute for Microbiome and Probiotics (RIMaP) in 2018, after completing a M.Sc. in Pharmacology at the University of Montreal, where he explored a well-known Drug-Drug interaction (between digoxin and antibiotics) for which he proposed a new mechanism of action stipulating that the interaction was likely explained by the enzymatic activity of a widely hosted gut microbe (Eggerthella lenta). At the RIMaP, Mr Auger is working on clinical and pre-clinical microbiome and mycobiome datasets (including 16S, WGS and ITS datasets). Mr Auger is responsible for implementing state-of-the-art data analysis pipelines and for interpreting microbiome sequencing results using the latest bioinformatics tools and newest software available, with the ultimate goal of understanding the effects of probiotics on human microbiomes.
Chad W. MacPherson
Mr. Chad W. MacPherson has joined the Rosell Institute for Microbiome and Probiotics in 2011 as a Pre-Clinical Laboratory Manager and Research Scientist. He holds a Master’s in Applied Biotechnology from McGill University, as well as a Graduate Diploma in Genomics and Biotechnology and a BSc in Cell and Molecular Biology from Concordia University. Mr. MacPherson leads projects aimed at evaluating probiotics host-microbe interactions in vitro using various human cell models, as well as the evaluation of the role of probiotics on gut microbiota, microbiome and resistome of human participants.
Mary C. Christman
Dr. Mary C. Christman received her PhD in mathematical statistics from George Washington University in 1993 and, before starting her own company, was a professor at American University, University of Maryland, and most recently University of Florida. Mary currently owns MCC Statistical Consulting LLC, located in Gainesville, FL, USA, a small business that provides statistical support for a variety of projects. Consultancy areas include clinical trials, environmental and ecological projects, and agricultural research. In addition to providing statistical support, the firm also offers statistics training workshops.
Thomas A. Tompkins
Dr. Thomas A. Tompkins is the Research Director at the Rosell Institute for Microbiome and Probiotics, the research groups of Lallemand Health Solutions, since 1999 where he has established a strong scientific program to evaluate the pre-clinical and clinical effects of probiotics. His team evaluates the safety and molecular mechanisms of action of probiotics in human cell systems, and novel in vivo models. His current focus is the complex role played by the microbiota in gastrointestinal and neurological disorders. In particular, he is interested in identifying the impact of probiotics in modulating the functionality of the brain-gut-microbiome axis and in alleviating the symptoms associated with gastrointestinal and other mucosa-related disorders.
Wendy J. Dahl
Dr. Wendy J. Dahl is an Associate Professor and Extension Specialist in the Food Science and Human Nutrition Department, University of Florida, and an adjunct faculty with the College of Pharmacy and Nutrition, University of Saskatchewan. She leads research examining how diet composition, and probiotic, prebiotic and fiber supplementation modulate gut microbiome and health.
References
- Ahlroos T, Tynkkynen S. 2009. Quantitative strain-specific detection of Lactobacillus rhamnosus GG in human faecal samples by real-time PCR. J Appl Microbiol. 106(2):506–514.
- Alyousif Z, Miller J, Sandoval M, MacPherson C, Nagulesapillai V, Dahl WJ. 2018. The effects of Bifidobacterium animalis ssp. lactis B94 on gastrointestinal function in adults with Prader-Willi syndrome: a randomized, placebo-controlled, double-blind study. Trials. 19(1):256. doi:10.1186/s13063-018-2648-x.
- Amir A, McDonald D, Navas-Molina JA, Kopylova E, Morton JT, Xu ZZ, Kightley EP, Thompson LR, Hyde ER, Gonzalez A, et al. 2017. Deblur rapidly resolves single-nucleotide community sequence patterns. mSystems. 2(2):e00191–16. doi:10.1128/mSystems.00191-16.
- Arioli S, Koirala R, Taverniti V, Fiore W, Guglielmetti S. 2018. Quantitative recovery of viable Lactobacillus paracasei CNCM I-1572 (L. casei DG(R)) after gastrointestinal passage in healthy adults. Front Microbiol. 9:1720.
- Bolyen E, Rideout JR, Dillon MR, Bokulich NA, Abnet CC, Al-Ghalith GA, Alexander H, Alm EJ, Arumugam M, Asnicar F, et al. 2019. Reproducible, interactive, scalable and extensible microbiome data science using QIIME 2. Nat Biotechnol. 37(8):852–857.
- Bokulich NA, Subramanian S, Faith JJ, Gevers D, Gordon JI, Knight R, Mills DA, Caporaso JG. 2013. Quality-filtering vastly improves diversity estimates from Illumina amplicon sequencing. Nat Methods. 10(1):57–59. doi:10.1038/nmeth.2276.
- Craig CL, Marshall AL, Sjostrom M, Bauman AE, Booth ML, Ainsworth BE, Pratt M, Ekelund U, Yngve A, Sallis JF, et al. 2003. International physical activity questionnaire: 12-country reliability and validity. Med Sci Sports Exerc. 35(8):1381–1395.
- de Boer MR, Waterlander WE, Kuijper LDJ, Steenhuis IHM, Twisk J. 2015. Testing for baseline differences in randomized controlled trials: an unhealthy research behavior that is hard to eradicate. Int J Behav Nutr Phys Act. 12(1):4. doi:10.1186/s12966-015-0162-z.
- DeSantis TZ, Hugenholtz P, Larsen N, Rojas M, Brodie EL, Keller K, Huber T, Dalevi D, Hu P, Andersen GL. 2006. Greengenes, a chimera-checked 16S rRNA gene database and workbench compatible with ARB. Appl Environ Microbiol. 72(7):5069–5072. doi:10.1128/AEM.03006-05.
- Dhariwal A, Chong J, Habib S, King IL, Agellon LB, Xia J. 2017. MicrobiomeAnalyst: a web-based tool for comprehensive statistical, visual and meta-analysis of microbiome data. Nucleic Acids Res. 45(W1):W180–W188. doi:10.1093/nar/gkx295.
- Dill-McFarland KA, Tang ZZ, Kemis JH, Kerby RL, Chen G, Palloni A, Sorenson T, Rey FE, Herd P. 2019. Close social relationships correlate with human gut microbiota composition. Sci Rep. 9(1):703. doi:10.1038/s41598-018-37298-9.
- Dolan KE, Finley HJ, Burns CM, Gasta MG, Gossard CM, Parker EC, Pizano JM, Williamson CB, Lipski EA. 2016. Probiotics and disease: a comprehensive summary-part 1, mental and neurological health. Integr Med. 15(5):46–58.
- Falony G, Joossens M, Vieira-Silva S, Wang J, Darzi Y, Faust K, Kurilshikov A, Bonder MJ, Valles-Colomer M, Vandeputte D, et al. 2016. Population-level analysis of gut microbiome variation. Science. 352(6285):560–564. doi:10.1126/science.aad3503.
- Finley HJ, Gasta MG, Dolan KE, Pizano JM, Gossard CM, Williamson CB, Burns CM, Parker EC, Lipski EA. 2018. Probiotics and disease: a comprehensive summary-part 8, gastrointestinal and genitourinary disorders. Integr Med. 17(1):38–48.
- Ford AL, Nagulesapillai V, Piano A, Auger J, Girard SA, Christman M, Dahl WJ. 2020. Gastrointestinal tolerance and microbiota stability with a high protein diet with and without a prebiotic, probiotic and synbiotic: a randomized, double-blind, placebo-controlled trial in older women. J Acad Nutr Diet. 120(4):500–516. doi:10.1016/j.jand.2019.12.009.
- Gevers D, Knight R, Petrosino JF, Huang K, McGuire AL, Birren BW, Nelson KE, White O, Methé BA, Huttenhower C. 2012. The Human Microbiome Project: a community resource for the healthy human microbiome. PLoS Biol. 10(8):e1001377. doi:10.1371/journal.pbio.1001377.
- Gopalakrishnan V, Helmink BA, Spencer CN, Reuben A, Wargo JA. 2018. The influence of the gut microbiome on cancer, immunity, and cancer immunotherapy. Cancer Cell. 33(4):570–580. doi:10.1016/j.ccell.2018.03.015.
- Greenhalgh K, Meyer KM, Aagaard KM, Wilmes P. 2016. The human gut microbiome in health: establishment and resilience of microbiota over a lifetime. Environ Microbiol. 18(7):2103–2116. doi:10.1111/1462-2920.13318.
- Hampe CS, Roth CL. 2017. Probiotic strains and mechanistic insights for the treatment of type 2 diabetes. Endocrine. 58(2):207–227. doi:10.1007/s12020-017-1433-z.
- Kriss M, Hazleton KZ, Nusbacher NM, Martin CG, Lozupone CA. 2018. Low diversity gut microbiota dysbiosis: drivers, functional implications and recovery. Curr Opin Microbiol. 44:34–40. doi:10.1016/j.mib.2018.07.003.
- Kristensen NB, Bryrup T, Allin KH, Nielsen T, Hansen TH, Pedersen O. 2016. Alterations in fecal microbiota composition by probiotic supplementation in healthy adults: a systematic review of randomized controlled trials. Genome Med. 8(1):52. doi:10.1186/s13073-016-0300-5.
- Kruskal WH, Wallis WA. 1952. Use of ranks in one-criterion variance analysis. J Am Stat Assoc. 47(260):583–621. doi:10.1080/01621459.1952.10483441.
- Lavelle A, Hill C. 2019. Gut microbiome in health and disease: emerging diagnostic opportunities. Gastroenterol Clin North Am. 48(2):221–235. doi:10.1016/j.gtc.2019.02.003.
- Lewis SJ, Heaton KW. 1997. Stool form scale as a useful guide to intestinal transit time. Scand J Gastroenterol. 32(9):920–924. doi:10.3109/00365529709011203.
- Lippert K, Kedenko L, Antonielli L, Kedenko I, Gemeier C, Leitner M, Kautzky-Willer A, Paulweber B, Hackl E. 2017. Gut microbiota dysbiosis associated with glucose metabolism disorders and the metabolic syndrome in older adults. Benef Microbes. 8(4):545–556. doi:10.3920/BM2016.0184.
- MacPherson CW, Mathieu O, Tremblay J, Champagne J, Nantel A, Girard S-A, Tompkins TA. 2018. Gut bacterial microbiota and its resistome rapidly recover to basal state levels after short-term amoxicillin-clavulanic acid treatment in healthy adults. Sci Rep. 8(1):11192. doi:10.1038/s41598-018-29229-5.
- Mazloom K, Siddiqi I, Covasa M. 2019. Probiotics: how effective are they in the fight against obesity? Nutrients. 11(2):258. doi:10.3390/nu11020258.
- McDonald D, Clemente JC, Kuczynski J, Rideout JR, Stombaugh J, Wendel D, Wilke A, Huse S, Hufnagle J, Meyer F, et al. 2012. The Biological Observation Matrix (BIOM) format or: how I learned to stop worrying and love the ome-ome. GigaSci. 1(1):7. doi:10.1186/2047-217X-1-7.
- Mennini M, Reddel S, Arasi S, Del Chierico F, Napolitano T, Riccardi C, Fierro V, Vernocchi P, Putignani L, Fiocchi AG. 2019. Colonization and persistence capacity of a multi-strain probiotic in food allergy. J Allergy ClinImmunol. 143(2):AB229. doi:10.1016/j.jaci.2018.12.699.
- Nadeem I, Rahman MZ, Ad‐Dab’bagh Y, Akhtar M. 2019. Effect of probiotic interventions on depressive symptoms: a narrative review evaluating systematic reviews. Psychiatry Clin Neurosci. 73(4):154–162. doi:10.1111/pcn.12804.
- Nagulesapillai V, Belvis J, Tompkins T, Girard S-A. 2017. Detection and quantification of probiotic strains in clinical fecal samples of healthy adults by real-time PCR. The FASEB Journal 31(1_suppl):lb207.
- Ning H, Van Horn L, Shay CM, Lloyd-Jones DM. 2014. Associations of dietary fiber intake with long-term predicted cardiovascular disease risk and C-reactive protein levels (from the National Health and Nutrition Examination Survey Data [2005-2010]). Am J Cardiol. 113(2):287–291. doi:10.1016/j.amjcard.2013.09.020.
- Parker EA, Roy T, D'Adamo CR, Wieland LS. 2018. Probiotics and gastrointestinal conditions: an overview of evidence from the Cochrane Collaboration. Nutrition. 45:125–134.e111. doi:10.1016/j.nut.2017.06.024.
- Pedregosa F, Varoquaux G, Gramfort A, Michel V, Thirion B, Grisel O, Blondel M, Prettenhofer P, Weiss R, Dubourg V. 2011. Scikit-learn: machine learning in Python. J Mach Learn Res. 12:2825–2830.
- Pizano JM, Williamson CB, Dolan KE, Gossard CM, Burns CM, Gasta MG, Finley HJ, Parker EC, Lipski EA. 2017. Probiotics and disease: a comprehensive summary-part 7, immune disorders. Integr Med. 16(5):46–57.
- Radicioni M, Koirala R, Fiore W, Leuratti C, Guglielmetti S, Arioli S. 2019. Survival of L. casei DG® (Lactobacillus paracasei CNCMI1572) in the gastrointestinal tract of a healthy paediatric population. Eur J Nutr. 58(8):3161–3170. doi:10.1007/s00394-018-1860-5.
- Revicki DA, Wood M, Wiklund I, Crawley J. 1998. Reliability and validity of the Gastrointestinal Symptom Rating Scale in patients with gastroesophageal reflux disease. Qual Lif Res. 7(1):75–83.
- Ridaura VK, Faith JJ, Rey FE, Cheng J, Duncan AE, Kau AL, Griffin NW, Lombard V, Henrissat B, Bain JR, et al. 2013. Gut microbiota from twins discordant for obesity modulate metabolism in mice. Science. 341(6150):1241214. doi:10.1126/science.1241214.
- Sommer F, Anderson JM, Bharti R, Raes J, Rosenstiel P. 2017. The resilience of the intestinal microbiota influences health and disease. Nat Rev Microbiol. 15(10):630–638. doi:10.1038/nrmicro.2017.58.
- Tang WHW, Backhed F, Landmesser U, Hazen SL. 2019. Intestinal microbiota in cardiovascular health and disease: JACC state of-the-art review. J Am Coll Cardiol. 73(16):2089–2105. doi:10.1016/j.jacc.2019.03.024.
- Taverniti V, Koirala R, Dalla Via A, Gargari G, Leonardis E, Arioli S, Guglielmetti S. 2019. Effect of cell concentration on the persistence in the human intestine of four probiotic strains administered through a multispecies formulation. Nutrients. 11(2):285. doi:10.3390/nu11020285.
- Toscano M, De Grandi R, Stronati L, De Vecchi E, Drago L. 2017. Effect of Lactobacillus rhamnosus HN001 and Bifidobacterium longum BB536 on the healthy gut microbiota composition at phyla and species level: a preliminary study. WJG. 23(15):2696–2704. doi:10.3748/wjg.v23.i15.2696.
- Tuohy KM, Pinart-Gilberga M, Jones M, Hoyles L, McCartney AL, Gibson GR. 2007. Survivability of a probiotic Lactobacillus casei in the gastrointestinal tract of healthy human volunteers and its impact on the faecal microflora. J Appl Microbiol. 102(4):1026–32. doi:10.1111/j.1365-2672.2006.03154.x.
- Wallace CJK, Milev R. 2017. The effects of probiotics on depressive symptoms in humans: a systematic review. Ann Gen Psychiatry. 16(1):14. doi:10.1186/s12991-017-0141-7.
- Williamson CB, Burns CM, Gossard CM, Pizano JM, Dolan KE, Finley HJ, Gasta MG, Parker EC, Lipski EA. 2017. Probiotics and disease: a comprehensive summary-part 3, cardiometabolic disease and fatigue syndromes. Integr Med. 16(1):30–41.