
ABSTRACT
Recent studies demonstrate that sperm epigenome is a vehicle that conveys paternal experiences to offspring phenotype. That evidence triggers interest of both experimental and epidemiological studies of epigenetic markers in sperm. Since samples are often unique in epidemiological studies, a careful and efficient use of the material is a critical requirement. The goal of this study was to provide optimization of methods for the isolation of small RNAs from spermatozoa and library preparation for sequencing. A total 67 fractionated sperm samples from the Russian Children’s Study biobank prospectively collected at 18–20 years of age were used to isolate small RNAs with median (IQR) input total sperm count 17.0 (7.4-35.9) million. Twenty-four pairs of libraries were prepared using the NEBNext and NEXTFlex kits, 19 libraries using NEBNext and 6 using NEXTFlex. All libraries were sequenced on NextSeq 500, and the results were evaluated as a function of the number of small non-coding RNA (sncRNA) detected, quality parameters of sequencing libraries, as well as technical features of sample preparation. Although the same amount of miRNA input was used for NEBNext and NEXTFlex libraries, the concentration of DNA in NEBNext libraries was significantly higher in comparison with NEXTFlex libraries. In high input (sperm count >28 million and more than 25 ng miRNA in library) NEXTFlex Small RNA-Seq kit detected more microRNAs. In low input, the NEBNext proved more effective. The tricks and traps to protocol optimization are presented, including an efficient and effector gel-based system for the removal of sequencing library adaptors.
Introduction
The interest in sperm epigenetic markers in both experimental and epidemiological studies is growing. The prospective cohort from the Russian Children’s Study is investigating natural and environment-induced changes, including epigenetic alterations in males extending from the peripubertal period to young adulthood. Spermatozoa have been traditionally deemed vehicles for the transfer of the paternal haploid genome upon fertilization; however, epigenetic marks on sperm (e.g., DNA methylation, histone modifications and small non-coding RNA) can act as a legacy of environmental exposures encountered throughout the life-course that affect early–life development and offspring phenotype (Wu et al. Citation2015; Marcho et al. Citation2020; Suvorov et al. Citation2020). Recently, we showed that the sperm methylome is altered by peripubertal dioxin exposure (Pilsner et al. Citation2018). Another epigenetic mechanism (He et al. Citation2009; Hutcheon et al. Citation2017; Sharma et al. Citation2018; Zhang et al. Citation2019; Suvorov et al. Citation2020) is perhaps mediated by small noncoding RNA (sncRNA). Increasing evidence indicates that sperm sncRNA is an important vehicle connecting paternal experiences with phenotypes of their offspring (Yan Citation2014; Chen et al. Citation2016). Despite their small size (22-30 nt), small RNA species (in particular, microRNA) have proven to be an important effector of gene expression. Their effect on the state of various organs (Torres et al. Citation2018; Humphreys et al. Citation2019) throughout the human body has been extended to sperm (Sendler et al. Citation2013; Jodar et al. Citation2015; Estill et al. Citation2019b).
Semen samples used in epidemiological studies generally span a wide range of varying sperm concentrations. Their use in multiple assays (e.g., DNA methylation, DNA integrity, sncRNA profiles) presents a challenge with a limited amount of biospecimen that is routinely available. Isolation of RNA (including sncRNA) from spermatozoa is not an easy task: a rigid cell membrane prevents destruction by simple lysis. Low number of cells, low quantity of RNA in sperm cells (~50 fg per cell), and a low content of small RNA ~ 0.3 fg per cell (Goodrich et al. Citation2013) in comparison to 3.5 pg of DNA (in each haploid spermatozoon) requires careful processing of samples to procure RNA and sncRNA material.
The study aimed to optimize RNA extraction methods and sncRNA library preparation from human sperm samples over a wide range of input quantities of cells.
For comparison, in this study, NEBNext Multiplex Small RNA Library Prep Set for Illumina (New England Biolabs, Ipswich, MA, USA); and NEXTFlex Small RNA-Seq Kit v3 (PerkinElmer, Waltham, MA, USA) were compared as both have been used in sperm small RNA studies (Krawetz et al. Citation2011; Ribeiro et al. Citation2018; Estill et al. Citation2019a). All small RNA kits generate a large number of adapter dimers, which are not informative during sequencing. We compared the various procedures as a function of the parameters of the final libraries (final amount and percentage of adapter’s dimers) and correspondence of the obtained sncRNA diversity.
Results and discussion
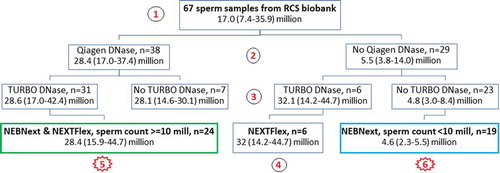
A flow-chart of the sample isolation summarizing the various stages with information about input sperm count in samples is shown in .
Figure 1. Flow-chart of sperm samples used in the study with information about median (interquartile range, IQR) of input sperm count. 1 – 67 initially sperm samples from RCS (Russian Children Study) biobank; 2 – step of treatment by Qiagen DNase; 3 – step of treatment by TURBO DNase; 4 – libraries treated by TURBO DNase prepared by NEXTFlex; 5 – comparative experiment using 24 library pairs prepared by NEBNext and NEXTFlex from samples with high input sperm count (≥10 million) and treated by Qiagen and TURBO DNases; 6 – libraries from low input sperm count (<10 million) constructed by NEBNext and no use any DNase
Optimization of RNA isolation techniques and use of DNase
The protocol from Goodrich et al was modified for total RNA isolation according to the Qiagen miRNeasy Mini Kit manual (Goodrich et al. Citation2013; Qiagen Citation2020). The protocol includes homogenization of spermatozoa using a Disruptor Genie homogenizer with stainless steel beads, isolation of RNA using a Qiagen kit’s, buffer, and columns. After homogenization, the supernatant was removed, to which 1.5 vol of 100% alcohol was added, and total RNAs were bound to the column. After washing, total RNAs were eluted with 70°C RNase-Free H2O. Turbo DNase treatment followed the addition of RNase Block and DTT for long–term storage of RNA and the subsequent preparation of sequencing libraries from total RNA. We preferred excluding the step of enriched sncRNA fraction isolation because adapters that are used in sncRNA library preparation kits primarily ligate to the ends of the small RNAs. We also introduced a step of preheating of elution water up to 70°C.
We paid particular attention to the DNase treatment step, as its use involved incubation at room temperature. Using the following protocols:
DNase (Qiagen) on column during RNA extraction (15–20 minute incubation at room temperature);
Turbo DNase (Thermo Fisher Scientific) after isolation in the final RNA solution (15-20 minutes at 37°C);
Treatment by Qiagen DNase first on column during RNA extraction followed by Turbo DNase treatment after isolation in the final RNA solution.
Even though sncRNA adapters are specific in relation to the microRNA itself, traces of DNA would affect determining the concentration of small RNA.
MicroRNA quantity in RNA samples was assessed using Qubit fluorometer only as estimation by Bioanalyzer 2100 (Agilent, USA) did not have sufficient sensitivity. The work of (Garcia–Elias et al. Citation2017) confirmed that fluorescent measurements of Qubit provided the most accurate quantification of miRNA content.
shows that using Qiagen DNase, the miRNA yield is low regardless of the initial sperm count (up to 20 million sperms). If DNase is not used for isolation on columns, the miRNA yield increases with an increase in the number of spermatozoa, even at low concentrations (less than 10 million spermatozoa). Qiagen DNase did not have RNase activity (tested in preliminary experiments, data not shown).
Figure 2. Association of input sperm count and miRNA concentration after RNA isolation (A) and DNA concentration after RNA isolation (B) by usage of DNase (Qiagen DNase, n = 12, vs no DNase, n = 23), subset of samples with input sperm count below 20 million
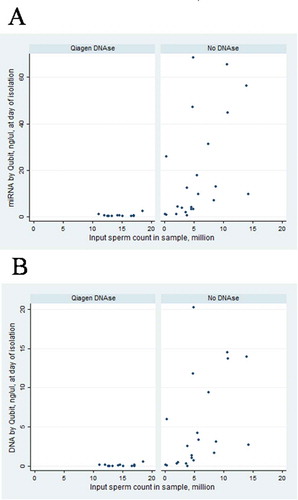
To determine DNase treatment’s efficiency, we measured DNA concentration using the Qubit fluorometer after RNA isolation in the same samples. Treatment with Qiagen DNase leads to a dramatic decrease in DNA in comparison with no DNase treatment (), median (interquartile range, IQR) DNA concentration was 0.07 (0–0.5) ng/μl after treatment with Qiagen DNase, n = 38, and 3.8 (0.9–13.8) ng/μl without DNase, n = 29, p< 0.0000. However, DNase treatment also decreased miRNA concentration, 0.9 (0.5–11) ng/μl after treatment with Qiagen DNase and 13 (3.8-48.4) ng/ul without DNase, p< 0.0002. Moreover, traces of DNA determined by PCR with PRM1-primers were observed in all cases after Qiagen on–column DNase treatment. It should be noted that excitation/emission wavelengths for DNA HS and miRNA dyes in the Qubit Assays are very close to each other and can overlap: 500/530 nm for DNA HS and 500/520 for miRNA) (Thermo Fisher Scientific Citation2020). The concentration of microRNAs may be overestimated. To check the amount of microRNA in the sample and to eliminate residual DNA, several samples were additionally treated with Turbo DNase (both after isolation using Qiagen DNase and after isolation without DNase). No traces of DNA by PRM1 PCR or Qubit were detected after Turbo DNase. However, additional treatment by Turbo DNase decreased the low miRNA concentration. The median (IQR) miRNA concentration was 1.12 (0.5–11.2) ng/ul before and 0.5 (0.3–12.2) ng/ul, p < 0.0006 after the additional treatment by Turbo DNase in 31 samples, however not so dramatic in comparison with treatment by Qiagen DNase. Thus, based on the results of the amplification control, it is evident that Turbo DNase removes the DNA from the sample. However, the use of the two types of DNases leads to a significant decrease in miRNA concentration, particularly after Qiagen DNase treatment.
In comparison to the low yield samples described above, when we treated six samples with moderate and high input sperm count (median (IQR) 32.1 (14.2–44.7) million) with Turbo DNase, sufficient miRNA remained (median (IQR) 52.4 (21.8–60.4) ng/μl before and 10.8 (8.6–15.6) ng/μl, p< 0.03) for successful library preparation (, box 4) with median (IQR) miRNA quantity in library 86.4 (68.8–124.8) ng, DNA quantity in library 17 (5.5–45.3) nM and total reads number 6.7 (4.3–8.4) million.
To evaluate the influence of the Turbo DNase treatment on the profile of sncRNA, we conducted experiments using two pairs of libraries prepared from the same ejaculate by two kits, NEXTFlex and NEBNext, treated and untreated by Turbo DNase. Samples were of high quality: the ejaculate had a high sperm count (84 million), input miRNA concentrations for library preparation were high (30–200 ng/μl), and samples were sequenced to a depth of 6-24 million reads/library. Characteristics of RNA isolation, library preparation, and results of sequencing for four individual samples and pairs are presented in .
Table 1. Comparison of libraries obtained from samples treated and untreated by Turbo DNAse
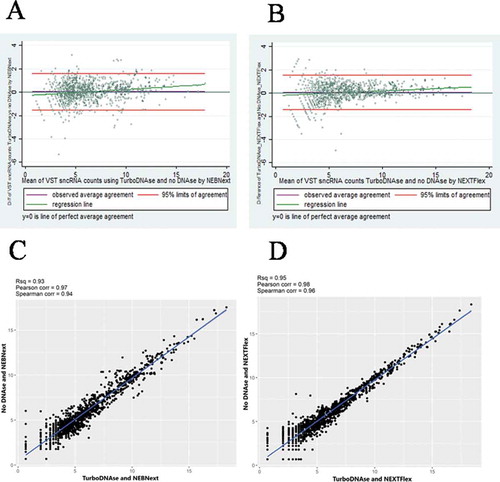
Lin’s concordance correlation and Bland–Altman analysis were used to compare protocols. Variance stabilizing transformed (VST) sncRNA counts obtained in pairs using Turbo DNase treatment and no DNase treatment were compared separately. sncRNA counts were in excellent agreement between the no DNase treated and Turbo DNase treated samples for both kits as presented on scatter and Bland–Altman plots (). Lin’s concordance correlation coefficient (rho_c) between 1,273 sncRNA with counts≥10 (327 miRNA, 466 piRNA, 480 tRNA) treated by Turbo DNase and not treated was 0.97 (95% CI 0.96 to 0.97) for NEBNext, and 0.98 (95% CI 0.97 to 0.98) for NEXTFlex, (both p< 0.000). Limits of agreement were very similar for both kits, from −1.5 to 1.6 with a mean bias of 0.05 for NEBNext and from − 1.4 to 1.5 with a mean bias of 0.05 for NEXTFlex. Classes of sncRNAs, including miRNA, piRNA, and tRNA, were highly concordant between treatment vs no treatment by DNase for both kits (data not shown).
Figure 3. Bland–Altman difference plots (A, B) and corresponding scatter plots (C, D) comparing variance stabilizing transformed sncRNA counts using Turbo DNase treatment and no DNase treatment obtained separately by NEBNext (A, C) and NEXTFlex (B, D) kits
Therefore, it can be concluded that using high input sperm count, the lack of treatment by DNase did not affect the profile of scnRNA complexity. The data suggest that to maximize the amount of RNA available for library construction, DNase treatment can be omitted when RNA is isolated from samples with low (1-10 million) and ultra–low (<1 million) sperm counts.
Comparison of NEBNext vs. NEXTflex small RNA libraries
For comparison, 24 sperm samples with a sperm count of greater than 10 million sperm in the sample were selected, and total RNA was isolated (, box 5). The median (IQR) for sperm input and miRNA yield was 28.4 (15.9–44.7) million sperms and 0.65 (0.31–13.1) ng/million sperms, respectively. NEBNext and NEXTflex libraries were prepared and sequenced. Library efficiencies were initially compared as a function of miRNAs library yield using a Qubit fluorometer and a Bioanalyzer 2100 (). This was extended to include miRNA and DNA amount in the library, the total number of reads and total number of unique reads as summarized in Supplementary Figure 1.
Table 2. Characteristics of libraries obtained by NEBNext and NEXTflex kits
Although median (IQR) levels of input miRNA measured by Qubit in both the NEBNext and NEXTFlex libraries were the same, 5.2 (2.5–105) ng, the median (IQR) concentrations of DNA after library prepartionpreparation were significantly higher using NEBNext, 11.8 (4.9–21.3) nM, in comparison with NEXTFlex, 0.2 (0-2.1) nM, p< 0.000 ().
The NEXTflex library preparation was characterized by fewer adapter dimers and did not require gel purification. However, when small amounts of RNA are used, amplification can be excessive, leading to increased adapter dimers necessitating gel purification. In contrast, the NEBNext libraries are characterized by a higher amount of product ().
Comparative parameters of the sequencing results presented in showed that 7 of 24 libraries prepared by NEXTFlex were of inferior quality (total reads less than 50,000 (Estill et al. Citation2019a) and were excluded from further high–pass sequencing and sncRNA profile analysis. Of the 39 NEXTFlex libraries prepared, 12 failed with less than 50,000 reads.
The NEXTflex technique includes at least three bead purification steps, impairs the automation and scalability of sample preparation, and increases the probability of sample loss. This feature of the NEXTFlex has been noted by others (Yeri et al. Citation2018).
Comparison of library preparation methods
Sequencing showed that the total number of reads for NEXTflex libraries varies from 0.6 (25th percentile) to 2.0 million (75th percentile). The NEBNext kit showed significantly higher number of total reads, median (IQR) was 5.2 (2.0–9.3) million (p < 0.01), and a tendency of more total unique reads in comparison with NEXTFlex (median (IQR) = 1.0 (0.6–1.2) million and 0.5 (0.09–1.5) million, respectively, p < 0.24; )”, Using a threshold for total unique reads of >250 000, 11 (46%) samples prepared by NEXTFlex and 20 (83%) by NEBNext met sequencing quality criteria.
In terms of technical practice, most of the procedures throughout library preparation by NEBNext are performed in one tube, which minimizes the chance of sample loss. However, it must be noted that libraries prepared with NEBNext contain a large percentage of adapter dimers in comparison with NEXTflex libraries (), which requires the gel purification of libraries.
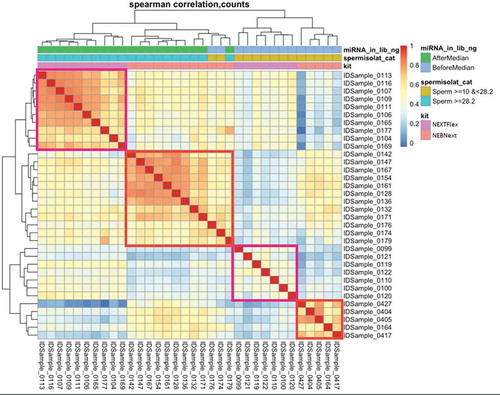
The distribution of four different types of sncRNA fractions across 17 paired samples (Supplementary ) was similar to the distribution of the same sncRNA types across independent sperm samples (Supplementary ) (Hua et al. Citation2019) mapped using our bioinformatics pipeline. The median (IQR) percent of reads mapping to miRNA, piRNA, tRNA, and rRNA was 11.6 (5.1–14.5)%, 19.3 (15.1–24.6)%, 20.2 (14.2–31.3)%, and 47 (31.5-58.7)%, respectively, of all reads mapped to 4 types of sncRNA in our study. To compare the miRNA composition of the NEBNext and NEXTflex libraries, principal components analysis based on sncRNA expression () and clustering heatmap of Spearman correlation coefficients between sncRNA count () was conducted. Interestingly, sncRNA profile was library–dependent. No differences were found by cryoprotectant use () and by fractionated sperm layer (). The clustering heatmap of Spearman correlation coefficients used three factors: input miRNA quantity of samples grouped by the median of 25.8 ng; input sperm count grouped by the median of 28.2 million; and library preparation by either NEXTFlex or NEBNext (). Not surprisingly, clustering by input sperm count mirrors the clustering by input miRNA quantity. Two clear separate clusters of high Spearman correlation coefficient between libraries prepared either by NEXTFlex (shown in the left upper corner) or by NEBNext (around the center of heatmap) were apparent. This showed that the greater number of input sperm parallels miRNA input (r= 0.6 and higher) for both preparations. Similarly, for lower input sperm samples and reduced miRNA quantity, the clustering is better within a protocol, shown in the right low corner for NEBNext and right closer to the center cluster for NEXTFlex. However correlation coefficients are smaller for NEXTFlex (ranged 0.3–0.5) compared to NEBNext (ranged 0.5-0.8).
Figure 4. Principal components analysis (PCA) plot of 34 samples (17 pairs) based on their sncRNA expression with the colors represent the two kits (NEBNext – light blue; NEXTFlex – red), the size of the points representing the 5 groups of total unique reads and the shape representing the cryoprotectant use for semen storage (A; no cryoprotectant – circle, cryoprotectant – triangle) and sperm layer (B; bottom layer – circle, upper layer – triangle)
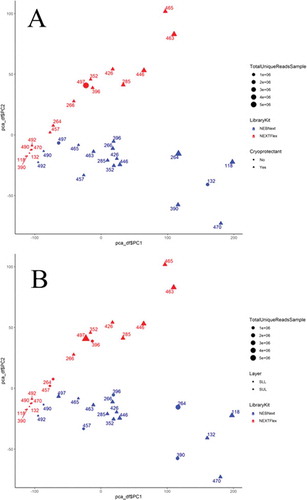
Figure 5. Clustering heatmap of Spearman correlation coefficients between sncRNA counts in 17 library pairs that met sequencing quality of 250,000 reads per sample by three factors, 1) input miRNA quantity in sample grouped by median of 25.8 ng, 2) input sperm count grouped by median of 28.2 million and 3) library kit (NEXTFlex vs NEBNext) sample
High input libraries
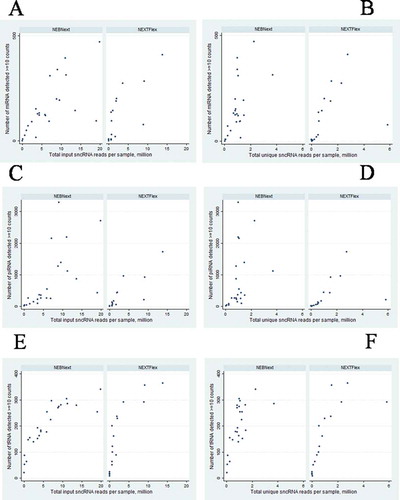
A comparison of the number of small RNAs detected by different protocols is summarized in . Unique reads were mapped to hg38 in sequential order: ribRNA>miRNA>piRNA>tRNA; only data on microRNA, tRNA, and piRNA are presented on the plots. Using median values (), the percentage of reads aligning to miRNA, piRNA, and tRNA were higher for NEXTFlex. NEXTFlex sample preparation revealed a greater diversity of miRNAs but with fewer reads (). In the case of piRNA, the NEBNext kit revealed a greater number of piRNAs with a lower number of unique reads (). For tRNA, the dependence on the total number of reads is better for NEXTFlex (). However, the number of unique reads for the two kits was similar“ by ”For tRNA, association of number of detected tRNA and total number of reads is better for NEXTFlex ().
Figure 6. Association of the number of detected small RNAs (A,B – miRNA; C,D – piRNA; E,F – tRNA) and the number of total (A,C,E) and unique (B,D,F) reads in 24 paired libraries prepared by two kits, NEBNExt and NEXTFlex
Analysis of concordance of sncRNA profile was restricted to eight NEXTFlex NEBNext pairs (16 samples) that met the following quality criteria: >240 common sncRNAs between libraries and sncRNA with ≥10 counts. Using this 16 sample dataset, we calculated the mean count for each sncRNA for the 1030 sncRNA (246 miRNA, 484 piRNA, 300 tRNA) that met our criteria and then applied the variance stabilizing transformation (VST) for the Lin’s concordance correlation and Bland–Altman analysis. The summary of the individual expression data of all sncRNA and types of RNA, including miRNA, piRNA, and tRNA among these eight pairs, is presented in Supplementary , with summary statistics presented in Supplementary . NEXTflex libraries showed a better detection of sncRNA with ≥10 counts compared to NEBNext, median (IQR) for miRNA was 166 (134–200) and 110 (79–115), respectively, p< 0.01; for piRNA – 273 (164–368) and 196 (114–205), p< 0.09 and for tRNA – 234 (211–275) and 166 (147–180), p< 0.005.
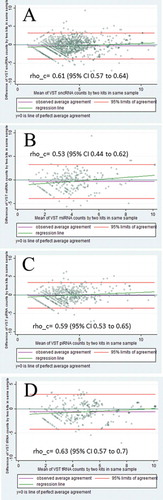
Concordance between the eight NEXTflex paired samples was moderate (Supplementary Table 3). Median (IQR) Lin’s concordance correlation coefficient (rho_c) between the 1030 sncRNA was 0.6 (0.58–0.63) for all sncRNA, 0.53 (0.49–0.57) for miRNA, 0.53 (0.52–0.63) for piRNA, 0.65 (0.63-0.68) for tRNA (all p< 0.000). Limits of agreement were similar for all pairs and feet from −4 to +4 with a bias close to 0. An example Bland-Altman plot for one pair with 535 overlapped sncRNA is presented in . Mean counts among the 1030 sncRNA were 65.0 and 152.9 in this pair of samples prepared by NEBNext and NEXTFlex, respectively.
Figure 7. Bland–Altman plots comparing variance stabilizing transformed (VST) selected 1030 sncRNA with ≥10 mean counts in one pair of samples obtained by NEXTFlex and NEBNext kit, A – all 1030 sncRNA; B – 246 miRNA; C – 484 piRNA; D – 300 tRNA
In sum, using the NEXTFlex library preparation for large amounts of material is preferable since it allows detecting a larger amount number of microRNAs. Yeri (Citation2018) and Dard–Dascot (Citation2018) came to similar conclusions: NEXTFlex detected the largest numbers of different miRNAs, owing to its 4 N random adaptor sequence that ameliorates ligation bias. However, for small quantities of input material, the NEBNext is preferable due to more consistent results.
Low input libraries
To show that excluding DNase treatment from the protocol can increase library preparation efficiency, we generated a series of libraries from an amount of starting material (spermatozoa) smaller than what was considered minimal in the initial setting of the investigation (10 million).
A total of 16 libraries were prepared for samples with sperm counts of 1-10 million, and 3 libraries were prepared with ultra-low sperm counts of less than 1 million (, box 6). We compared input parameters, sequencing results, and sncRNA levels between the NEBNext libraries, prepared from samples with sperm count ≥10 million, treated by Qiagen and TURBO DNases (, box 5), and prepared from samples with sperm count <10 million, non-treated by any DNases (Supplementary Table 4). Libraries prepared from samples with a lower sperm count (but without DNase treatment) had a median (IQR) final concentration of 8.9 nM (5.7–21). This was comparable with samples of higher sperm count, treated by DNases, 11.8 nM (4.9-21.3), p< 0.99. The number of unique reads was higher for libraries from lower sperm count, non–treated with DNase, 2,250,755 (1,125,872–3,722,676) vs 948,136 (600,565–1,192,391), p< 0.0001. The total number of reads mapped to specific types of sncRNA and their percentage in relation to the total number of reads were comparable in the two groups. For instance, the median (IQR) percentage of reads mapped to miRNA was 1.3% (0.5-2.3) in the non–treated DNase group and 0.75% (0.42-1.5) and in the group treated by both DNases, p < 0.45. These methods of RNA isolation and sample preparation permit a reduction in the amount of input material required.
Library size-selection and purification
The mature miRNAs in animals possess a monophosphate at the 5′-termini and a 2′-, 3′-hydroxyl groups at the 3′-termini (Zhuang et al. Citation2012). NEBNext library construction requires the presence of 5ʹ phosphate and 3´–OH for the ligation of the small RNA adapters (New England Biolabs Citation2018). One of the important steps for sample preparation of small RNA libraries is removing the adapter dimers formed during ligation and subsequent amplification. During sample preparation, a large number of adapter dimers are formed, reducing the sequencing complexity. The adapter dimers are approximately 129 bp in length, and the resulting library fragments are 147–160 bp in length. This small difference of 20 nucleotides makes purification difficult since the resolution of a conventional agarose gel is not sufficient. Purification on AMPure beads also requires a more substantial difference in the lengths of the separated fragments. In addition, standard purification with AMPure XP results in the loss of short fragments. Manual (Beckman Coulter Citation2016) and blog CoreGenomics (CoreGenomics Citation2012) state that AMPure XP will bind fragments 100 bp and above (using 2–2.5x beads) and exclude primers 50 bases and below; between 50 and 100 bases, there will be some recovery. We observed partial loss of material for fragments 100-200 nt using 3x AMPure beads when there is a small amount of input material.
All commercially available sample preparation kits include adapter dimer purification by PAGE. The NEXTFlex kit is designed to remove adapters during sample preparation. For samples with high RNA content, this is effective and quite convenient. However, for samples with a small amount of RNA (like sperm samples) and a large number of amplification cycles (25), gel purification becomes inevitable.
For four libraries prepared by NEXTflex kit, we compared three methods of post-PCR purification: NEXTflex cleaning beads, AMPure beads, and gel purification (Supplementary ). It can be seen that bead-based purification methods decrease the amount of substrate available for library preparation. We show that this decrease is exceptionally high for AMPure (Supplementary ). At the same time, the percentage of adapters decreases only slightly or did not decrease at all (Supplementary ). Only gel purification significantly decreased adapter percentage; this also applies to sncRNA sequence enrichment from the NEBNext libraries.
NEBNext library preparation requires purification, especially for small input miRNA. When using gel purification, the concentration of the material decreased slightly, while the percentage of adapters dropped sharply (Supplementary , D). A standard commercially proposed method of gel purification is the use of a PAGE gel. However, this method has its limitations. It requires very precise control of the electrophoresis conditions; however, real-time monitoring of the progress of the electrophoresis is impossible. Subsequent elution with PAGE takes a long time (optimally overnight). Our experiments used a high-resolution gels agarose and polygalactomannan additive containing gels (see Materials and Methods). The advantages of this gel include the ability to observe and control the electrophoresis process by visualization under UV without disturbing the glass–gel system as for PAGE. Elution of DNA fragments with standard reagents for DNA isolation from agarose gel reduces the time of isolation (approximately 30 min). This gel system enables the accurate separation of fragments of 130 and 150 nucleotides in length with minimal residual adapters remaining (adapters detected following sequencing was 1.4%).
Conclusion
The isolation of sperm sncRNA and library preparation for NGS was addressed by optimization of several steps and procedures and by comparing two sncRNA library preparation kits. NGS analysis of small RNA in sperm samples is challenging because spermatozoa have very low RNA content. Sperm samples from the Russian Children’s Study biobank were prospectively collected at 18-20 years of age and used in this study. The optimized protocol for RNA extraction includes homogenization on a Disruptor Genie with RNase-free stainless steel, isolation with Qiagen kits on RNA columns without DNase treatment. The optimized NGS library preparation for a low quantity of input small RNA is based on the use of the NEBNext library preparation, as well as the removal of adapter dimers on a high-resolution gel with polygalactomannan additives. We have observed a good agreement between samples treated and non–treated with Turbo DNase. The libraries obtained by NEBNext and NEXTFlex from the same amount of input of sncRNA exhibited different library qualities and sequencing results. For instance, NEBNext libraries were characterized by higher final library concentration and the number of sequencing reads. Low quantity libraries were strongly correlated with unsuccessful sequencing, particularly for the NEXTFlex libraries. Concordance of sncRNA expression was moderate between kits, with the highest concordance for tRNA. Large input samples yielded more consistent results, as clearly evident when using NEXTFlex, since it allows for the detection of a larger number of microRNAs. However, for small quantities of input material, the NEBNext is preferable, generally yielding consistent results.
Materials and methods
Semen collection and semen parameter analyses
Semen samples for this study were prospectively collected in cohort Russian Children’s Study (RCS) at 18-20 years of age. Ejaculate samples were provided by masturbation and stored at 37°C until semen evaluation, which occurred within 1 h after ejaculation. Semen parameter analyses were performed at the Chapaevsk andrology laboratory according to the criteria recently updated (Bjorndahl et al., Citation2010) by the Nordic Association for Andrology (NAFA) and European Society of Human Reproduction and Embryology – Special Interest Group in Andrology (ESHRE-SIGA) (Kvist et al., Citation2002) as described previously (Abou Ghayda et al. Citation2020). All samples were assessed and proceeded by one technician (LS). Sperm concentration was quantified using two aliquots and Improved Neubauer Chamber Hemacytometer at 200 times magnification under a phase contrast microscope. Within-observer mean coefficient of variation (CV) in duplicates was 6.7%. Upon completion of the semen evaluation, the remaining semen for 62 (93%) samples was aliquoted into cryovials and stored at −80°C in biobank of RCS, 53 (79%) samples stored with cryoprotectant CryoProtec II (Nidacon, Sweden) in ratio 1:4 (1 part cryoprotectant and 3 parts semen), 9 (14%) samples stored without cryoprotectant. Thawed semen samples were subsequently centrifuged for 3 minutes at 5000 x g to separate the seminal plasma and the pellet washed in the Sperm Washing Medium (SWM, Irvine Scientific, CA, USA, 20 minutes, 300 x g) to decrease viscosity and remove the damaged sperm and somatic cells. A 90% and 50% density gradient centrifugation step (90% and 50% Isolate, Irvine Scientific, USA) in an Eppendorf 5430 centrifuge with a bucket rotor S-24-11–AT and adapter for 1.5–2.0 ml removed somatic cell contamination and fractionated sperm by their density to upper and bottom layers. 5 (7%) samples were fractionated just after basic semen evaluation, without freezing. After fractionation, sperm and round cell count in aliquots was evaluated in duplicates by the same methods as previously and the same technician (LS). Round cells were never found in the bottom layer. The median concentration (IQR) of round cells in the upper layer was 0.5 million/ml (0.08–1.6). For comparison, the median concentration (IQR) of spermatozoa was 22 million/ml (5.8–65.1) in the upper layer and 5.3 (0.95-29.3) in the bottom layer. For our study, we used 40 (60%) upper layer samples and 27 (40%) bottom layer samples. Then, frozen samples were delivered to the Laboratory of Evolutionary genomics, Moscow State University, Russia on dry ice and stored at −80°C.
RNA isolation
Samples were thawed on ice. A 0.5 ml RLT buffer (Qiagen, Hilden, Germany) with 7.5 μl β-mercaptoethanol was added to the samples in the storage tube. Homogenization of cells was performed with Disruptor Genie homogenizer (Scientific Industries). Tubes with samples in RLT and 100 ug 0.2 mm RNase-free stainless steel beads (Next Advance, Troy, NY, USA) are placed in a homogenizer and shake for 5 min. Homogenate was mixed with 0.5 ml QIAzol (Qiagen, Hilden, Germany) and was homogenized for 2 min with the Disruptor Genie as above. Then, homogenate mixed with 0.22 ml of chloroform. After centrifugation (12,000 r.p.m, 4 °C, 15 min), the aqueous phase was collected and mixed with 1.5× volume of 96% ethanol and RNA was purified using the miRNeasy Mini Kit (Qiagen, Hilden, Germany) protocol (one can use RNeasy Mini Kit columns and reagents and RWT buffer for washing step) with or without DNase digestion step. Purified RNA was eluted in 30 μl of nuclease-free water (70 °C) and 1 μl of DTT and 0.5 μl of RNase Block (Agilent Technologies, Santa Clara, CA, USA) were added immediately after purification. Sample preparation reactions were performed on total RNA.
DNase treatment
For DNA purification in some experiments, DNases RNase-Free DNase Set (Qiagen, Hilden, Germany), and Turbo DNA-free kit (Thermo Fisher Scientific, Waltham, MA, USA) were used as per the manufacturer’s guidelines. The control of the presence of DNA traces in the isolated RNA was performed for a number of samples using qPCR mix-HS SYBR (Evrogen, Russian Federation) and PRM1 primers (annealing temperature [Ta] = 65.5 °C), 10 μM. PRM1 primers (intron spanning), are 1) forward: CAGAGCCGGAGCAGATATTAC; 2) reverse: ATTTATTGACAGGCGGCATTGTT.
RNA and DNA quantity
Quantities of DNA, RNA and microRNA were determined with the Qubit fluorometer (Thermo Fisher Scientific, Waltham, MA, USA) with the Qubit dsDNA HS, RNA HS, and microRNA Assay Kits, respectively. Of initial 67 samples in 20 (30%) samples DNA amount was below limit of detection (LOD), 0.2 ng in 1 ul, in 48 (72%) RNA was below LOD, 5 ng in 1 ul, in 2 (3%) miRNA was below LOD, 0.5 ng in 1 ul. Non-detected values were treated as ‘zero’. Quantities and size distribution of final libraries were estimated by Bioanalyzer 2100 (Agilent Technologies, Santa Clara, CA, USA).
Libraries preparation and size selection
Libraries of small RNA were constructed using an 1) NEBNext Multiplex Small RNA Library Prep Set for Illumina (New England BioLabs, Ipswich, MA, USA), further NEBNext; 2) NEXTFlex Small RNA-Seq Kit v3 (Illumina Compatible) (PerkinElmer, Waltham, MA, USA), further NEXTFlex, as per the manufacturer’s guidelines. The amount of RNA sample in all cases was the same – 8 ul regardless of the RNA content. Used adapter dilutions depending on the initial amount of miRNA are shown in Supplementary Table 5. 25 amplification cycles used for all cases.
Size selection of 147–160 nucleotides fragments was carried out using high-resolution gel containing 0.8% agarose (Bio-Rad, Hercules, CA, USA), 0.4% polygalactomannan (OOO ‘Izogel’, Puschino, Russian Federation) and 1.6% γ–polygalactomannan (OOO ‘Izogel’, Puschino, Russian Federation). The resolution of such gel is approximately equivalent to that of a 4% agarose gel. The dry mixture of reagents is previously suspended in ethanol (before dilution in buffer). After melting, hold at 65 °C for about 30 minutes until bubbles are removed. Due to the fragility of the gel, the subsequent pouring should take place strictly in the form where the electrophoresis will be performed. The thickness of the gel did not exceed 5-6 mm, otherwise the separation was not effective. Electrophoresis was performed at 120 V during 1 hour in the tris-acetate-EDTA (TAE) buffer. Elution from the gel was performed using the kit MinElute DNA Gel Extraction Kit (Qiagen, Netherlands).
Sequencing
Libraries were sequenced on NextSeq 500 (Illumina) in the Belozersky Institute of Physico-Chemical Biology, Moscow State University.
Bioinformatic analyses
All sequencing files were quality controlled using Fastqc 0.11.9 (Andrews, Citation2010). Reads were trimmed using cutadapt 2.8 (Martin Citation2011), according to kit manufacturer instructions, reads shorter than 16bp were discarded. Trimmed and quality filtered reads were assigned for further analysis.
We used two approaches to count numbers of reads mapped to small non-coding RNA’s sequences: whole genome mapping and mapping to separate sequences of non-coding small RNAs. In both approaches we used Bowtie 1.2.3 as main aligner (Langmead et al. Citation2009) for mapping, Samtools 1.10 (Li et al. Citation2009) for SAM/BAM data manipulation and bedtools 2.28.0 (Quinlan and Hall Citation2010) for mapped reads counting. For whole genome mapping we used hg 38 reference in combination with RNAcentral v16 (EMBL-EBI Citation2020), non-coding RNA sequence database bed file. For separate mapping following databases were used: miRBase v22.1 for microRNA (Griffiths-Jones Citation2018), piRNAdb v1.8.0 for piRNA (Molecular Oncology Center Citation2014), GtRNAdb v18.1 for tRNA (The Lowe Lab Citation2019), SILVA v138.1 for ribosomal RNA (Elixir Core Data Resource and DeNBI, Citation2020) and UNIVEC 10.0 for possible contaminants. Separate mapping reads were first mapped to UniVec contaminants reference, unmapped reads were mapped to ribosomal RNAs, and all remaining reads were mapped to microRNA, piRNA and tRNA databases.
Reads after sequencing were examined for the presence of adapters dimers using cutadapt 2.8 (Martin Citation2011) for trimming and python3 for counting.
All summary statistics for sncRNA expression was calculated using R v.3.6.3 environment and analysed using Deseq2 package 1.26.0 (Love et al. Citation2014). Counts were transformed using variance stabilizing transformation from Deseq2 package for PCA and heatmap generation. Variance stabilizing transformation and correlation analysis for necessary samples were conducted with sncRNA with ≥10 mean counts.
Biostatistics
Descriptive statistics, scatter plots were prepared by Stata 13.1 (StataCorp LP, USA). ‘Concord’ package was used for computing Lin’s concordance correlation coefficient for agreement on small RNA counts obtained by two methods/kits and constructing of Bland–Altman plots and statistics. Differences in libraries’ and sequencing parameters were evaluated using a two-sided Wilcoxon rank-sum test.
Ethics approval
The parental Russian Children’s Study was approved by the Human Studies Institutional Review Boards of the Chapaevsk Medical Association (Chapaevsk, Russia) and Harvard T. H. Chan School of Public Health. At enrollment, the parent or guardian signed an informed consent, and each boy signed an assent before participation. At age 18 or older, the young man signed a consent form prior to providing the semen samples.
Authors’ contributions
Conceptualization, VS, SAK, JRP, OS; experiments, VS, AZ, LS; data curation and analysis, VS, VN, VB, YD, TD, OS; funding acquisition, RH, OS; project administration, VS, OS; visualization, VS, VN, VB, OS; writing—original draft, VS, OS; writing—review and editing, VS, AS, JRP, SAK, OS. All authors have read and agreed to the published version of the manuscript.
Supplemental Material
Download Zip (2 MB)Acknowledgments
We would like to thank the study participants and research team of RCS; Maria Logacheva for assistance in NGS; Robert Goodrich for consulting, Evgeny Yutkin and Vladlen Petrishev for discard semen samples.
Disclosure statement
No potential conflict of interest was reported by the authors.
Supplementary material
Supplemental data for this article can be accessed here.
Correction Statement
This article has been republished with minor changes. These changes do not impact the academic content of the article.
Additional information
Funding
References
- Abou Ghayda R, Sergeyev O, Burns JS, Williams PL, Lee MM, Korrick SA, Smigulina L, Dikov Y, Hauser R, Mínguez-Alarcón L. 2020. Peripubertal serum concentrations of organochlorine pesticides and semen parameters in Russian young men. Environ Int. 144:106085. doi:10.1016/j.envint.2020.106085.
- Andrews S (2010). FASTQC. A quality control tool for high throughput sequence data.
- Bjorndahl L, Mortimer D, Barratt CLR, Castilla JA, Menkveld R, Kvist U, Alvarez JG, Haugen TB. 2010. A practical guide to basic laboratory andrology. Cambridge: Cambridge University Press.
- Chen Q, Yan W, Duan E. 2016. Epigenetic inheritance of acquired traits through sperm RNAs and sperm RNA modifications. Nat Rev Genet. 17(12):733–743. doi:10.1038/nrg.2016.106.
- CoreGenomics (2012). How do SPRI beads work?
- Coulter B (2016). Agencourt AMPure XP.
- Dard-Dascot C, Naquin D, d’Aubenton-Carafa Y, Alix K, Thermes C, Van Dijk E. 2018. Systematic comparison of small RNA library preparation protocols for next-generation sequencing. BMC Genomics. Vol. 19.
- Elixir Core Data Resource, and DeNBI. 2020. SILVA. High quality ribosomal RNA database.
- EMBL-EBI (2020). RNAcentral: the non-coding RNA sequence database.
- Estill M, Hauser R, Nassan FL, Moss A, Krawetz SA. 2019a. The effects of di-butyl phthalate exposure from medications on human sperm RNA among men. Sci Rep. 9(1):12397. doi:10.1038/s41598-019-48441-5.
- Estill MS, Hauser R, Krawetz SA. 2019b. RNA element discovery from germ cell to blastocyst. Nucleic Acids Res. 47(5):2263–2275. doi:10.1093/nar/gky1223.
- Garcia-Elias A, Alloza L, Puigdecanet E, Nonell L, Tajes M, Curado J, Enjuanes C, Díaz O, Bruguera J, Martí-Almor J, et al. 2017. Defining quantification methods and optimizing protocols for microarray hybridization of circulating microRNAs. Sci Rep. 7(1):7725. doi:10.1038/s41598-017-08134-3
- Goodrich RJ, Anton E, Krawetz SA. 2013. Isolating mRNA and small noncoding RNAs from human sperm. In: Carrell DT, Aston KI, editors. Spermatogenesis. Totowa (NJ): Humana Press; p. 385–396.
- Griffiths-Jones S (2018). miRBase: the microRNA database.
- He Z, Kokkinaki M, Pant D, Gallicano GI, Dym M. 2009. Small RNA molecules in the regulation of spermatogenesis. REPRODUCTION. 137(6):901–911. doi:10.1530/REP-08-0494.
- Hua M, Liu W, Chen Y, Zhang F, Xu B, Liu S, Chen G, Shi H, Wu L. 2019. Identification of small non-coding RNAs as sperm quality biomarkers for in vitro fertilization. Cell Discov. 5(1):20. doi:10.1038/s41421-019-0087-9.
- Humphreys SC, Thayer MB, Lade JM, Wu B, Sham K, Basiri B, Hao Y, Huang X, Smith R, Rock BM. 2019. Plasma andaNd Liver protein bindingProteiN BiNdiNg of N -acetylgalactosamine–conjugatedAcetylgalactosamiNe–CoNjugated Small interfering RNAINterferiNg RNA. Drug Metab Dispos. 47(10):1174–1182. doi:10.1124/dmd.119.086967.
- Hutcheon K, McLaughlin EA, Stanger SJ, Bernstein IR, Dun MD, Eamens AL, Nixon B. 2017. Analysis of the small non-protein-coding RNA profile of mouse spermatozoa reveals specific enrichment of piRNAs within mature spermatozoa. RNA Biol. 14(12):1776–1790. doi:10.1080/15476286.2017.1356569.
- Jodar M, Sendler E, Moskovtsev SI, Librach CL, Goodrich R, Swanson S, Hauser R, Diamond MP, Krawetz SA. 2015. Absence of sperm RNA elements correlates with idiopathic male infertility. Sci Transl Med. 7(295):295re6–295re6. doi:10.1126/scitranslmed.aab1287.
- Krawetz SA, Kruger A, Lalancette C, Tagett R, Anton E, Draghici S, Diamond MP. 2011. A survey of small RNAs in human sperm. Hum Reprod. 26(12):3401–3412. doi:10.1093/humrep/der329.
- Kvist U, Björndahl L. 2002. Nordic association for andrology, european society of human reproduction and embryology, and andrology special interest group. In: Manual on basic semen analysis Oxford. UK: Oxford University Press.
- Langmead B, Trapnell C, Pop M, Salzberg SL. 2009. Ultrafast and memory-efficient alignment of short DNA sequences to the human genome. Genome Biol. 10(3):R25. doi:10.1186/gb-2009-10-3-r25.
- Li H, Handsaker B, Wysoker A, Fennell T, Ruan J, Homer N, Marth G, Abecasis G, Durbin R. 2009. 1000 genome project data processing subgroup. In: The Sequence Alignment/Map format and SAMtools. Vol. 25. Bioinforma: Oxf. Engl; p. 2078–2079.
- Love MI, Huber W, Anders S. 2014. Moderated estimation of fold change and dispersion for RNA-seq data with DESeq2. In: Genome Biol. p. 15.
- The Lowe Lab. 2019. GtRNAdb. tRNAscan-SE analysis of complete genomes.
- Marcho C, Oluwayiose OA, Pilsner JR. 2020. The preconception environment and sperm epigenetics. Andrology. 8(4):924–942. doi:10.1111/andr.12753.
- Martin M. 2011. Cutadapt removes adapter sequences from high-throughput sequencing reads. EMBnet.Journal. 17(1):10. doi:10.14806/ej.17.1.200.
- Molecular Oncology Center (2014). PIWI-interacting RNA (piRNA) Database.
- New England Biolabs (2018). NEBNext multiplex small RNA library prep set for Illumina (Set 1).
- Pilsner JR, Shershebnev A, Medvedeva YA, Suvorov A, Wu H, Goltsov A, Loukianov E, Andreeva T, Gusev F, Manakhov A, et al. 2018. Peripubertal serum dioxin concentrations and subsequent sperm methylome profiles of young Russian adults. Reprod Toxicol Elmsford N. 78:40–49. doi:10.1016/j.reprotox.2018.03.007.
- Qiagen (2020). miRNeasy mini kit.
- Quinlan AR, Hall IM. 2010. BEDTools: a flexible suite of utilities for comparing genomic features. Bioinformatics. 26(6):841–842. doi:10.1093/bioinformatics/btq033.
- Ribeiro MA, Estill MS, Fernandez GJ, Moraes LN, Krawetz SA, Scarano WR. 2018. Integrative transcriptome and microRNome analysis identifies dysregulated pathways in human Sertoli cells exposed to TCDD. Toxicology. 409:112–118. doi:10.1016/j.tox.2018.08.001.
- Sendler E, Johnson GD, Mao S, Goodrich RJ, Diamond MP, Hauser R, Krawetz SA. 2013. Stability, delivery and functions of human sperm RNAs at fertilization. Nucleic Acids Res. 41(7):4104–4117. doi:10.1093/nar/gkt132.
- Sharma U, Sun F, Conine CC, Reichholf B, Kukreja S, Herzog VA, Ameres SL, Rando OJ. 2018. Small RNAs are trafficked from the epididymis to developing mammalian sperm. Dev Cell. 46(4):481–494.e6. doi:10.1016/j.devcel.2018.06.023.
- Suvorov A, Pilsner JR, Naumov V, Shtratnikova V, Zheludkevich A, Gerasimov E, Logacheva M, Sergeyev O. 2020. Aging induces profound changes in sncRNA in rat sperm and these changes are modified by perinatal exposure to environmental flame retardant. Int J Mol Sci. 21(21):8252. doi:10.3390/ijms21218252.
- Thermo Fisher Scientific (2020). Documents and support, E8128.
- Torres J-L, Novo-Veleiro I, Manzanedo L, Alvela-Suárez L, Macías R, Laso F-J, Marcos M. 2018. Role of microRNAs in alcohol-induced liver disorders and non-alcoholic fatty liver disease. World J Gastroenterol. 24(36):4104–4118. doi:10.3748/wjg.v24.i36.4104.
- Wu H, Hauser R, Krawetz SA, Pilsner JR. 2015. Environmental susceptibility of the sperm epigenome during windows of male germ cell development. Curr Environ Health Rep. 2(4):356–366. doi:10.1007/s40572-015-0067-7.
- Yan W. 2014. Potential roles of noncoding RNAs in environmental epigenetic transgenerational inheritance. Mol Cell Endocrinol. 398(1–2):24–30. doi:10.1016/j.mce.2014.09.008.
- Yeri A, Courtright A, Danielson K, Hutchins E, Alsop E, Carlson E, Hsieh M, Ziegler O, Das A, Shah RV, et al. 2018. Evaluation of commercially available small RNASeq library preparation kits using low input RNA. In: BMC Genomics. p. 19.
- Zhang Y, Shi J, Rassoulzadegan M, Tuorto F, Chen Q. 2019. Sperm RNA code programmes the metabolic health of offspring. Nat Rev Endocrinol. 15(8):489–498. doi:10.1038/s41574-019-0226-2.
- Zhuang F, Fuchs RT, Robb GB. 2012. Small RNA expression profiling by high-throughput sequencing: implications of enzymatic manipulation. J Nucleic Acids. (2012:1–15. doi:10.1155/2012/360358.