
ABSTRACT
The detection rates for prostate cancer (pCa) by invasive biopsy are high, fully justifying its use in confirmatory testing. False-positive results of prior, relatively insensitive screening tests, however, can lead to expensive and often unnecessary surgery. Several reports have suggested the potential use of the ejaculate to screen for prostate conditions. Hitherto, the potential impact of sterilization on the diagnostic potential of seminal plasma screening has not been examined. Herein, we report cellular and molecular comparisons of semen samples obtained from normal (N = 5), vasectomized (N = 5) and prostate pathology patients (N = 4; confirmed by a biopsy) that were centrifuged over 60% PureSperm cushions. Non-penetrating cells were washed prior to immunocytochemistry with prostatic epithelial cell markers including PSMA, NKX3.1 and CD24. KRT18 was used to highlight epithelial cells in these samples. RNA sequencing was then used to identify differentially expressed small RNAs associated with vasectomy and prostate pathology. Specific gene transcripts were confirmed by RT-qPCR. PMSA+/KRT18+, CD24+/KRT18+ and NKX3.1/+KRT18+ cells were observed, albeit infrequently in most processed semen samples by indirect immunocytochemistry. Targeted RT-qPCR supported their enrichment, along with their putative designation as prostatic luminal cells. Small RNAs in seminal plasma were highly heterogeneous, with tRNAs and miRNAs being the dominant forms. Hsa-miR-143 and hsa-miR-199 were among the most prominent of the differentially expressed miRNAs upregulated in samples with prostate pathology but not vasectomy. The targets of these small RNAs illustrate biological processes involved among others in transcription regulation and collagen metabolism. Our outcomes strongly support an appraisal of selected biologically meaningful small RNAs of ejaculate semen for prostate health screening. A long-term goal would be a simple, routine, noninvasive test for monitoring prostate health, potentially among younger men.
Introduction
Prostate cancer (pCa) is the most common non-cutaneous cancer of males, responsible for almost 25,000 deaths annually in the US alone (Siegel et al. Citation2018). Diagnosis, screening and surveillance of the disease relies on the detection of prostate-specific antigen (PSA) in the blood (Hendriks et al. Citation2017), followed up, where indicated, by highly invasive prostate biopsies. The efficacy of PSA screening, however, is equivocal (Pinsky et al. Citation2017) and the results of a recently published randomized clinical trial showed that single PSA testing was a poor indicator of likely survival (Martin et al. Citation2018). Based on the discovery of alleles that may confer an increased susceptibility to the disease (Schumacher et al. Citation2018), alternative DNA screening modalities using the saliva have been proposed (Oxtoby Citation2018). DNA tests, however, cannot detect the presence of overt or indolent disease. As almost a third of seminal fluid originates from the prostate (Mann Citation1954), ejaculate semen could offer an indirect and more appropriate window into extant prostate function.
The existence of cell-free RNA in ejaculated semen has recently driven a renewed interest in the molecular investigation of prostate health (Babiker et al. Citation2007; Huang et al. Citation2015). These small RNAs (<200 nt) include miRNA (~22 nt) and piRNA (~30 nt) and as regulators of gene expression, they are closely involved in the differentiation of the epididymal epithelium and acquisition of male fertility (Papaioannou et al. Citation2010; Bjorkgren et al. Citation2012). Some miRNAs originate in the prostate (Liu and Tang Citation2011; Ostling et al. Citation2011; Huang et al. Citation2015) and can be indicative of prostate health (Selth et al. Citation2014). Any tests using the ejaculate to detect pCa should consider the higher frequency of vasectomy among older men. This study hypothesized that when vasectomy procedures are taken into account, small RNAs derived from ejaculate semen should be informative of prostate health.
Results
Semen sample characteristics
Our study employed samples from three different groups, including five normozoospermic (N) controls with no known prostate pathologies, five samples from sterile vasectomized men (S) and four men with confirmed prostate pathologies (P). All control samples were derived from men below 40 years old, with an average age of 28 years. The average ages for the vasectomized and prostate pathology groups were 55 and 64 years, respectively. The volume of semen and sperm concentration were on average approximately 3 mL and 80 million sperm/mL, respectively, for the N group. All samples from the S group had an average volume of 2.5 mL and fewer than 100,000 non-motile sperm/mL, indicative of a successful vasectomy (Sharlip et al. Citation2012). The average volume and sperm concentration for the P group were 2.5 mL and 26.4 millions/ml, respectively.
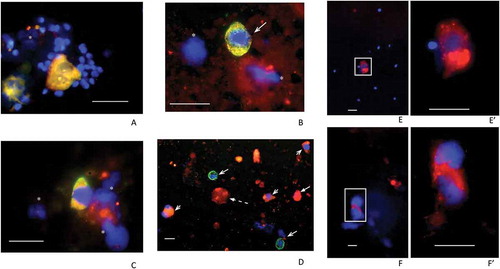
We first examined the round cell content of ejaculates from N and S samples, recovered from the 60% density fractions using antibodies to PSMA, NKX3.1 and CD24. Co-labeling of these markers with antibodies to KRT18 enabled us to distinguish between epithelial cells of likely prostatic origin (PSMA+/KRT18+, NKX3.1+/KRT18+ and CD24+/KRT18+) and other cells, such as CD24+/KRT18– and CD24–/KRT18+, present in the ejaculate of less determinate origin (). PSMA+/KRT18+ and NKX3.1+/KRT18+cells displaying an angular, central nucleus with two prominent cytoplasmic lobes, suggestive of prostatic epithelial cells, were observed in these samples. These cells were often seen alongside two types of CD24+ cells, which were either KRT18– or KRT18+, the former likely to be neutrophils and/or round cells of indeterminate origin. PSMA+ cells were also detected in the P samples examined. For example, the cells illustrated in , F that may have been undergoing mitosis prior to isolation have two diffuse nuclei bounding a cytoplasmic space. We estimated that between 100 and 500 PSMA+ cells were present in each sample. The virtual absence of sperm in the S group was noted, with DAPI-only and/or immune-signal labeling, suggesting the presence of other unidentified cell types possibly including necrotic cells. Single-channel images of the field are presented (Supplementary Figure 1).
Figure 1. Examples of fields of cells recovered from 60% fractions following density gradient centrifugation. Samples from N (A), S (B, C and D) and P patients (E, F) were processed. Fields (merged channels) from samples are shown labeled (red channel) for PSMA (A, B, E, F), NKX3.1 (C) and CD24 (D). All except the P samples (E, F) were co-labeled (green channel) for KRT18 and DAPI (blue channel) was included throughout. Panel A shows two PSMA+/KRT18+ features each with two nuclei indicating either individual, closely juxtaposed cells or possibly two bi-nucleate cells surrounded by numerous, much smaller sperm nuclei. Panel B shows a similarly PSMA+/KRT18+ sized cell, with triangular-shaped nucleus and no sign of sperm. Panel C shows an example of an NKX3.1+/KRT18+ cell and panel D shows a low powered field with CD24+/KRT18+ cells (short barbed arrowheads) and CD24−/KRT18+ cells (long barbed arrowheads). The latter may be neutrophils. The panel also shows an example of a CD24+/KRT18−/DAPI− ‘entity’ that may be a cytoplasmic fragment (broken arrow). The remaining panels show examples of PSMA+ cells from P samples with (E/E’) and without (F/F’) signs of sperm. Note the presence of bright PSMA+ vacuoles in the cytoplasm of these cells, more clearly visible in the higher-powered images shown in E’ and F’. Green signals in fields obtained from co-labeled cells were sometimes overwhelmed by the red signals but as can be seen in Supplementary Figure 1 (single channels), were usually present. DAPI-only signals indicated by asterisks may represent cellular fragments remaining after necrosis or apoptosis. The scale bars throughout are 20 µm
Efficacy of cell enrichment in semen samples using density gradient centrifugation (DGC)
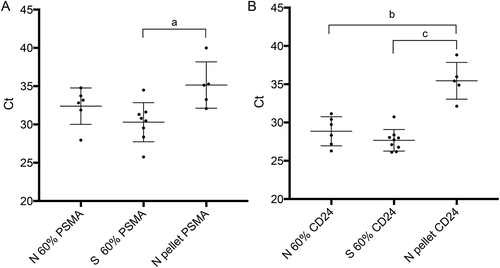
The effectiveness of cell enrichment by DGC was tested by extracting total RNA from the recovered 60% fractions (N and S groups) and pellets (N samples only) using RT-qPCR for PSMA and CD24 transcripts, normalized against endogenous control RNAs (). PCR amplification for CD24 and PSMA generated from the 60% fractions required statistically significantly fewer cycles (higher quantities) than those generated from the pellet fractions (one-way ANOVA), suggesting enrichment of putative prostatic cells in this fraction. Together with the immunocytochemical results from unfractionated semen versus the 60% fractions, our molecular data suggest that DGC enriched the round cell content of ejaculate semen, including potential cells of prostatic origin.
Figure 2. Quantitative RT-PCR of PSMA and CD24 in N and S samples. The chart shows mean normalized Ct values with standard deviation (±SD) for all samples in each group. Relevant comparisons are between RNAs isolated from 60% and pelleted fractions of normal (N) and sterile (S) samples. Lower Ct values arose among all 60% fractions where we expected enrichment of round cells. Significant differences between relevant 60% and pelleted fractions are indicated for A) PSMA (a; p < 0.01) and B) CD24 (b; p < 0.001 and c; p < 0.0001), using one-way ANOVA with Tukey’s post-hoc test
Determining seminal plasma small RNA biomarkers by RNA sequencing
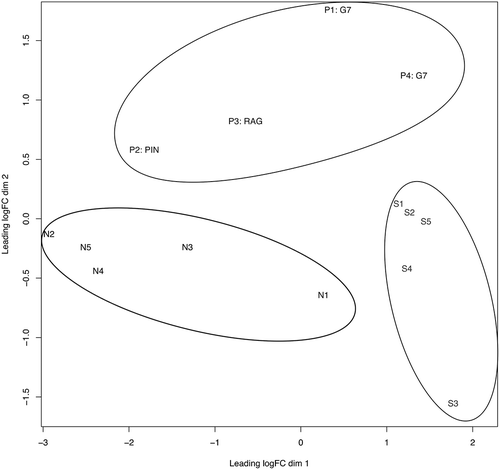
A multidimensional scaling (MDS) plot for cell-free seminal small RNAs identified by RNA-Seq showed that samples could be satisfactorily resolved into three distinct groups/phenotypes (N, S and P; ). Approximately, half (48%) of the sequencing reads mapped to the human genome, of which 78% were assigned to small RNAs (Supplementary Figure 2; Supplementary Table 1). The remaining reads corresponded to repetitive elements, including LINEs, HERVs, MERs and 7SL RNA, while fragments of protein-coding mRNAs were also present. TRNAs, miRNAs, YRNAs and RNA fragments deriving from the 28S large ribosomal subunit (LSU) dominated the three groups.
Figure 3. Multi-dimensional scaling (MDS) plot of N (black), S (light gray) and P (gray) samples are shown. The plot separates the samples in two dimensions. A clear differentiation is illustrated between the three sample groups, as indicated by the elliptic lines surrounding the P group (top), the N group (center left) and the S group (bottom right). The clustering suggests significantly differentially expressed small RNAs among the three groups
The presence of piRNA and tRNA subclusters distinguished between P and N samples, respectively (Supplementary Figure 3). The heatmaps illustrate S and P samples clustering more closely, based on their significantly higher piRNA/miRNA and lower tRNA levels. As already noted (), one of the P (Gleason score G7) samples examined (P4) had virtually no visible spermatozoa and very low expression levels for most piRNAs (; Supplementary Figure 3). All 17 of the microRNAs listed in are included in the more extensive heatmap (Supplementary Figure 3).
Table 1. List of differentially expressed small RNAs in N, S and P samples using Fisher’s exact test
Figure 4. Heatmap of top 20 differentially expressed small RNAs in N, S and P samples
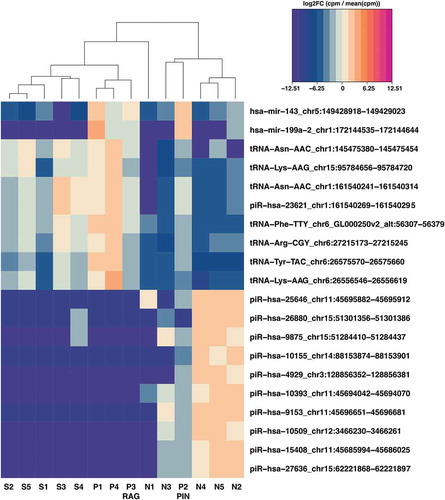
The 20 and 100 most significantly differentially expressed (DE) RNAs between the N and P groups (>4-fold change (FC); False Discovery Rate (FDR)<0.05) are shown, respectively, in and Supplementary Figure 3. Among others, we looked for potentially informative features that were not DE exclusively in N vs. S comparison, but in N vs. P and/or S vs. P comparisons. Several features met this requirement (), including four miRNAs (mir-199a, mir-143, mir-127, mir-4800) and tRNAs such as tRNA-Gly-GGY and tRNA-Ile-ATT. Candidate seminal biomarkers potentially informative of the underlying prostate pathology (P group), regardless of sterilization, were apparent. The interplay between the significantly downregulated small RNAs in the P group, such as miR-127 and miR-4800, and the significantly upregulated small RNAs, including mir-199a and mir-143, along with tRNAs, such as the tRNA-Ile-ATT variants, could indicate, in seminal plasma, the transition from a normal to an abnormal prostate.
Our study also reports the ontologies (biological processes) of the target genes potentially regulated by the significantly differentially expressed miRNAs of the P and N groups. The more highly expressed miRNAs in the P group include mir-187, mir-199a and mir-143. The corresponding gene targets are involved in protein phosphorylation (FDR 1.4E-4), positive regulation of transcription (FDR 2.9E-4) and WNT signaling pathway (FDR 3.1E-2). The more highly expressed miRNAs of the N group include among others mir-152, mir-127 and mir-7153 (Supplementary Table 2). Their associated gene targets are involved in the negative regulation of transcription (FDR 1.3E-6), extracellular matrix organization (FDR 4.5E-6), collagen catabolic process (FDR 3.3E-5) and cell adhesion (FDR 4.2E-4) (), illustrating the importance of biological processes distinguishing normal from abnormal prostate pathology in seminal plasma. All but one (miR-7153) of the above microRNAs have been linked with prostate origin/pathologies (Casanova-Salas et al. Citation2014; Theodore et al. Citation2014; Ma et al. Citation2017; Arai et al. Citation2019; Fan et al. Citation2020) and the presence of miR-7153 in sperm has been described in relation to unexplained asthenozoospermia (Heidary et al. Citation2019).
Table 2. Gene ontologies relating to the gene targets of the differentially expressed miRNAs in the N and P groups
Discussion
Prostate cancer accounts for more than a quarter of all new male cancer diagnoses, equating to almost 48,500 cases annually in the UK and predicted to increase by ~12% by 2035 (Smittenaar et al. Citation2016; Ridgway and Aning Citation2021). Clinical detection is mostly reliant on PSA levels, which even in conjunction with digital rectal examination can be equivocal (Halpern et al. Citation2018). In this study, we provided evidence for the presence of prostatic cells in the human ejaculate and their enrichment following DGC was demonstrated by RT-qPCR. Small RNAs in seminal plasma were investigated using RNA sequencing. Despite the age differences between N and P groups, none of the differentially expressed seminal plasma microRNAs overlapped with the age-related seminal plasma microRNAs reported by Paoli et al. (Citation2019). This supports the view that the RNA differences reported in the current study were prostate rather than age related.
Gardiner et al. (Citation1996) followed by Barren et al. (Citation1998) reported cells of likely prostatic origin in the ejaculate, respectively, by immunocytochemistry and flow cytometry, suggesting that semen sampling could be useful for prostate screening. Moreover, higher levels of PSA mRNA were reported from the ejaculates of pCa patients, presumed to have been derived from higher loads of prostatic cells in pCa samples (Clements et al. Citation1999). Barren et al. (Citation1998) did not find PSA to be a particularly informative marker but reported that PSMA+ cells were more common in pCa than control samples. In the current study, we took an immunocytochemical approach to characterize the presence of non-sperm cells in the N, P and S samples, with the vasectomized samples setting a background for an ejaculate ‘free’ of sperm-/testis-derived RNA. Our data based mainly on PSMA labeling suggested that while present, prostatic cells in the ejaculate were relatively rare. The success of RNA isolation from such uncommon cells depends on their enrichment, their PSMA gene expression levels and the variation of gene expression among samples, which together made it difficult to define thresholds for the PSMA gene expression based on simple cell isolation technologies, such as DGC, that could assess the development of prostate pathologies with confidence. We therefore turned our attention to the small RNAs of seminal plasma, which appeared to have greater potential for detecting prostate pathologies. Moreover, with more cost-efficient molecular-based technologies, screening for prostate pathologies would be easier to apply and scale. Assuming that a distinct small non-coding RNA (sncRNA) signature arising from sterilization might interfere or complicate the detection of prostate pathology, we also included samples from recently vasectomized men where small RNAs of testicular and epididymal origin would be reduced or absent.
In agreement with previous reports (Selth et al. Citation2014; Vojtech et al. Citation2014), the majority of our mapped sequences belonged to tRNA and rRNA fragments, while the remainder comprised miRNAs, piRNAs, YRNAs and U2 RNAs. U2 RNA is essential for RNA processing through the spliceosome (Sashital et al. Citation2007). The 28S RNA subunit of the 80S complex was strongly represented in our S and P samples. Small RNAs of this subunit were most likely breakdown products arising from cell turnover in the reproductive tract, which may be elevated in inflammatory responses that follow vasectomy or accompany underlying but unidentified pathology of the prostate (Bhindi et al. Citation2017). Seminal tRNAs could have originated from 5ʹ/3ʹ terminal fragments or endonuclease-derived tRNA halves, although as previously reported (Olvedy et al. Citation2016; Magee et al. Citation2018) more likely the former. Our analysis revealed a number of tRNAs strongly upregulated in the P samples, although many of the same tRNAs were also upregulated in S samples making their suitability as markers for pCa screening less appealing. Focusing on the seminal plasma miRNAs elevated in P, but not in N or S samples, two species (miR-143 and miR-199a) met this requirement. Both are reported to be tumor suppressing in cancer pathologies, with ectopic expression inducing apoptosis (Chen et al. Citation2016; He et al. Citation2016). Hence, normal expression of these molecules in healthy cells could be acting in a protective capacity to help prevent cancer progression. Alternatively, prostate cancer cells may secrete these small RNAs into the extracellular space, increasing their abundance in the seminal plasma. Either process may underlie their relatively greater abundance in the seminal plasma of P patients.
Other studies have taken different approaches to investigate seminal plasma at the mRNA, small RNA and protein levels in prostate cancer/pathologies (Drabovich et al. Citation2014). A review by Sapre and Selth (Citation2013) reported mainly RT-qPCR studies of seminal plasma and blood serum, revealing potential prostate cancer microRNA biomarkers. There is a little correspondence, however, among studies reporting on seminal plasma RNA. For example, two studies (Selth et al. Citation2014; Vojtech et al. Citation2014), both of which employed RNA-Seq, reported one common and possibly informative marker (miR-375). This biomarker, however, was not reported in our study. Following on from their previous work, Roberts et al. (Citation2015) reported a combination of molecular biomarkers, including serum PSA, microRNAs and protein biomarkers for the detection of prostate cancer (Roberts et al. Citation2015). A more recent study employed a larger cohort of patients using an RT-qPCR panel to reveal seminal plasma biomarkers that could be associated with the aggressiveness of prostate cancer (Farran et al. Citation2018), with Barceló (Citation2020) following a similar approach testing certain microRNAs in men with moderately altered PSA (Barceló et al. Citation2020). The divergent results of the candidate seminal plasma microRNA biomarkers may be explained by the relatively low numbers of prostate cancer/pathology samples screened by high throughput technologies that limit our ability to resolve differences in their respective microRNA expression profiles, distinguishing healthy from prostate pathologies. This divergence could also be explained by the different experimental designs and methodological approaches employed in each study, including small RNA isolation approaches, library construction and sequencing methods.
In-depth analysis of the gene ontologies of the miRNA gene targets from P and N samples supported the findings of the current study, indicating their likely participation in important biological processes that could be deregulated in the transition from a normal to an abnormal prostate pathology. These processes involve protein phosphorylation, positive transcription regulation and WNT signaling (Bisson and Prowse Citation2009). The downregulated seminal plasma miRNAs of P patients suggest an association with the negative regulation of transcription, extracellular matrix organization (Walker et al. Citation2018), collagen catabolism and cell adhesion (Burns-Cox et al. Citation2001) in their prostates. These processes potentially reflect the extracellular microenvironment of the seminal plasma in prostate cancer patients. A changing microenvironment may indicate a deregulated extracellular matrix with potential gain/loss of cell adhesion properties (Janiszewska et al. Citation2020). Collagen catabolism may lead to collagen accumulation, which is an important process in cancer progression and invasion (Xu et al. Citation2019). Small RNAs regulating these biological processes may be informative in our understanding and useful as potential biomarkers of prostate pathology progression.
Our study showed a number of highly expressed microRNAs, including miR-143 and miR-199a among P samples, which corresponds with the ontological description of their target genes. Moreover, tRNAs, such as tRNA-Gly-GGY and tRNA-Ile-ATT, which have not been reported previously, could also meet the requirements for a biomarker of prostate health. Our study did not consider the possibility that these biomarkers arose from other extracellular vesicles or other tissues including the epididymis and Cowper's (bulbourethral) gland. If not of prostatic origin, however, prostate pathology may still have led to either their appearance or elevation in the ejaculate where they were identified by our RNA-Seq approach accordingly.
Changes in the small RNA biomarkers of ejaculate semen could alert practitioners of early pathological changes in prostate pathology well before overt and possibly more clinically serious disease has developed. The validation of these biomarkers on a large sample cohort will be necessary to confirm their utility and functionality, however. Semen is normally obtained without an invasive procedure and can be repeatedly sampled without harm and relatively inexpensively. Such a scenario would be more difficult in the case of elderly men with potential prostate pathologies. However, the kind of test envisaged here would be more applicable to younger men who can ejaculate normally and who may be at greater risk based on family history or PSA screening but who have not yet developed overt signs of pathological change or are currently asymptomatic.
Materials and methods
Subjects and specimens
All semen samples were obtained between 2014 and 2015 by masturbation after 3–5 days of sexual abstinence. Control (normal; N) semen samples (n = 5) were obtained from healthy young volunteers with sperm concentrations and progressive motility of at least 20 × 106 and 50%, respectively, and from post-vasectomy (sterile; S) semen samples (n = 5) from patients undergoing checks for sperm clearance (no earlier than 8 weeks following the procedure). Vasectomized samples provided a background view of the ejaculate, free of sperm and testis-derived RNAs and to check for potential interference with candidate molecular biomarkers of prostate health. Semen samples (n = 7) from patients with prostate pathology (P) were obtained. These samples were derived from two patients diagnosed with prostate cancer (Gleason 7), one patient with a diagnosis of premalignant lesions (prostate intraepithelial neoplasia) and one patient with rare atypical glands. Three samples were unsuitable for further analysis and were excluded. All samples were permitted to liquefy at 37°C and processed appropriately. Samples were treated either with Quinn’s Advantage Sperm freezing medium (SAGE) or SpermFreeze (Origio, Denmark) prior to freezing in LN2 or shipping.
Immunocytochemistry
Semen samples (N, S and P) were thawed and incubated at 37°C for at least 30 min prior to centrifugation on a 60% cushion of Puresperm equilibrated with PureCeption Isotonic Solution (SAGEMedia, UK) mixed with Quinn’s Sperm Washing Medium (SAGE, UK) at 400 × g for 20 min. The 60% DGC layers and the pellets were collected and washed twice with Quinn’s Sperm Washing Medium at 500xg for 10 min.
For immunocytochemistry, cells recovered from 60% cushions were cytospun at 500 × g for 15 minutes on to poly-l-lysine coated slides (VWR, UK). Cells were fixed in 3:1 methanol/acetone for 15 min, washed with Phosphate Buffered Saline (PBS) and incubated in blocking solution (2% goat serum, 2% serum albumin, 0.1% Triton X-100 in PBS) for 30 min at room temperature (RT). Antibodies were applied to slides in a humidified chamber for 60 min at RT (Supplementary Table 3). Slides were subsequently washed in PBS and incubated for 30 min with appropriate fluorescence-conjugated secondary antibodies in blocking solution at RT. Slides were finally washed in PBS and mounted with an antifade-containing polyvinyl alcohol-mounting medium (DABCO, UK). Fluorescence microscopy was undertaken with a Leica LEITZ DMRB fluorescence microscope. The images were taken with a cooled CCD camera (Orca-03 R, Hamamatsu) controlled by Smart Capture 3 software (DSUK, UK).
Cellular RNA isolation and quantitative reverse transcription PCR (RT-qPCR)
RNA extraction was performed as described by Goodrich (Goodrich et al. Citation2013). Semen samples were centrifuged by DGC and washed twice in PBS. Cells from the 60% layer and pellets were lysed in RLT buffer (QIAGEN, UK) with 1:70 β-mercaptoethanol. Trizol (Ambion, UK) and chloroform (200 µL; VWR, PA, USA) were added to the mixture, followed by RT incubation after each step. The mixture was centrifuged in a benchtop microfuge at 13200 × g for 15 min (4°C). The upper layer was transferred into a fresh tube and mixed thoroughly with 100% ethanol. The mixture was then processed using the RNeasy mini kit (QIAGEN, Germany). RNA was treated with the Turbo DNase (Ambion, UK), followed by quality control and quantification using a Nanodrop ND-1000 (Thermo Fisher Scientific, MA, USA) and Agilent 2100 bioanalyzer (Agilent, CA, USA), respectively. RNA was then reverse transcribed using a mix of random primers and oligodT (Ambion, UK) and SuperTaq DNA polymerase according to the manufacturer’s instructions (Thermo Fisher Scientific, MA, USA).
Primers for PSMA and CD24 were used to test for round cell enrichment (including prostatic cells) using RT-qPCR. A TaqMan probe-based assay (Primer Design, UK) was employed on an LC-480 thermal cycler (Roche, Switzerland). The same baseline was employed across all samples, using a maximum cycle cutoff of 35. GAPDH, RPLP0 and β-actin were used as endogenous controls and normalization was conducted using the GeNorm algorithm (Vandesompele et al. Citation2002). Oligo sequences are available (Supplementary Table 4).
Small RNA isolation and RNA sequencing (RNA-Seq)
Spermatozoa, round cells and cell debris were cleared from liquefied semen samples by 10 min centrifugation at 1000xg followed by 20,000 × g for 30 min (4°C) to clarify the plasma. Cleared seminal plasma was stored at −80°C. Frozen seminal plasma was thawed at 37°C and mixed with TRIzol and an equal volume of isopropanol (Sigma, MI, USA) was added to and mixed thoroughly with the upper layer. The mixture was then centrifuged at full speed on a benchtop microcentrifuge for 15 min (4°C). The RNA pellets were washed twice with 70% ethanol and dissolved in 50 µl of RNase-free water containing RNase-out (20 U). RNA purity and quality were checked using the high sensitivity 6000 RNA Pico Kit (Agilent, CA, USA), following the manufacturer’s instructions.
Isolated RNA was subjected to small RNA-Seq. Briefly, 150 ng of total RNA underwent NEBNext library construction (New England Biolabs, MA, USA), according to the manufacturer’s protocol. We mainly focused on the miRNA, tRNA (18–23 nt) and piRNA (30–34 nt), which were size selected by gel electrophoresis (LabChip XT; Marshall Scientific, USA) and converted to cDNA, followed by adaptor ligation and purification. The cDNA was PCR enriched, using index PCR primers. After 15 PCR cycles, libraries were purified on QIAquick columns and the average fragment length and quality of the insert was evaluated on a Bioanalyzer 2100 (Agilent, USA). The cDNA libraries were quantified by RT-qPCR alongside a standard of known concentration. Equimolar library concentrations were pooled and sequenced on an Illumina NextSeq 500 (Illumina, CA, USA).
Bioinformatics, statistics and ontological analysis
Reads underwent quality control using FastQC (Andrews Citation2010) and adapter removal with TrimGalore (Krueger Citation2015). The reads were aligned to the human genome (hg38) using Subread v.1.6 (Liao et al. Citation2013). FeatureCounts function assigned reads into features using refseq (Pruitt et al. Citation2005), piRNA (Sai Lakshmi and Agrawal Citation2008) miRNA (Kozomara and Griffiths-Jones Citation2011) and repeatmasker (Smit et al. Citation2013-2015). EdgeR performed normalization and differential expression analysis using Fisher’s exact test (Robinson et al. Citation2010), revealing significant intergroup differences of small RNAs. One-way ANOVA with Tukey’s post-hoc test was employed for statistical analysis of the RT-qPCR using GraphPad Prism 7.0. Small-RNA targets were predicted by the miR database, where 50% complementarity was considered (Chen and Wang Citation2020). DAVID was employed for ontological analysis of these small RNA targets (Huang et al. Citation2009).
Ethical approval and consent
The study was approved by the National Research Ethics Service (NRES) Newcastle & North Tyneside 1) Research Ethics Committee (REC) reference 12/NE/0192 (vasectomy samples) and the University of Leeds School of Medicine Research Ethics Committee (SoMREC/13/017) for the UK. The Comitè Ètico de Investigación Clínica of the Hospital Clínic of Barcelona and the Urology Department at the Hospital Clinic of Barcelona for diagnosis and treatment of Prostate Cancer, approved the acquisition of semen samples from prostate cancer patients in Spain (REC references 2012/7942 and 2013/8753). Patients participating in the study provided signed informed consent for semen sample collection.
Supplemental Material
Download Zip (3.4 MB)Acknowledgments
The team wishes to acknowledge the following people for their invaluable assistance during the course of this study. Mrs Janine Smith of the Histopathology Unit, Seacroft Hospital, United Leeds Teaching Hospital Trust, 2 Orchiid Rise, Leeds, LS14 6WB, for sourcing the vasectomized samples used in the study. Ms Julie Glanville of Leeds Fertility at Seacroft Hospital, United Leeds Teaching Hospital Trust for consenting and sourcing the fertile samples used in the study. We thank the patients who participated in this study and all the staff and nurses from Urology Laboratory and Department from Hospital Clínic, and Faculty of Medicine, University of Barcelona, Spain, for the collection of samples from prostate cancer patients. Asif Muneer acknowledges support from the NIHR Biomedical Research Centre, University College London Hospital.
Disclosure statement
No potential conflict of interest was reported by the authors.
Data availability
All the original data used in this publication are available in the Gene Expression Omnibus (GEO Accession number: GSE117968).
Authors’ contributions
Undertook the bulk of the research reported and wrote an early draft of the manuscript: GL; undertook the bioinformatic analysis of the RNA-seq data and contributed to the manuscript accordingly: DI; provided key scientific advice on the study design and contributed to the manuscript accordingly: NM; provided key clinical advice on the study design, provided samples for analysis and contributed to the manuscript accordingly: LM, MM, AM; contributed to the study design and critical reading of the manuscript: RO; designed and undertook methodological aspects of the study, including the target assessment for differentially expressed RNAs, conducted data and ontological analysis, significantly contributed to the manuscript and took responsibility for the final submission: PN; planned and supervised the study, completed the main draft of the manuscript, prepared all additional information including figures and tables and took responsibility for the final submission: DM.
Supplemental Material
Supplemental data for this article can be accessed here.
Additional information
Funding
References
- Andrews S 2010. FastQC: a quality control tool for high throughput sequence data. [accessed Dec 5, 2018]. Available online at: http://www.bioinformatics.babraham.ac.uk/projects/fastqc
- Arai T, Kojima S, Yamada Y, Sugawara S, Kato M, Yamazaki K, Naya Y, Ichikawa T, Seki N. 2019. Micro‐ribonucleic acid expression signature of metastatic castration‐resistant prostate cancer: regulation of NCAPH by antitumor miR‐199a/b‐3p. Int J Urol. 26(4):506–520. doi:https://doi.org/10.1111/iju.13911.
- Babiker AA, Ekdahl KN, Nilsson B, Ronquist G. 2007. Prothrombotic effects of prostasomes isolated from prostatic cancer cell lines and seminal plasma. Semin Thromb Hemost. 33(1):80–86. eng. doi:https://doi.org/10.1055/s-2006-958466.
- Barceló M, Castells M, Pérez-Riba M, Bassas L, Vigués F, Larriba S. 2020. Seminal plasma microRNAs improve diagnosis/prognosis of prostate cancer in men with moderately altered prostate-specific antigen. Am J Transl Res. 12(5):2041.
- Barren RJ 3rd, Holmes EH, Boynton AL, Gregorakis A, Elgamal AA, Cobb OE, Wilson CL, Ragde H, Murphy GP. 1998. Method for identifying prostate cells in semen using flow cytometry. Prostate. 36(3):181–188. eng. doi:https://doi.org/10.1002/(SICI)1097-0045(19980801)36:3<181::AID-PROS6>3.0.CO;2-K.
- Bhindi B, Wallis CJD, Nayan M, Farrell AM, Trost LW, Hamilton RJ, Kulkarni GS, Finelli A, Fleshner NE, Boorjian SA, et al. 2017. The association between vasectomy and prostate cancer: a systematic review and meta-analysis. JAMA Intern Med. 177(9):1273–1286. doi:https://doi.org/10.1001/jamainternmed.2017.2791
- Bisson I, Prowse DM. 2009. WNT signaling regulates self-renewal and differentiation of prostate cancer cells with stem cell characteristics. Cell Res. 19(6):683–697. doi:https://doi.org/10.1038/cr.2009.43.
- Bjorkgren I, Saastamoinen L, Krutskikh A, Huhtaniemi I, Poutanen M, Sipila P. 2012. Dicer1 ablation in the mouse epididymis causes dedifferentiation of the epithelium and imbalance in sex steroid signaling. PLoS One. 7(6):e38457. doi:https://doi.org/10.1371/journal.pone.0038457.
- Burns-Cox N, Avery N, Gingell J, Bailey A. 2001. Changes in collagen metabolism in prostate cancer: a host response that may alter progression. J Urol. 166(5):1698–1701. doi:https://doi.org/10.1016/S0022-5347(05)65656-X.
- Casanova-Salas I, Rubio-Briones J, Calatrava A, Mancarella C, Masiá E, Casanova J, Fernández-Serra A, Rubio L, Ramírez-Backhaus M, Armiñán A. 2014. Identification of miR-187 and miR-182 as biomarkers of early diagnosis and prognosis in patients with prostate cancer treated with radical prostatectomy. J Urol. 192(1):252–259. doi:https://doi.org/10.1016/j.juro.2014.01.107.
- Chen J, Shin VY, Siu MT, Ho JC, Cheuk I, Kwong A. 2016. miR-199a-5p confers tumor-suppressive role in triple-negative breast cancer. BMC Cancer. 16(1):887. doi:https://doi.org/10.1186/s12885-016-2916-7.
- Chen Y, Wang X. 2020. miRDB: an online database for prediction of functional microRNA targets. Nucleic Acids Res. 48(D1):D127–D131. doi:https://doi.org/10.1093/nar/gkz757.
- Clements JA, Rohde P, Allen V, Hyland VJ, Samaratunga ML, Tilley WD, Lavin MF, Gardiner RA. 1999. Molecular detection of prostate cells in ejaculate and urethral washings in men with suspected prostate cancer. J Urol. 161(4):1337–1343. eng. doi:https://doi.org/10.1016/S0022-5347(01)61680-X.
- Drabovich AP, Saraon P, Jarvi K, Diamandis EP. 2014. Seminal plasma as a diagnostic fluid for male reproductive system disorders. Nat Rev Urol. 11(5):278. doi:https://doi.org/10.1038/nrurol.2014.74.
- Fan J, Du W, Zhang H, Wang Y, Li K, Meng Y, Wang J. 2020. Transcriptional downregulation of miR‐127‐3p by CTCF promotes prostate cancer bone metastasis by targeting PSMB5. FEBS Lett. 594(3):466–476. doi:https://doi.org/10.1002/1873-3468.13624.
- Farran B, Dyson G, Craig D, Dombkowski A, Beebe-Dimmer JL, Powell IJ, Podgorski I, Heilbrun L, Bolton S, Bock CH. 2018. A study of circulating microRNAs identifies a new potential biomarker panel to distinguish aggressive prostate cancer. Carcinogenesis. 39(4):556–561. doi:https://doi.org/10.1093/carcin/bgy025.
- Gardiner RA, Samaratunga ML, Gwynne RA, Clague A, Seymour GJ, Lavin MF. 1996. Abnormal prostatic cells in ejaculates from men with prostatic cancer–a preliminary report. Br J Urol. 78(3):414–418. doi:https://doi.org/10.1046/j.1464-410X.1996.00089.x.
- Goodrich RJ, Anton E, Krawetz SA. 2013. Isolating mRNA and small noncoding RNAs from human sperm. Spermatogenesis: Methods and Protocols. 927:385–396.
- Halpern JA, Oromendia C, Shoag JE, Mittal S, Cosiano MF, Ballman KV, Vickers AJ, Hu JC. 2018. Use of digital rectal examination as an adjunct to prostate specific antigen in the detection of clinically significant prostate cancer. J Urol. 199(4):947–953. doi:https://doi.org/10.1016/j.juro.2017.10.021.
- He Z, Yi J, Liu X, Chen J, Han S, Jin L, Chen L, Song H. 2016. MiR-143-3p functions as a tumor suppressor by regulating cell proliferation, invasion and epithelial-mesenchymal transition by targeting QKI-5 in esophageal squamous cell carcinoma. Mol Cancer. 15(1):51. doi:https://doi.org/10.1186/s12943-016-0533-3.
- Heidary Z, Zaki‐Dizaji M, Saliminejad K, Khorram Khorshid HR. 2019. MicroRNA profiling in spermatozoa of men with unexplained asthenozoospermia. Andrologia. 51(6):e13284. doi:https://doi.org/10.1111/and.13284.
- Hendriks RJ, Van Oort IM, Schalken JA. 2017. Blood-based and urinary prostate cancer biomarkers: a review and comparison of novel biomarkers for detection and treatment decisions. Prostate Cancer Prostatic Dis. 20(1):12–19. doi:https://doi.org/10.1038/pcan.2016.59.
- Huang DW, Sherman BT, Lempicki RA. 2009. Systematic and integrative analysis of large gene lists using DAVID bioinformatics resources. Nat Protoc. 4(1):44–57. doi:https://doi.org/10.1038/nprot.2008.211.
- Huang X, Yuan T, Liang M, Du M, Xia S, Dittmar R, Wang D, See W, Costello BA, Quevedo F, et al. 2015. Exosomal miR-1290 and miR-375 as prognostic markers in castration-resistant prostate cancer. Eur Urol. 67(1):33–41. doi:https://doi.org/10.1016/j.eururo.2014.07.035
- Janiszewska M, Primi MC, Izard T. 2020. Cell adhesion in cancer: beyond the migration of single cells. J Biol Chem. 295(8):2495–2505. doi:https://doi.org/10.1074/jbc.REV119.007759.
- Kozomara A, Griffiths-Jones S. 2011. miRBase: integrating microRNA annotation and deep-sequencing data. Nucleic Acids Res. 39( Database issue):D152–157. doi:https://doi.org/10.1093/nar/gkq1027.
- Liao Y, Smyth GK, Shi W. 2013. The Subread aligner: fast, accurate and scalable read mapping by seed-and-vote. Nucleic Acids Res. 41(10):e108. doi:https://doi.org/10.1093/nar/gkt214.
- Liu C, Tang DG. 2011. MicroRNA regulation of cancer stem cells. Cancer Res. 71(18):5950–5954. doi:https://doi.org/10.1158/0008-5472.CAN-11-1035.
- Ma Z, Luo Y, Qiu M. 2017. miR-143 induces the apoptosis of prostate cancer LNCap cells by suppressing Bcl-2 expression. Med Sci Monit. 23:359. doi:https://doi.org/10.12659/MSM.899719.
- Magee RG, Telonis AG, Loher P, Londin E, Rigoutsos I. 2018. Profiles of miRNA Isoforms and tRNA fragments in prostate cancer. Sci Rep. 8(1):5314. doi:https://doi.org/10.1038/s41598-018-22488-2.
- Mann T. 1954. The biochemistry of semen, London : Methuen & Co Ltd. ; New York : John Wiley & Sons, Inc.
- Martin RM, Donovan JL, Turner EL, Metcalfe C, Young GJ, Walsh EI, Lane JA, Noble S, Oliver SE, Evans S, et al. 2018. Effect of a low-intensity PSA-Based screening intervention on prostate cancer mortality: the CAP randomized clinical trial. Jama. 319(9):883–895. doi:https://doi.org/10.1001/jama.2018.0154
- mKrueger F. 2015. Trim Galore!: a wrapper tool around Cutadapt and FastQC to consistently apply quality and adapter trimming to FastQ files.
- Olvedy M, Scaravilli M, Hoogstrate Y, Visakorpi T, Jenster G, Martens-Uzunova ES. 2016. A comprehensive repertoire of tRNA-derived fragments in prostate cancer. Oncotarget. 7(17):24766–24777. doi:https://doi.org/10.18632/oncotarget.8293.
- Ostling P, Leivonen SK, Aakula A, Kohonen P, Makela R, Hagman Z, Edsjo A, Kangaspeska S, Edgren H, Nicorici D, et al. 2011. Systematic analysis of microRNAs targeting the androgen receptor in prostate cancer cells. Cancer Res. 71(5):1956–1967. doi:https://doi.org/10.1158/0008-5472.CAN-10-2421
- Oxtoby K 2018. Prostate cancer saliva test to start trials. Hospital Pharmacy Europe. [ accessed Jun 15, 2018] http://www.hospitalpharmacyeurope.com/editors-pick/prostate-cancer-saliva-test-start-trials.
- Paoli D, Pecora G, Pallotti F, Faja F, Pelloni M, Lenzi A, Lombardo F. 2019. Cytological and molecular aspects of the ageing sperm. Human Reproduction. 34(2):218–227. doi:https://doi.org/10.1093/humrep/dey357.
- Papaioannou M, Schleich S, Roell D, Schubert U, Tanner T, Claessens F, Matusch R, Baniahmad A. 2010. NBBS isolated from Pygeum africanum bark exhibits androgen antagonistic activity, inhibits AR nuclear translocation and prostate cancer cell growth. Invest New Drugs. 28(6):729–743. doi:https://doi.org/10.1007/s10637-009-9304-y.
- Pinsky PF, Prorok PC, Kramer BS. 2017. Prostate cancer screening - A perspective on the current state of the evidence. N Engl J Med. 376(13):1285–1289. doi:https://doi.org/10.1056/NEJMsb1616281.
- Pruitt KD, Tatusova T, Maglott DR. 2005. NCBI reference sequence (refSeq): a curated non-redundant sequence database of genomes, transcripts and proteins. Nucleic Acids Res. 33( Database issue):D501–504. doi:https://doi.org/10.1093/nar/gki025.
- Ridgway AJ, Aning JJ. 2021. Role of primary care in the management of prostate cancer. Prescriber. 32(2):11–17. doi:https://doi.org/10.1002/psb.1892.
- Roberts MJ, Chow CW, Schirra HJ, Richards R, Buck M, Selth LA, Doi SA, Samaratunga H, Perry‐Keene J, Payton D. 2015. Diagnostic performance of expression of PCA3, Hepsin and miR biomarkers inejaculate in combination with serum PSA for the detection of prostate cancer. The Prostate. 75(5):539–549. doi:https://doi.org/10.1002/pros.22942.
- Robinson MD, McCarthy DJ, Smyth GK. 2010. edgeR: a Bioconductor package for differential expression analysis of digital gene expression data. Bioinformatics. 26(1):139–140. doi:https://doi.org/10.1093/bioinformatics/btp616.
- Sai Lakshmi S, Agrawal S. 2008. piRNABank: a web resource on classified and clustered Piwi-interacting RNAs. Nucleic Acids Res. 36(suppl_1):D173–177. doi:https://doi.org/10.1093/nar/gkm696.
- Sapre N, Selth LA. 2013. Circulating microRNAs as biomarkers of prostate cancer: the state of play. Prostate Cancer. 2013:1–10. doi:https://doi.org/10.1155/2013/539680.
- Sashital DG, Venditti V, Angers CG, Cornilescu G, Butcher SE. 2007. Structure and thermodynamics of a conserved U2 snRNA domain from yeast and human. Rna. 13(3):328–338. doi:https://doi.org/10.1261/rna.418407.
- Schumacher FR, Al Olama AA, Berndt SI, Benlloch S, Ahmed M, Saunders EJ, Dadaev T, Leongamornlert D, Anokian E, Cieza-Borrella C, et al. 2018. Association analyses of more than 140,000 men identify 63 new prostate cancer susceptibility loci. Nat Genet. 50(7):928–936. doi:https://doi.org/10.1038/s41588-018-0142-8
- Selth LA, Roberts MJ, Chow CW, Marshall VR, Doi SA, Vincent AD, Butler LM, Lavin MF, Tilley WD, Gardiner RA. 2014. Human seminal fluid as a source of prostate cancer-specific microRNA biomarkers. Endocr Relat Cancer. 21(4):L17–21. doi:https://doi.org/10.1530/ERC-14-0234.
- Sharlip ID, Belker AM, Honig S, Labrecque M, Marmar JL, Ross LS, Sandlow JI, Sokal DC. 2012. Vasectomy: AUA guideline. J Urol. 188(6S):2482–2491. doi:https://doi.org/10.1016/j.juro.2012.09.080.
- Siegel RL, Miller KD, Jemal A. 2018. Cancer statistics, 2018. CA Cancer J Clin. 68(1):7–30. doi:https://doi.org/10.3322/caac.21442.
- Smit AFA, Hubley R, Green P 2013-2015. RepeatMasker Open-4.0. [ accessed Dec 5, 2018]. http://www.repeatmasker.org
- Smittenaar C, Petersen K, Stewart K, Moitt N. 2016. Cancer incidence and mortality projections in the UK until 2035. Br J Cancer. 115(9):1147–1155. doi:https://doi.org/10.1038/bjc.2016.304.
- Theodore SC, Davis M, Zhao F, Wang H, Chen D, Rhim J, Dean-Colomb W, Turner T, Ji W, Zeng G. 2014. MicroRNA profiling of novel African American and caucasian prostate cancer cell lines reveals a reciprocal regulatory relationship of miR-152 and DNA methyltransferase 1. Oncotarget. 5(11):3512. doi:https://doi.org/10.18632/oncotarget.1953.
- Vandesompele J, De Preter K, Pattyn F, Poppe B, Van Roy N, De Paepe A, Speleman F. 2002. Accurate normalization of real-time quantitative RT-PCR data by geometric averaging of multiple internal control genes. Genome Biol. 3(7):research0034.1. RESEARCH0034. doi:https://doi.org/10.1186/gb-2002-3-7-research0034.
- Vojtech L, Woo S, Hughes S, Levy C, Ballweber L, Sauteraud RP, Strobl J, Westerberg K, Gottardo R, Tewari M, et al. 2014. Exosomes in human semen carry a distinctive repertoire of small non-coding RNAs with potential regulatory functions. Nucleic Acids Res. 42(11):7290–7304. doi:https://doi.org/10.1093/nar/gku347
- Walker C, Mojares E, Del Río Hernández A. 2018. Role of extracellular matrix in development and cancer progression. Int J Mol Sci. 19(10):3028. doi:https://doi.org/10.3390/ijms19103028.
- Xu S, Xu H, Wang W, Li S, Li H, Li T, Zhang W, Yu X, Liu L. 2019. The role of collagen in cancer: from bench to bedside. J Transl Med. 17(1):309.