
Abstract
Maternal diabetes-mediated fetal programming is widely discussed, however, it is important to define the extent to which intrauterine hyperglycemia interferes with the health of female pups, along with determining whether these changes can be perpetuated across generations. This study aimed to evaluate the effects of maternal diabetes on fetal programming and the repercussions on the metabolism of pregnant and nonpregnant female pups. Diabetes status was induced (diabetic group—D) using streptozotocin (a beta cell cytotoxic drug) on the fifth postnatal day of female rats, while controls received a citrate buffer (Control—C). In adulthood, the rats were mated to obtain their female pups. At 90 days of age, half of the female pups were mated (preg) and the other half continued virgin (Npreg). Furthermore, they were distributed into four groups: OC/Npreg and OC/preg—female pups from control mothers; OD/Npreg and OD/preg—female pups from diabetic mothers. At 115 days of life and/or 17 days of pregnancy, the oral glucose tolerance test (OGTT) was performed with blood collection for insulin measurement. At 120 days of life and/or 21 days of pregnancy, the rats were anesthetized and euthanized to determine their blood oxidative stress status. The OD/Npreg group showed glucose intolerance during OGTT (p < 0.0001), while the OD/preg group showed increased insulin secretion during OGTT (p < 0.0001) and insulin resistance (IR; p = 0.0027). An increase in homeostatic model assessment β was shown in the pregnant groups, regardless of maternal diabetes (p < 0.0001). The OD/preg group presented increased thiobarbituric acid reactive substances (p < 0.0001) and –SH levels (p = 0.0005) and decreased superoxide dismutase activity (p = 0.0063). Additionally, small fetuses for gestational age (p < 0.0001) were found in these rats. In conclusion, exposure to maternal hyperglycemia compromises the glycemic metabolism of female pups before and during pregnancy and causes oxidative stress, IR, and impaired fetal growth during pregnancy.
Introduction
The pregnancy period promotes various hormonal, immunological, and metabolic changes to allow proper fetal development and to prepare the body for delivery (Kinsley and Lambert Citation2006; Motosko et al. Citation2017; Pavethynath et al. Citation2019). Changes begin early in the first trimester, peak in the full-term period, and return to pre-pregnancy levels a few weeks after delivery. Pregnancy alterations/adaptations are tolerated well by healthy women; however, the existence of a predisposition can aggravate or unmask a preexisting illness or pregnancy-related pathophysiology (Bhatia and Chhabra Citation2018).
The structural and functional growth of specific tissues or organs can be stimulated or inhibited by the maternal condition and, ultimately, result in disability and illness in adult life. This effect has been termed the ‘fetal origins of adult disease’ (Hales and Barker Citation1992) and later, the ‘developmental origin of health and disease’ (DOHaD) (Bateson et al. Citation2004; Calkins and Devaskar Citation2011; Navarro et al. Citation2017). Developmental plasticity occurs during sensitive periods (i.e., when a system is moldable) and acts by altering tissue morphology (e.g., anatomy and/or microanatomy) or cellular activity within the tissues from the conceptus. Therefore, developmental plasticity encompasses processes that generate alternative phenotypes from a single genotype through environmental stimuli that act during development (Gluckman and Hanson Citation2007). Despite DOHaD being considered a normal biological phenomenon and a part of developmental plasticity, it can be maladaptive and lead to a higher risk of disease in some circumstances.
Transgenerational effects on metabolism and incidence of metabolic diseases were addressed by cohort studies in which children born during the winter of the Dutch famine were assessed, characterized, and monitored until adulthood. These studies have clearly demonstrated a link between maternal malnutrition and the risk of metabolic disorders such as Diabetes mellitus (DM) in adulthood (Lumey et al. Citation1993; Roseboom et al. Citation2001). A study carried out on the Pima indigenous population showed that before the age of 20, subjects born from indigenous women with either Type 2 Diabetes mellitus (DM2) or gestational Diabetes mellitus (GDM) had a higher risk of developing DM2 than their cohorts born from prediabetic and nondiabetic mothers (Pettitt et al. Citation1993). Later studies and epidemiological observations showed that unhealthy nutrition, including both malnutrition and overnutrition, during intrauterine life and early postnatal life increases susceptibility to metabolic changes such as obesity, insulin resistance (IR), and DM2 (Greco et al. Citation2019; Tozour et al. Citation2020).
Prolonged exposure to hyperglycemia during pregnancy results in increased production of free radicals, particularly in reactive oxygen species (ROS) in all tissues susceptible to glucose autoxidation and protein glycosylation. Increased ROS levels, reduced glutathione (GSH) and superoxide dismutase (SOD), and decreased production and/or increased destruction of antioxidants such as catalase (CAT) (Rahman Citation2012; Luc et al. Citation2019) are related to oxidative stress status. Antioxidant enzyme levels critically influence the susceptibility of various tissues to oxidative stress and are associated with the development of complications in diabetic status (Rahman Citation2012), including in the intrauterine environment, which induces fetal damage and impairs growth (Damasceno et al. Citation2014; Netto et al. Citation2018). ‘Intrauterine growth restriction’ describes a fetal phenotype resulting from the fetus' failure to reach its growth potential, and ‘small for gestational age’ refers to low birth weight from a certain cutoff point for a specific gestational age (Aerts and Van Assche Citation2006; Briana and Malamitsi-Puchner Citation2009; Haugaard and Bauer Citation2001). Fetal damage from an inadequate intrauterine environment can also lead to long-term consequences in glucose tolerance in adult offspring, which may extend to subsequent generations (Bequer et al. Citation2018).
We have already demonstrated that exposure to a diabetic intrauterine milieu leads to glucose intolerance, hyperlipidemia, and pancreatic β-cell dysfunction in female rat pups at 120 days of life (Paula et al. Citation2022). However, considering that metabolic alterations during pregnancy are the starting point to induce damage in female pups, it is also necessary to investigate how the glycemic metabolism of the adult female pups will behave during pregnancy and whether these changes can impair fetal development. Our hypothesis is that female pups from hyperglycemic mothers will present exacerbated metabolic alterations during pregnancy due to acquired fetal programming. Therefore, the aim of this study was to evaluate whether the developmental plasticity induced by maternal hyperglycemia associated with the metabolic changes necessary for pregnancy maintenance can lead to worsening glycemic, insulin, and oxidative stress levels in female pups during pregnancy.
Results
Hyperglycemia during pregnancy alters the glycemic metabolism of female pups in adulthood
To determine how the glycemic metabolism in adult rat females was affected by fetal development within a hyperglycemic uterine milieu and whether there are differences during pregnancy, we compared adult female pups from diabetic and control mothers, either pregnant or nonpregnant, using the results obtained for OGTT and area under the curve (AUC).
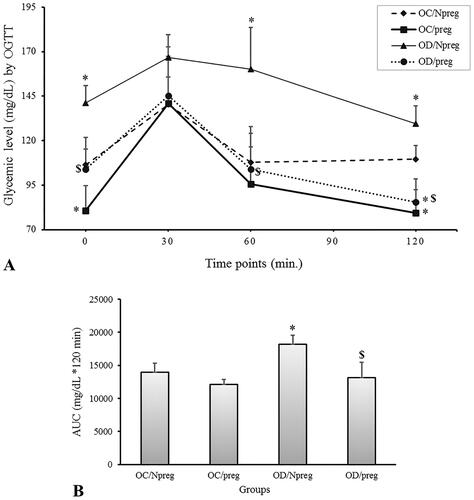
The data for the OGTT are shown in . Fasting glycemia was significantly higher in the OD/Npreg group and lower in the OC/preg group compared with the OC/Npreg and OD/preg groups (p < 0.001). Therefore, although a pregnant state results in a lower fasting glycemia for both OC (OC/preg vs. OC/Npreg, p < 0.001) and OD groups (OD/preg vs. OD/Npreg, p < 0.001), we clearly observed that when females were exposed to hyperglycemia during their development, fasting glucose values were higher, regardless of the pregnant status (OD/preg vs. OC/preg, p < 0.001) or not pregnant status (OD/Npreg vs. OC/Npreg, p < 0.001). Interestingly, at the OGTT time points of 60 and 120 min, the glycemic levels of the OD/Npreg group were still higher (p < 0.001) compared with the other groups. At 120 min, pregnant rats from a diabetic mother (OD/preg) or nondiabetic mother (OC/preg) exhibited reduced blood glucose levels when compared with their nonpregnant counterparts (p < 0.001). Based on the OGTT results, a significant increase in the AUC value was observed only in the OD/Npreg group compared with the other groups (p < 0.001) ().
Figure 1. Oral glucose tolerance test (A) and area under the curve (B) of female rat pups born to control (OC) or diabetic mothers (OD) at 120 days of life (Npreg) or at day 17 of pregnancy (preg). Values were expressed as mean ± standard deviation (SD). n = 6 rats/group. *p < 0.05—compared with the group OC/Npreg; #p < 0.05—compared with the group OC/preg; and $p < 0.05—compared with the group OD/Npreg (OGTT: two-way ANOVA and repeated measure and AUC: two-way ANOVA followed by the Tukey’s multiple comparison test).
IR and β-cell function changes in adult female pups from diabetic mothers
To better characterize the relationship between the changes seen in the OGTT for glucose metabolism and an impaired potential of the insulin physiology during pregnancy (i.e., pancreatic production and tissue resistance), serum insulin concentrations were also determined during all OGTT time-points (). Pregnant pups from diabetic mothers (OD/preg) had a significantly higher fasting insulin concentration when compared with the other groups, which were not different from each other. At the 30- and 60-min mark of the OGTT, both pregnant groups from nondiabetic (OC/preg) and diabetic (OD/preg) rats presented higher (p < 0.0001 in 30 min and p = 0.003 in 60 min) insulin concentrations compared with nonpregnant animals. Although insulin values increased during the OGTT for both pregnant groups, the raise in insulin concentration was more pronounced (see time-point 30 min in ) for the female group whose mothers were diabetic, and these values remained higher even after 120 min of the test (p = 0.002). On the contrary, the nonpregnant groups (OC/Npreg and OD/Npreg) showed no insulin concentration alterations during all of the OGTT time points evaluated here.
Figure 2. Serum insulin concentration during oral glucose tolerance test (OGTT) of female rat pups born to control (OC) or diabetic mothers (OD) at 120 days of life (Npreg) or at day 17 of pregnancy (preg). Values were expressed as mean ± standard deviation (SD). n = 6 rats/group. *p < 0.05—compared with the group OC/Npreg; #p < 0.05—compared with the group OC/preg; and $p < 0.05—compared with the group OD/Npreg (gamma distribution test).
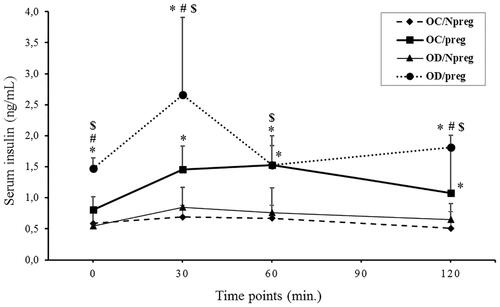
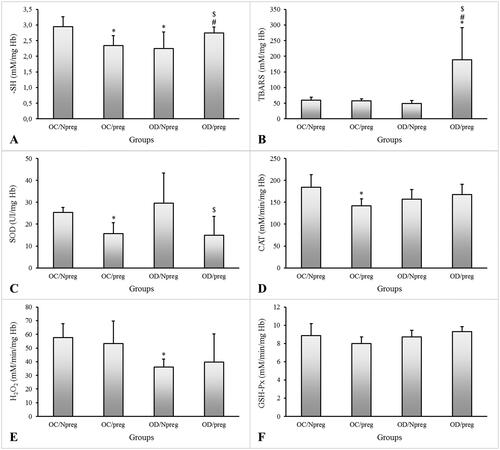
Figure 3. Concentrations of thiobarbituric acid reactive substances (TBARS—A), total reduced thiol groups (–SH—B), hydrogen peroxide (H2O2—C), and activities of superoxide dismutase (SOD—D), glutathione peroxidase (GSH-Px—E), and catalase (CAT—F) of female rat pups born to control (OC) or diabetic mothers (OD) at 120 days of life (Npreg) or at day 17 of pregnancy (preg). Values were expressed as mean ± standard deviation (SD). n = 6 rats/group. *p < 0.05—compared with the group OC/Npreg; #p < 0.05—compared with the group OC/preg; and $p < 0.05—compared with the group OD/NPreg (two-way ANOVA test followed by the Tukey’s multiple comparison test).
The results for blood glucose and insulin concentration during fasting were used to estimate IR and beta (β)-cell function by homeostatic model assessment (HOMA) evaluation. Females from diabetic mothers showed significantly higher values for HOMA-IR during pregnancy (p = 0.003) (), with approximately a twofold change compared with the other groups. In turn, the HOMA-β was similarly high for both pregnant groups, regardless of being the adult female pups of a nondiabetic (OC/preg) or diabetic mother (OD/preg) (p < 0.001) (). Although the HOMA-β index was lower in nonpregnant animals, the nonpregnant females from diabetic mothers (OD/Npreg) showed a reduced (p < 0.001) HOMA-β index compared with the OC/Npreg group, whose mother was not diabetic.
Table 1. HOMA-IR and HOMA-β indexes for female offspring from control (OC) or diabetic mothers (OD) at 120 days of life (Npreg) or at day 17 of pregnancy (preg).
Oxidative stress is higher during the pregnancy of adult female pups from diabetic mothers
shows the thiobarbituric acid reactive substances (TBARS), thiol group (–SH), and peroxide hydrogen (H2O2) concentrations and the activity of the antioxidant enzymes SOD, glutathione peroxidase (GSH-Px), and CAT. For control females with no diabetic mothers, pregnancy was shown to reduce the –SH concentrations (p = 0.005), SOD (p = 0.006), and CAT (p = 0.007) activities (OC/preg vs. OC/Npreg). The OD/Npreg presented lower –SH (p = 0.005) and H2O2 (p = 0.003) concentrations compared with the OC/Npreg. Pregnant females from diabetic mothers showed higher TBARS (p < 0.001) and –SH (p = 0.005) concentrations, and lower SOD activity compared with other groups. There was no significant difference in CAT and GSH-Px activities or H2O2 concentrations in pregnant females.
Newborn weight is lower in rat pups from diabetic mothers
presents the weight of newborns and placental weight of control and diabetic mothers. In the OD/preg group, the weights of newborns were lower compared with the OC/preg group (p < 0.001). There were no differences regarding placental weight but placental efficiency calculated in the OD/preg group was lower compared with the OC/preg group (p = 0.001).
Table 2. Newborn weight, placental weight, and placental efficiency on the day 21 of pregnancy of female offspring from control (OC/preg) or diabetic mothers (OD/preg).
Discussion
Maternal metabolic changes, such as diabetes, have negative consequences on offspring (Cheong et al. Citation2016; Hoffman et al. Citation2021; Lawlor et al. Citation2011; Perrettini et al. 2020). In this study, we not only assess the effects of diabetes-induced fetal programming on the metabolism of adult female pups, but we also show how pregnancy adaptations act on preexisting metabolic disturbances.
Adult female pups from diabetic dams presented glucose intolerance confirmed by the OGTT. The fetal exposure to an environment of glucose overload was induced by maternal diabetes, which triggered adaptive mechanisms. On one hand, these adaptations are essential to guarantee fetal development. On the other hand, however, they can lead to harmful consequences during the offspring’s adult life (Reusens et al. Citation2007), including glucose intolerance and metabolic syndrome (Hanafi et al. Citation2016). We observed that maternal glycemia in female pups of nondiabetic mothers (control) decreased, which was expected since most of the maternal glucose is redirected to the fetus (Baeyens et al. Citation2016; Lain and Catalano Citation2007). Contrastingly, the adult female pups of diabetic mothers behaved differently. Instead of experiencing the normal drop in glycemia during pregnancy, their blood glucose levels remained high, which resulted in hyperglycemia during pregnancy. It is important to highlight that the persistent maternal hyperglycemia observed in this study was equally harmful to the mothers as it was to their female pups.
In this study, both pregnant groups from nondiabetic and diabetic mothers responded with a higher insulin level when challenged in the OGTT. The high insulin concentrations were accompanied by increased pancreatic β-cell function in both groups. Despite the lack of differences between these rats, however, the pregnant pups from diabetic dams showed IR confirmed by an increased HOMA-IR. In response to glucose change in the fetus, the placenta secretes hormones, which increase maternal IR and hepatic glucose production, raising glucose availability in maternal circulation to compensate for fetal consumption (Nolan and Proietto Citation1994; Lain and Catalano Citation2007). To prevent excessive glucose delivery to the fetus, increased physiological resistance to maternal insulin must be balanced by an increase in the ability of maternal β-cells to respond to feeding (Baeyens et al. Citation2016). In rats, a higher β-cell proliferation and volume in the pancreatic islets have been observed, especially at the end of pregnancy (Chen et al. Citation2011; Hanafi et al. Citation2016). Nevertheless, due to the chronic hyperglycemic state of the rats in our investigation, this balance did not occur in the pregnant pups from diabetic mothers, and, despite the increased β-cell function to compensate for this metabolic status, the IR ceased to be physiological. Interestingly, when we previously evaluated the adult female pups from non-pregnant diabetic rats when they consumed a high-fat diet or standard diet, insulin secretion was impaired while insulin synthesis was increased (Paula et al. Citation2022). Pregnancy appears to exert an adaptive mechanism to increase the release of insulin for the improvement of the hyperglycemic response in the adult female pups from diabetic rat mothers.
Pregnancy per se is a state of oxidative stress due to increased metabolic activity in placental mitochondria and reduced scavenging power of antioxidants (Myatt and Cui Citation2004). The increased oxygen demand during gestation results in an increase of peroxide products proportionally to the mechanisms of antioxidant defense (Gitto et al. Citation2002; Spada et al. Citation2014). The ROS elimination is carried out by the action of three main enzymes: SOD, CAT, and GSH-Px, which differ in their distribution and type of reaction catalyzed (Cederberg et al. Citation2000). The SOD catalyzes the conversion of superoxide ions to oxygen and hydrogen peroxide (Weydert and Cullen Citation2010; Liu et al. Citation2015). On the other hand, the CAT enzyme, mainly distributed to peroxisomes, catalyzes the decomposition of hydrogen peroxide (H2O2) into water and oxygen. The GSH-Px activity reduces hydrogen peroxide to water using GSH (Cederberg et al. Citation2000).
We observed a decrease in reduced thiol group levels in the pregnant rats in the control group, indicating protein oxidation and a decreased antioxidant power. The latter is in accordance with the finding that the female rats also exhibited decreased SOD and CAT activities. Despite showing reduced scavenging power, there was no increase in H2O2 levels and lipid peroxidation, indicating that SOD and CAT were likely consumed to prevent cellular damage due to excessive ROS.
In diabetic animals, chronic exposure to hyperglycemia results in decreased antioxidant enzymes and increased lipoperoxidation (Damasceno et al. Citation2011; Gallego et al. Citation2018; Bueno et al. Citation2020) and the same can be observed in children who exhibit IR and redox imbalance (Jawerbaum and White Citation2017; Yessoufou et al. Citation2006). Our study showed that in the female pups from diabetic mothers whose blood glucose is abnormally high, the physiological level of oxidative stress during pregnancy was not properly maintained. These animals presented a significant increase in TBARS, indicating high lipoperoxidation, which could lead to the disturbance of many biochemical processes and to the impairment of fetal growth. Interestingly, no decrease in –SH nor in the antioxidant enzymes was observed.
Concerningly, fetuses from diabetic dams had low birth weight and lower placental efficiency. Based on our model, we suggest that fetal hyperglycemia, a consequence of the hyperglycemic intrauterine environment, as well oxidative stress (characterized by maternal lipoperoxidation) and/or maternal IR may be related to decreased fetal weight. This is explained by maternal hyperglycemia-induced fetal hyperglycemia that overstimulates pancreatic beta cells, which deplete their insulin stores (Van Assche et al. Citation2001). After some time, these cells become exhausted, leading to hypoinsulinemia. When associated with a reduced number of insulin receptors, this leads to reduced glucose uptake. This causes decreased protein mass growth, which causes fetal microsomia (Canavan and Goldspink Citation1988; Sousa et al. Citation2020). In addition, lower placental efficiency also contributed to impaired oxygenation and nutrition exchange for the lower weight of the female pups (Sinzato et al. Citation2012). The exact nature of the relationship between maternal oxidative stress and intrauterine growth restriction is not yet clear (Rashid et al. Citation2018). In humans, mothers of growth-restricted fetuses have increased malondialdehyde (MDA) levels (Kellogg et al. Citation2017) and reduced total antioxidant capacity in their plasma (Saker et al. Citation2008).
The consequences of low birth weight are of great interest and have been widely studied, as there is accumulated evidence of a higher predisposition for the development of adiposity, DM2, altered lipid metabolism, and hypertension in adulthood (Nusken et al. 2011). Our model shows that the effects of fetal programming due to diabetes, apart from being harmful to female pups, also compromise second-generation fetal growth, confirming the transgenerational effect of diabetes in our model. In our laboratory, studies are being conducted to assess the damage to the metabolism of diabetic rat granddaughters. Some limitations can be pointed out, such as the lack of biochemical and morphological determinations (lipid profile and endocrine pancreatic analysis) during pregnancy, as previously analyzed in virgin female pups at 120 days of life (Paula et al. Citation2022). This information might help to clarify the mechanisms involved in metabolic impairment during pregnancy of their pups.
In conclusion, our data show that the fetal programming caused by maternal diabetes was instrumental to induce glucose intolerance in the female pups in adulthood. Furthermore, maternal diabetes not only influences the metabolism of pre-pregnant pups, but also exacerbates changes that occur during pregnancy, such as oxidative stress and IR, and compromises fetal growth. This contributes to the perpetuation of the cycle of damage that is being transmitted among generations. It is important that further studies explore the mechanisms involved in the impairment of fetal growth and in the perpetuation of the effects of diabetes.
Methods
Animals
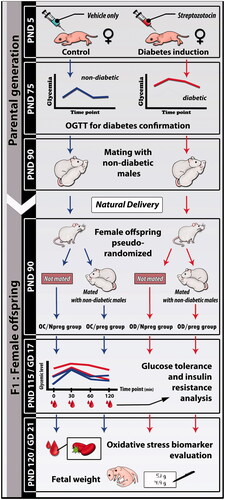
Female and male Sprague–Dawley rats weighing ∼150 and 250 g, respectively, were adapted and housed at the local laboratory vivarium. In adulthood (90 days of life), these animals were mated to obtain offspring for diabetes induction or for the nondiabetic group (Control). Male and female rats (parental and generations) were maintained under standard laboratory conditions (23 ± 2 °C, humidity 50 ± 10%, 12-h light/dark cycle), fed with a standard diet (Kcal content: 28.54% protein, 62.65% carbohydrate, 8.7% fat, Purina®, Brazil). The animals had free access to food and water. A schematic representation of the experimental design is shown in .
Figure 4. Experimental design to obtain female rat pups from control (OC) or diabetic mothers (OD) at 120 days of life (Npreg) or at day 17 of pregnancy (preg). PND: postnatal day; GD: gestational day; OGTT: oral glucose tolerance test.
Diabetes induction
To obtain female rats for induction of diabetes, healthy male and female rats were mated overnight and the following morning a vaginal smear was performed to confirm pregnancy. The offspring were obtained by vaginal delivery for later procedure to study the fetal programming effect. The induction of diabetes (D) was performed using the beta-cytotoxic drug, named streptozotocin (STZ) (Sigma Aldrich®, MA, USA—70 mg/kg dose, subcutaneous route) on the fifth day of postnatal life. The nondiabetic group (Control) received only the vehicle (citrate buffer—0.01 M, pH 4.5) at the same volume, administration route, and day used for the diabetic group (Paula et al. Citation2022).
At 75 days of life, rats from the diabetes-induced and control groups were submitted to the oral glucose tolerance test (OGTT) for inclusion in the experimental groups. Considering the inclusion or exclusion criteria for control or diabetic mothers according to predefined glycemic values related to the values from American Diabetes Association (ADA Citation2021) and Sinzato et al. (Citation2021), there was no randomization at this stage. Successful diabetes induction was confirmed based on the OGTT results and. Rats with blood glucose ≥200 mg/dL in at least one test point were included in the diabetic group. For the control group, only rats with blood glucose <140 mg/dL in at least three points of the OGTT curve were included. Females who received STZ and did not show changes in OGTT points and female rats from the nondiabetic group that showed changes in OGTT were excluded from the study. The OGTT of diabetic and control rats are shown in Supplementary Figure S1.
Mating, pregnancy, and lactation
In adulthood (90 days of life), diabetic (n = 8) and control (n = 6) rats were mated overnight with normoglycemic males (90 days of life). The next morning the males were removed and vaginal smear was performed with cotton swabs soaked in autoclaved distilled water. Only the region containing the cotton was introduced into the vagina for sample collection. After collection, this sample was transferred to a slide and visualized under an optical microscope to verify the presence of keratinized cells from the estrus phase and spermatozoa, which confirmed positive diagnosis of pregnancy. The pregnant rats were kept under the same conditions in individual cages and with free access to water and food throughout gestation and lactation. After birth, litters were maintained with eight pups per mother, at least four females and four males until weaning (PND 22). Litters were reduced to eight pups per lactating dam, prioring female newborns, with free access to the nipples and rat diet. The standardization of rodent litter size to eight pups was performed in an attempt to control the variability in developmental rate, reduce pup mortality and litter-size-induced variability on pup growth thereby increasing the statistical power (Agnish and Keller Citation1997) to detect maternal diabetes-related effects. When the litter was superior to eight pups, males and females were at random chosen. When the litter was up to eight pups, if both genders were present, we did not manipulate the litter. But, if the litter was inferior to eight pups per mother, this mother and its litter were excluded from our experiment but maintained in our vivarium for another study. After weaning, female pups were prioritized for the analysis of pregnancy related to intergenerational effects, and males were relocated to another experiment or donated to another investigator.
Experimental groups
In adulthood (postnatal day 90—PND 90), a maximum of two female pups from each diabetic mother (D) (total of 16 female pups) or control (C) (total of 12 female pups) were pseudorandomized to compose the experimental groups of female offspring from control rat (OC) and female offspring from diabetic rats (OD) to maintain the heterogeneity of the experimental groups. Pseudorandomization method was employed as convenience measure for different interventions (to obtain diabetic or not) to successive allocation based upon the date of birth (the female pups from first dam to delivery were not induced to diabetes, and the female pups from next dam received beta-cytotoxic drug for diabetes induction). This method successively occurred (Smith et al. Citation2015). After this, in all of the steps the randomization by drawing of numbered papers representing each animal was performed to distribute the animals for analysis. For the composition of nonpregnant groups: OC/Npreg—female pups from control mothers (n = 6) and OD/Npreg—female pups from diabetic mothers (n = 10). The OC/Npreg and OD/Npreg groups were euthanized by overdoses of anesthesia (sodium thiopental, 120 mg/kg) followed by laparotomy at PND 120. For the composition of the pregnant groups, the composition was as follows: OC/preg—female pups from control mothers (n = 6) and OD/preg—female pups from diabetic mothers (n = 6). To obtain the pregnant status, the female pups were mated in adulthood (PND 120) as described for the parental generation. After confirmation of successful mating, this morning was considered as gestational day 0—GD0). During pregnancy, the female rat pups were kept in individual cages under standard conditions
Oral Glucose Tolerance Test (OGTT) and area under the curve (AUC)
The OGTT was performed at PND 115 for the nonpregnant rats and at the 17th gestational day in pregnant groups, to assess glucose intolerance in offspring from diabetic (n = 16) and control mothers (n = 12). To avoid severe metabolic complications in pregnant rats, fasting glucose was evaluated after 6 h of fasting (Corvino et al. 2017). The glycemia of each animal was determined by lancing the tail vein to obtain a drop of blood sample using conventional glucometer, without the need for anesthesia. Fasting blood glucose was considered at time 0. The rats then received an intragastric (gavage) glucose solution (0.2 g/mL) at a dose of 2.0 g/kg body weight and 30, 60, and 120 min after glucose loading, blood glucose levels were determined as described above. In this same test, ∼200 µm of blood was collected from the tail of the animals at each test point for subsequent insulin measurement. The total glucose response was assessed by calculating the AUC using the trapezoidal method (Tai Citation1994).
Homeostatic model assessment
During the OGTT test, blood samples (controls n = 12; diabetics n = 16) were also collected at different time points to measure serum insulin using an ELISA commercial kit (Crystal Chemical® Code: 90060, USA). Data for fasting blood glucose and serum insulin concentrations were used to determine HOMA, which uses a mathematical model to evaluate the degree of IR (HOMA-IR) and pancreatic β-cell function (HOMA-β) (Aref et al. Citation2013; Mathews et al. 2010). For HOMA-IR, the value was calculated using the following equation: [fasting insulin (µU/mL) × fasting glucose (mmol/L)]/22.5. The HOMA-β cell function, which expresses the beta-cell function, was calculated using the following equation: [20 × fasting insulin (µU/mL)]/[fasting glucose (mmol/L) – 3.5].
Blood collection, laparotomy, and evaluation oxidative stress markers
After 6 h of fasting, the nonpregnant (at PND 120) and pregnant groups (gestational day 21) were anesthetized with sodium thiopental (120 mg/kg) followed by decapitation (Faria-Neto and Santos Citation2008). Blood samples (controls n = 12; diabetics n = 16) were collected and processed to obtain washed erythrocytes that were used to assess oxidative stress markers. Samples were collected in heparinized tubes and immediately centrifuged at 185 × g for 10 min at 4 °C. Plasma was discarded and the erythrocytes were then washed with PBS (pH 7.4) and centrifugation at 1575 × g for 1 min at 4 °C. The supernatant was discarded. This procedure was repeated three times, and then the washed erythrocytes were divided into two aliquots for further analysis. One aliquot was diluted (1:20) into purified water to measure TBARS (lipoperoxidation biomarker), H2O2 (reactive species of oxygen metabolism), and–SH (a protein oxidation marker) levels. For SOD, CAT, and GSH-Px, measurements, another aliquot was diluted into stabilizing solution of 2.7 mM EDTA and 0.7 mM 2-mercaptoethanol (1:20). Hemoglobin (Hb) concentration was determined with Drabkin’s solution and according to the diluent used (purified water or stabilizing solution) (Tentor and Salvati Citation1981). The levels of TBARS, SH, H2O2, SOD, CAT, and GSH-Px were measured following procedures modified from de De Souza et al. (Citation2010).
The uterine horns were exposed and the fetuses were removed. Following, the fetuses were weighed, sexed and their respective placentas were also weighed. The fetal weight and its respective placental weight [fetal weight (g)/placental weight (g)] were used to calculate the ratio denominated as placental efficiency (Hayward et al. Citation2016).
Statistical analysis
The sample size calculation was performed taking into account the mean and standard deviation values previously obtained from the SOD activities, using the SAS -STATISTICAL ANALYSIS SYSTEM Software version 9.4, 2021. Based on the SOD activity values, using 90% power and 5% type I error, the effect size was determined by a specialist in Biostatistics at our Institution, with a minimum of six rats per group. The comparative analyses for OGTT glycemic values, two-way ANOVA and the repeated measures were performed. AUC and oxidative stress were performed using the two-way ANOVA test followed by Tukey's multiple comparison test. Due to asymmetric distribution of the data, the insulin levels, HOMA-IR and HOMA-β values were compared using the gamma distribution test. The Fisher’s exact test was used to proportion values. For newborn weight, placental weight and placental efficiency, Student's t-test was performed. For all statistical comparisons, a minimum confidence limit of 95% (p < 0.05) was considered and results are presented as mean ± standard deviation (SD).
Ethics approval
The present study was approved by the institution’s Animal Research Ethics Committee (Protocol CEUA Number: 1218/2017), and carried out in accordance with the National Institutes of Health guide for the care and use of Laboratory animals (NIH Publications No. 8023, revised 1978), and all efforts were made to minimize animal suffering.
Authors’ contributions
Conception and design, data acquisition, analysis and interpretation, manuscript writing: VGP; Interpretation, manuscript writing: MRS; Conception and design, data acquisition, analysis and interpretation: YKS; Manuscript writing and revision: AISBV; Data analysis and interpretation: JEC; Data analysis and interpretation, manuscript writing: GTV; conception and design, data acquisition, analysis and interpretation, manuscript writing: DCD.
| Abbreviations | ||
| OGTT | = | oral glucose tolerance test |
| TBARS | = | thiobarbituric acid reactive substances |
| SH | = | reduced thiol groups |
| DOHaD | = | developmental origin of health and disease |
| DM | = | diabetes mellitus |
| DM2 | = | diabetes mellitus type 2 |
| GDM | = | gestational diabetes mellitus |
| ROS | = | reactive oxygen species |
| AUC | = | area under the curve |
| IR | = | insulin resistance |
| HOMA | = | homeostatic model assessment |
| SOD | = | superoxide dismutase |
| GSH-Px | = | glutathione peroxidase |
| CAT | = | catalase |
| H2O2 | = | hydrogen peroxide |
| GSH | = | glutathione |
| MDA | = | malondialdehyde |
| STZ | = | streptozotocin |
| PND | = | postnatal day |
| ELISA | = | enzyme-linked immunosorbent assay |
| PBS | = | phosphate-buffered saline |
| EDTA | = | ethylenediamine tetraacetic acid |
| Hb | = | hemoglobin |
| SD | = | standard deviation |
| ANOVA | = | analysis of variance |
Supplemental Material
Download MS Word (4.9 MB)Acknowledgments
The authors thank Mr. Danilo Chaguri, Mr. Jurandir Antonio, and Mr. Carlos Roberto G. Lima (Academic Support Assistant – ASA, UNIPEX) and Dr. José Eduardo Corrente from Research Support Office, Botucatu Medical School/Unesp, for assistance with statistical analysis. The authors thank FAPESP (Process Number: 2016/25207-5), CAPES and CNPq/Brazil by financial support.
Disclosure statement
No potential conflict of interest was reported by the author(s).
Additional information
Funding
References
- Aerts L, Van Assche FA. 2006. Animal evidence for the transgenerational development of diabetes mellitus. Int J Biochem Cell Biol. 38(5–6):894–903.
- Agnish ND, Keller KA. 1997. The rationale for culling of rodent litters. Fundam Appl Toxicol. 38(1):2–6.
- American Diabetes Association. 2021. Classification and diagnosis of diabetes. Diabetes Care. 44:S15–S33.
- Aref AB, Ahmed OM, Ali LA, Semmler M. 2013. Maternal rat diabetes mellitus deleteriously affects insulin sensitivity and beta-cell function in the offspring. J Diabetes Res. 2013:429154.
- Baeyens L, Hindi S, Sorenson RL, German MS. 2016. β‐Cell adaptation in pregnancy. Diabetes Obes Metab. 18(1):63–70.
- Bateson P, Barker D, Clutton-Brock T, Deb D, D'Udine B, Foley RA, Gluckman P, Godfrey K, Kirkwood T, Lahr MM, et al. 2004. Developmental plasticity and human health. Nature. 430(6998):419–421.
- Bequer L, Gomez T, Molina JL, Alvarez A, Chaviano C, Clapes S. 2018. Experimental diabetes impairs maternal reproductive performance in pregnant Wistar rats and their offspring. Syst Biol Reprod Med. 64(1):60–70.
- Bhatia P, Chhabra S. 2018. Physiological and anatomical changes of pregnancy: implications for anaesthesia. Indian J Anaesth. 62(9):651–657.
- Briana DD, Malamitsi-Puchner A. 2009. Intrauterine growth restriction and adult disease: the role of adipocytokines. Eur J Endocrinol. 160(3):337–347.
- Bueno A, Sinzato YK, Volpato GT, Gallego FQ, Perecin F, Rodrigues T, Damasceno DC. 2020. Severity of prepregnancy diabetes on the fetal malformations and viability associated with early embryos in rats. Biol Reprod. 103(5):938–950.
- Calkins K, Devaskar SU. 2011. Fetal origins of adult disease. Curr Probl Pediatr Adolesc Health Care. 41(6):158–176.
- Canavan JP, Goldspink DF. 1988. Maternal diabetes in rats: II. Effects on fetal growth and protein turnover. Diabetes. 37(12):1671–1677.
- Cederberg J, Galli J, Luthman H, Eriksson UJ. 2000. Increased mRNA levels of Mn-SOD and catalase in embryos of diabetic rats from a malformation-resistant strain. Diabetes. 49(1):101–107.
- Chen G, Liu C, Xue Y, Mao X, Xu K, Liu C. 2011. Molecular mechanism of pancreatic β-cell adaptive proliferation: studies during pregnancy in rats and in vitro. Endocrine. 39(2):118–127.
- Cheong JN, Wlodek ME, Moritz KM, Cuffe JS. 2016. Programming of maternal and offspring disease: impact of growth restriction, fetal sex and transmission across generations. J Physiol. 594(17):4727–4740.
- Damasceno DC, Sinzato YK, Lima PH, de Souza MS, Campos KE, Dallaqua B, Calderon IM, Rudge MV, Volpato GT. 2011. Effects of exposure to cigarette smoke prior to pregnancy in diabetic rats. Diabetol Metab Syndr. 3:20.
- Damasceno DC, Netto AO, Iessi IL, Gallego FQ, Corvino SB, Dallaqua B, Sinzato YK, Bueno A, Calderon IMP, Rudge MVC. 2014. Streptozotocin-induced diabetes models: pathophysiological mechanisms and fetal outcomes. Biomed Res Int. 2014(819065):819065.
- De Souza MDSS, Sinzato YK, Lima PHO, Calderon IMP, Rudge MVC, Damasceno DC. 2010. Oxidative stress status and lipid profiles of diabetic pregnant rats exposed to cigarette smoke. Reprod Biomed Online. 20(4):547–552.
- Faria-Neto HC, Santos BF. 2008. Fármacos usados em animais de laboratório–anestésicos e analgésicos. In: Conceição-Silva F, Presgrave AF, editors. Manual de utilização de animais. vol. 1. Brazil: FIOCRUZ; p. 20–27.
- Gallego FQ, Sinzato YK, Miranda CA, Iessi IL, Dallaqua B, Volpato GT, Scarano WR, SanMartín S, Damasceno DC. 2018. Pancreatic islet response to diabetes during pregnancy in rats. Life Sci. 214:1–10.
- Gitto E, Reiter RJ, Karbownik M, Tan D, Gitto P, Barberi S, Barberi I. 2002. Causes of oxidative stress in the pre- and perinatal period. Biol Neonate. 81(3):146–157.
- Gluckman PD, Hanson MA. 2007. Developmental plasticity and human disease: research directions. J Intern Med. 261(5):461–471.
- Greco EA, Lenzi A, Migliaccio S, Gessani S. 2019. Epigenetic modifications induced by nutrients in early life phases: gender differences in metabolic alteration in adulthood. Front Genet. 10:795.
- Hales CN, Barker DJ. 1992. Type 2 (non–insulin-dependent) diabetes mellitus: the thrifty phenotype hypothesis. Diabetologia. 35(7):595–601.
- Hanafi MY, Abdelkhalek TM, Saad MI, Saleh MM, Haiba MM, Kamel MA. 2016. Diabetes-induced perturbations are subject to intergenerational transmission through maternal line. J Physiol Biochem. 72(2):315–326.
- Hanson RL, Elston RC, Pettitt DJ, Bennett PH, Knowler WC. 1995. Segregation analysis of non-insulin-dependent diabetes mellitus in Pima Indians: evidence for a major-gene effect. Am J Hum Genet. 57(1):160–170.
- Haugaard CT, Bauer MK. 2001. Rodent models of intrauterine growth restriction. J Am Assoc Lab Anim Sci. 28(3):10–22.
- Hayward CE, Lean S, Sibley CP, Jones RL, Wareing M, Greenwood SL, Dilworth MR. 2016. Placental adaptation: what can we learn from birthweight: placental weight ratio? Front Physiol. 7(28)
- Hoffman DJ, Powell TL, Barrett ES, Hardy DB. 2021. Developmental origins of metabolic diseases. Physiol Rev. 101(3):739–795.
- Jawerbaum A, White V. 2017. Review on intrauterine programming: consequences in rodent models of mild diabetes and mild fat overfeeding are not mild. Placenta. 52:21–32.
- Kellogg DL, III, McCammon KM, Hinchee-Rodriguez KS, Adamo ML, Roman LJ. 2017. Neuronal nitric oxide synthase mediates insulin- and oxidative stress-induced glucose uptake in skeletal muscle myotubes. Free Radic Biol Med. 110:261–269.
- Kinsley CH, Lambert KG. 2006. The maternal brain. Sci Am. 294(1):72–79.
- Lain KY, Catalano PM. 2007. Metabolic changes in pregnancy. Clin Obstet Gynecol. 50(4):938–948.
- Lawlor DA, Lichtenstein P, Långström N. 2011. Association of maternal diabetes mellitus in pregnancy with offspring adiposity into early adulthood: sibling study in a prospective cohort of 280 866 men from 248 293 families. Circulation. 123(3):258–265.
- Liu M, Xu L, Yin L, Qi Y, Xu Y, Han X, Zhao Y, Sun H, Yao J, Lin Y, et al. 2015. Potent effects of dioscin against obesity in mice. Sci Rep. 5:7973.
- Luc K, Schramm-Luc A, Guzi TJ, Mikolajczyk TP. 2019. Oxidative stress and inflammatory markers in prediabetes and diabetes. J Physiol Pharmacol. 70(6):111–113.
- Lumey LH, Ravelli ACJ, Wiessing LG, Koppe JG, Treffers PE, Stein ZA. 1993. The dutch famine birth cohort study: design, validation of exposure, and selected characteristics of subjects after 43 years follow-up. Paediatr Perinat Epidemiol. 7(4):354–367.
- Matthews VB, Allen TL, Risis S, Chan MH, Henstridge DC, Watson N, Zaffino LA, Babb JR, Boon J, Meikle PJ, et al. 2010. Interleukin-6-deficient mice develop hepatic inflammation and systemic insulin resistance. Diabetologia. 53(11):2431–2441.
- Motosko CC, Bieber AK, Pomeranz MK, Stein JA, Martires KJ. 2017. Physiologic changes of pregnancy: a review of the literature. Int J Womens Dermatol. 3(4):219–224.
- Myatt L, Cui X. 2004. Oxidative stress in the placenta. Histochem Cell Biol. 122(4):369–382.
- Navarro E, Funtikova AN, Fíto M, Schröder H. 2017. Prenatal nutrition and the risk of adult obesity: long-term effects of nutrition on epigenetic mechanisms regulating gene expression. J Nutr Biochem. 39:1–14.
- Netto AO, Gelaleti RB, Corvino SB, Serrano RG, Hernández SC, Volpato GT, Rudge MVC, Braz MG, Damasceno DC. 2018. Small-for-pregnancy-age rats submitted to exercise: DNA damage in mothers and newborns, measured by the comet assay. Mutat Res Genet Toxicol Environ Mutagen. 835:11–15.
- Nolan CJ, Proietto J. 1994. The feto-placental glucose steal phenomenon is a major cause of maternal metabolic adaptation during late pregnancy in the rat. Diabetologia. 37(10):976–984.
- Paula VG, Sinzato YK, Moraes-Souza RQ, Soares TS, Souza FQG, Karki B, Paes AMA, Corrente JE, Damasceno DC, Volpato GT. 2022. Metabolic changes in female rats exposed to intrauterine hyperglycemia and post-weaning consumption of high-fat diet. Biol Reprod. 106(1):200–212.
- Pavethynath S, Imai C, Jin X, Hichiwa N, Takimoto H, Okamitsu M, Tarui I, Aoyama T, Yago S, Fudono A, et al. 2019. Metabolic and immunological shifts during mid-to-late gestation influence maternal blood methylation of CPT1A and SREBF1. IJMS. 20(5):1066.
- Pettitt DJ, Nelson RG, Saad MF, Bennett PH, Knowler WC. 1993. Diabetes and obesity in the offspring of Pima Indian women with diabetes during pregnancy. Diabetes Care. 16(1):310–314.
- Rahman T, Hosen I, Islam M, Shekhar H. 2012. Oxidative stress and human health. ABB. 03(07):997–1019.
- Rashid CS, Bansal A, Simmons RA. 2018. Oxidative stress, intrauterine growth restriction, and developmental programming of type 2 diabetes. Physiology. 33(5):348–359.
- Reusens B, Ozanne SE, Remacle C. 2007. Fetal determinants of type 2 diabetes. Curr Drug Targets. 8(8):935–941.
- Roseboom TJ, Van Der Meulen JH, Ravelli AC, Osmond C, Barker DJ, Bleker OP. 2001. Effects of prenatal exposure to the Dutch famine on adult disease in later life: an overview. Twin Res. 4(5):293–298.
- Saker M, Soulimane MN, Merzouk SA, Merzouk H, Belarbi B, Narce M. 2008. Oxidant and antioxidant status in mothers and their newborns according to birthweight. Eur J Obstet Gynecol Reprod Biol. 141(2):95–99.
- Sinzato YK, Klöppel E, Miranda CA, Paula VG, Alves LF, Nascimento LL, Campos AP, Karki B, Hampl V, Volpato GT, et al. 2021. Comparison of streptozotocin-induced diabetes at different moments of the life of female rats for translational studies. Lab Anim. 55(4):329–340.
- Sinzato YK, Volpato GT, Iessi IL, Bueno A, Calderon IMP, Rudge MVC, Damasceno DC. 2012. Neonatally induced mild diabetes in rats and its effect on maternal, placental, and fetal parameters. Exp Diabetes Res. 2012(108163):108163.
- Smith PG, Morrow RH, Ross DA. 2015. Outcome measures and case definition. In: Field trials of health interventions: a toolbox. 3rd ed. Oxford: OUP.
- Sousa FJ, Correia RG, Cruz AF, Martins JM, Rodrigues MS, Gomes CA, Ambrósio AF, Baptista FI. 2020. Sex differences in offspring neurodevelopment, cognitive performance and microglia morphology associated with maternal diabetes: putative targets for insulin therapy. Brain Behav Immun Health. 5(100075):100075.
- Spada APM, Damasceno DC, Sinzato YK, Campos KE, Faria PA, Dallaqua B, Calderon IMP, Rudge MVC, Rodrigues T. 2014. Oxidative stress in maternal blood and placenta from mild diabetic rats. Reprod Sci. 21(8):973–977.
- Tai MM. 1994. A mathematical model for the determination of total area under glucose tolerance and other metabolic curves. Diabetes Care. 17(2):152–154.
- Tentor L, Salvati AM. 1981. Hemoglobinometry in human blood. Methods Enzymol. 76:707–715.
- Tozour J, Hughes F, Carrier A, Vieau D, Delahaye F. 2020. Prenatal hyperglycemia exposure and cellular stress, a sugar-coated view of early programming of metabolic diseases. Biomolecules. 10(10):1359.
- Van Assche FA, Holemans K, Aerts L. 2001. Long-term consequences for offspring of diabetes during pregnancy. Br Med Bull. 60(1):173–182.
- Weydert CJ, Cullen JJ. 2010. Measurement of superoxide dismutase, catalase and glutathione peroxidase in cultured cells and tissue. Nat Protoc. 5(1):51–66.
- Yessoufou A, Soulaimann N, Merzouk SA, Moutairou K, Ahissou H, Prost J, Simonin AM, Merzouk H, Hichami A, Khan NA. 2006. N-3 fatty acids modulate antioxidant status in diabetic rats and their macrosomic offspring. Int J Obes. 30(5):739–750.