Abstract
Reverse logistics play a significantly increased role in supply chains. Producers are incorporating reverse logistics into their supply chain design because of governmental legislation, economic benefits from product recovery, and customers' demands for better environmental practices. Motivated producers face two main challenges in reverse logistics network design: (1) how do you build product recovery activities into traditional forward logistics networks? and (2) how do you manage the impact of uncertainty in the reverse logistics supply chain? Moreover, producers need to consider many tradeoffs leading to efficient network design. Published case studies have discussed these tradeoffs, and we describe a framework to evaluate these tradeoff considerations. We then apply the framework to three new case studies: medical device refurbishing, municipal e‐waste recycling, and carpet fibre recycling.
1. Introduction
Over the past two decades, traditional supply chains in which product is shipped from producer to consumer are giving way to contemporary supply chains which incorporate reverse logistics, or the process of recovering value from end‐of‐life products. Because traditional supply chains are designed to provide a certain quantity of product to the customer at a certain time, logistics systems are typically not designed to accommodate reverse logistics efficiently. Yet the disposal of waste presents a critical challenge. Kirstie McIntyre of Hewlett Packard says that we have a big problem: ‘The primary output of today's production processes is waste. Across all industries, less than 10 percent of everything that is extracted from the earth (by weight) becomes usable products. The remaining 90 percent becomes waste from production…’ (McIntyre Citation2007).
Waste reduction is at the heart of a new trend, which has three main motivators: governmental legislation, economic value to be recovered in returned product, and environmental concerns. The government‐mandated motivation is especially strong in Europe, where governmental regulations are compelling businesses to address recovery and disposal of end‐of‐life products. In the US, the motivation has been largely due to economic factors – recovering value where there is an economic incentive – but legislation has begun to compel producers to set up systems for product recovery and safe disposal in a number of industries, particularly for electronic product disposal (also known as e‐waste).
With the popularity of product recovery and recycling functions comes another compelling question: how predictable is the supply chain for reverse logistics? Because of much higher levels of uncertainty in volume and condition of returned product, producers face much higher uncertainties in supply and demand of returned product, which presents a crucial challenge. Producers incorporating reverse logistics into their supply chains need to consider the impacts of higher uncertainties, and to mitigate those impacts as much as possible.
Most of the reverse logistics work has been product‐ or industry‐specific (e.g. electronics, recycled paper, auto parts, carpet, and copiers), primarily because of efficiencies that may be gained from product‐specific knowledge in recycling or remanufacturing processes (Realff et al. Citation2000). The vast majority of industry‐specific models have been quantitative mixed‐integer linear programming facility location‐allocation models (Barros et al. Citation1998, Krikke et al. Citation1999a, Louwers et al. Citation1999, Fleischmann et al. Citation2001). More recently, stochastic programming or robust optimisation approaches have been added to model inherent uncertainties (Realff et al. Citation2004, Listeş and Dekker Citation2005, Hong et al. Citation2006).
A number of researchers have used case study analysis and review of the reverse logistics literature to develop reverse logistics frameworks and models. Many models have suggested a number of tradeoffs that must be considered for efficient reverse logistics networks. These tradeoffs form an implicit framework to determine network design decisions, such as exploiting economies of scale using an industry‐wide recovery system versus protecting proprietary intellectual information through a company‐specific recovery system.
In this paper, we describe a framework for evaluating tradeoffs in network design decisions based on key considerations. We analysed 13 case studies and abstracted key considerations that were common among all the case studies. These considerations led to one of eight possible configurations. We then classified an additional 24 case studies in the literature (De Brito et al. 2003), for a total of 37 case studies, to see if the same considerations were valid. Finally, we developed three new case studies, which represented three configurations within our framework. A producer considering reverse logistics can look at the considerations that we identified, along with classified case studies, to lead them to a particular configuration of network design decisions.
The remainder of the paper is organised as follows. Section 2 contains a literature review. In Section 3, we describe the framework and illustrate it with a selection of published case studies. Section 4 presents our new case studies and their associated configurations in the framework. Discussion and future research are presented in Section 5.
2. Background and literature review
An early framework was proposed by Flapper (Citation1996). The framework was an overview of the logistics of reuse, in which the author categorised reuse activities into collection, processing, and distribution, and discussed various aspects of each activity. Flapper described a number of tradeoff considerations, including whether to collect directly from customers or at depots, whether the network should be geographically wide‐spread or localised, whether different items should be collected together or separately, whether to transport return product back to a processing plant or to reuse or recycle the product locally, and whether inspection and sorting should be done immediately on collection or at the point of processing.
Fleischmann et al. (Citation1997) presented a framework that is widely cited throughout the literature. Using case studies from practice, the authors identified characteristics of reverse logistics networks, and compared them to traditional logistics networks. They proposed a framework based on the flow of reverse distribution from producer to user and back to producer, defined types of motivations (government legislation, economic value, ‘ecological’ image), types of disposal (reuse, repair, recycling, remanufacturing), and discussed the issue of separate versus integrated network flows. They discussed tradeoff considerations such as whether testing and sorting should occur early in the collection process or at a centralised location, and whether to use traditional supply chain actors (e.g. manufacturers, middlemen and retailers) or specialised parties (e.g. secondary material dealers, recovery facilities, and logistics providers).
In 2000, Fleischmann et al. (2000) identified characteristics of product recovery networks by dividing them into three types (bulk recycling, assembly product remanufacturing, and re‐usable items) and then classifying network characteristics within each type (e.g. dedicated facilities, reuse in original market, mandatory recovery). This model was predicated on the type of product recovery process, such as bulk recycling. Tradeoff choices were discussed such as centralisation versus decentralisation of recovery activities, single‐activity facilities versus multiple‐activity facilities, and integrated network routing versus separate network routing.
The framework developed by De Brito and Dekker (Citation2003a) looked at characteristics of reverse logistics systems according to drivers (economics, legislation and ‘green citizenship’), return reasons (manufacturing returns, distribution returns and customers returns), recovery processes (collection, inspection/selection/sorting and recovery), types of returned products (composition, deterioration and use‐pattern), and the actors (forward supply chain, specialised reverse supply chain and opportunistic players). They stated that the combination of these characteristics determines the issues that arise in a specific reverse logistics system.
These frameworks have presented a number of tradeoff considerations. Other frameworks have taken a business analysis approach. In 1998, Carter and Ellram (Citation1998) proposed a framework for reverse logistics from a business perspective. By analysing a wide variety of research papers, they developed a framework predicated on drivers (Regulations, Customers, Policy Entrepreneurs, and Uncertainty) and constraints (Stakeholder Commitment, Top Management Support, Incentive Systems, Quality of Inputs, and Vertical Coordination). The framework also distinguishes among internal and external drivers. For instance, the framework suggests that the principal internal driver is having at least one policy entrepreneur, and that top management support, stakeholder commitment, and appropriate incentive systems are necessary for successful implementation of reverse logistics.
A decision‐making model for third‐party logistics providers (3PLs) was proposed by Krumwiede and Sheu (Citation2002), who interviewed 3PLs and analysed related research articles. They identified a three‐stage flow: retrieval (collection), transportation (including storage), and disposition (two types: on‐site and off‐site). The authors then developed a model for decision making that included researching existing issues and identifying current customers, building marketing channels using those customers, identifying niches, and performing a feasibility study.
Meade et al. (Citation2007) analysed an exhaustive number of articles from the literature to determine the definition, functions and mechanisms of reverse logistics. The result was a framework composed of driving forces that are environmental factors (e.g. regulation and environmental friendliness), and business factors (e.g. liberal customer returns and customer satisfaction). They also observed that there was a need for generalised models in the literature. In a similar vein, Rubio et al. (Citation2008) confirmed the need for new research into strategic aspects and organisational frameworks for reverse logistics, despite existing quantitative models and case studies.
Often high level decisions, such as where to perform recovery activities or whether to use a third‐party processor, are not based on a structured approach to making those decisions. Previous frameworks described tradeoffs in network design, constituting an implicit framework for evaluating tradeoff choices. We present a structured approach, by providing considerations that lead to one of eight configurations, and by presenting case studies that inform the design decisions. A manufacturer considering reverse logistics functionality can use our framework to make those design decisions.
3. Framework and published case studies
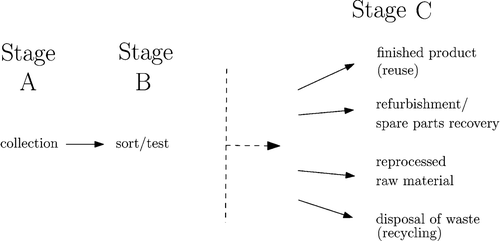
In reverse logistics, there are three fundamental stages of flow: collection, sort/test and processing (De Brito and Dekker 2003a). Processing may include finished product reuse, refurbishment and spare parts recovery, reprocessed raw material and disposal of waste. A product recovery flow diagram, adapted from Flapper (Citation1996) and De Brito and Dekker (2003a) is shown in Figure .
Figure 1 Flow of reverse logistics activities.
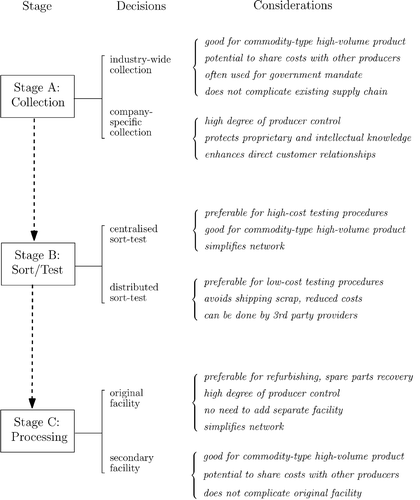
Each stage of flow has a set of network characteristics involving critical tradeoffs, which lead to choices for network design decisions. The design decisions and their associated tradeoff considerations are presented in a framework, shown in Figure . The framework provides a classification system consisting of eight possible configurations (see Table ). The key tradeoff considerations were identified primarily from 13 published case studies representing a variety of industries, as well as previous frameworks in the literature. Some case studies came from Fleischmann et al. (2000), a seminal paper in this field, and the rest were selected through a literature search to represent diverse products and industries. We identified network design characteristics and tradeoff considerations that were common among these case studies. Table lists the eight possible configurations, and lists each of the 13 case studies under its associated configuration.
Table 1. Eight configurations in the framework.
Figure 2 Framework for network design decisions.
We further tested the framework using a set of case studies in De Brito et al. (Citation2003). Of their 67 case studies, we examined 31 case studies written in English. Of these 31 case studies, seven were duplicated in our original set of 13, leaving 24 additional case studies to be classified. Table classifies our complete set of 37 case studies under the eight possible configurations.
We found that approximately one‐third of the case studies (12) had the configuration industry‐wide collection, centralised sort/test and secondary facility processing. In these systems, returned product is collected via an industry‐wide system, transported to a central facility for sorting and testing, and then processed at a secondary facility which is not company‐specific. This configuration is common for a commodity‐type recycling system, such as used construction sand (Barros et al. Citation1998) or carpet (Realff et al. Citation2000).
Three case studies (3) had the configuration industry‐wide collection, distributed sort/test and secondary facility processing. These case studies were recycling studies, two recycled paper systems and an electronic waste recycling system, in which the return product was first sorted at the collection site before it was transported to the recycling facility (Bloemhof‐Ruwaard et al. Citation1996, Kleineidam et al. Citation2000, Hong et al. Citation2006).
All of the case studies with industry‐wide collection systems performed processing at secondary facilities; none used original facilities. In industry‐wide collection systems, processing is highly likely to occur at a secondary facility, because it is relatively inefficient to retrieve a specific manufacturer's products from an industry‐wide collection system and then deliver those products to the original manufacturing facility for processing. However, such a configuration may become viable if certain conditions change – for instance, if a specific manufacturer's products were easily identified and separated out from a industry‐wide collection stream, then shipped directly from a collection site to the original facility to avoid unnecessary transportation costs. One example of such a system would be the use of RFID tagging for a particular manufacturer's product in an industry‐wide collection system; RFID tagging would make tracking and retrieval of that manufacturer's products much simpler. Another example is the specific labeling of a manufacturer's product with a guarantee of end‐of‐life return by the manufacturer, such as for flooring squares, allowing the collector to contact the manufacturer to return the product.
Another one‐third of the case studies (12) had the configuration company‐specific collection, centralised sort/test and original facility processing. Company‐specific systems often have this configuration, in which a company retrieves its own products, and processing is done at the original facility. This configuration is consistent with a proprietary refurbishing system, such as car engines (Seitz and Peattie Citation2004) or reusable glass soft drink bottles (Del Castillo Citation1996).
We found that of the remaining case studies, four (4) had the configuration company‐specific collection, centralised sort/test and secondary facility processing. This system makes sense for a proprietary collection system using a third‐party logistics provider, such as toner cartridges (Bartel Citation1995), for a company without space in its original facility, such as business lease‐return computers (Fleischmann Citation2000, Fleischmann et al. Citation2004) or where the secondary processing is dramatically different from original manufacturing, such as proprietary battery recycling (Yender Citation1998).
Another four (4) had the configuration company‐specific collection, distributed sort/test and original facility processing. Proprietary systems, where sorting can be done at the collection site, fall into this category. For instance, some reusable container systems perform inspection at distributed depots, before being sent to a new user (Duhaime et al. Citation2001), or copier manufacturers inspect at disassembly centres before shipping to the refurbishing facility (Krikke et al. 1999a).
Finally, we found two (2) case studies with the configuration company‐specific collection, distributed sort/test and secondary facility processing. In both studies, return product was sorted and processed by a third party at a decentralised location. One was a reusable container system (Kroon and Vrijens Citation1995) and the other was a copier refurbishing system (Thierry et al. Citation1995).
If a producer is considering incorporating reverse logistics into their supply chain, they can look at the considerations listed in Figure to identify a specific configuration. They can then see all the case studies to help them design their network.
Next we describe the tradeoff considerations in each stage in detail.
3.1 Stage A: collection
Collection systems are either industry‐wide, in which the same type of product from multiple producers is collected within the system, or company‐specific, in which a company collects only its own products for recovery. For company‐specific collection systems, producers can use proprietary routing, in which the producer uses its own transportation system for collection, or producers can outsource the collection to a third‐party logistics provider.
Industry‐wide collection systems tend to be used for commodity‐type products, such as paper recycling (Bloemhof‐Ruwaard et al. Citation1996). These systems are becoming prevalent for computers and electronic products, due to government mandates for industry‐wide, e‐waste collection systems (Hong et al. Citation2006). A benefit of this type of system is economies of scale, due to higher volumes. It also does not complicate a company's forward supply chain, as an industry‐wide system is typically a completely separate product return stream, collected by a third‐party entity, as it is for electronic waste (e‐scrap). However, an individual company has limited control over this type of collection system, and that includes costs and routing. Also, higher start‐up costs may be incurred for an industry‐wide collection system, because of the much larger scale and scope of the system.
A company‐specific collection system has its own benefits and drawbacks. It is particularly beneficial when the company has a strong direct relationship with its customer, such as a lease‐return relationship, or when there is high customer trade‐in behaviour, such as there is in the business computer market (Fleischmann Citation2000, Fleischmann et al. Citation2004). The company‐specific collection system tends to strengthen those customer relationships, enhancing marketing and sales efforts. However, transportation costs may be higher than in an industry‐wide collection system, because a company‐specific system cannot take advantage of economies of scale available to higher volumes that an industry‐wide system would handle.
Company‐specific proprietary routing is an attractive choice when a company wishes to protect intellectual and proprietary information. It can also be desirable for integrating forward and reverse flows, such as for drop‐off and pickup of reusable containers (Kroon and Vrijens Citation1995). This system is also beneficial when there are relatively few customer sites. One drawback is potentially higher costs, as proprietary routing may be more expensive than outsourcing the collection system.
Company‐specific third‐party routing is better positioned to take advantages of economies of scale, as third‐party logistics providers can pool shipping and facilities needs for multiple customers. This type of system may also be preferable for companies with large numbers of customer sites. Nevertheless, a third‐party routing system has the drawback of reduced control by an individual company when it comes to intellectual and proprietary information.
3.2 Stage B: sort/test
Sorting and testing can be performed either at a centralised site, or at distributed locations. A centralised site is common for a commodity‐type product, such as construction sand recycling (Barros et al. Citation1998) or carpet recycling (Louwers et al. Citation1999, Realff et al. Citation2000), owing to efficiencies from higher volumes. But a centralised site is also desirable for high‐cost testing procedures, because it minimises costs of testing equipment and specialised labor. One drawback to centralised sorting and testing is the risk of higher transportation costs for shipping scrap to the testing facility first, rather than directly to waste disposal.
Distributed sort/test sites are often used if low‐cost testing procedures are available, such as for paper recycling (Bloemhof‐Ruwaard et al. Citation1996, Kleineidam et al. Citation2000), machine refurbishing (Thierry et al. Citation1995, Krikke et al. Citation1999a), or reusable containers and equipment (Duhaime et al. Citation2001, Kroon and Vrijens Citation1995, Rudi et al. Citation2000). Scrap can be identified early and shipped to waste disposal, reducing transportation costs. However, testing procedures must be consistent and reliable, and the network may be more complicated because scrap and usable return product are shipped in separate streams.
3.3 Stage C: processing
Once the type of processing is determined (recycling, reprocessing raw material, refurbishment and spare parts recovery, or reuse), the key decision is whether to reprocess at the original facility, which is the method for copiers (Krikke et al. Citation1999a), or at a secondary facility, which is the method for carpet (Realff et al. Citation2000).
Processing at the original facility provides increased efficiency from use of original facility equipment and processes, and it is often used for machine refurbishing or spare parts recovery processing. However, there may be a need for increased processing capacity, which would be a drawback.
The benefits of processing at a secondary facility include economies of scale if done across the entire industry rather than for a single manufacturer, which makes this a good choice for a bulk commodity‐type product such as construction sand. The drawbacks include the need to establish new, separate facilities with a possible loss of processing efficiency.
4. Three new case studies
We developed three new case studies: (1) a municipal e‐waste recycling program, (2) a medical device refurbishing system, and (3) a carpet fibre recycling program. Each case study represents a different configuration.
4.1 Municipal electronic waste recycling
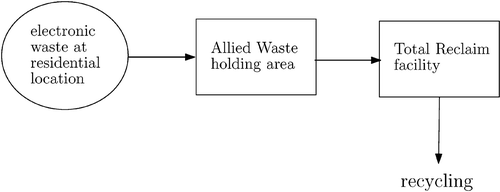
The City of Bellevue, Washington, initiated a curbside waste disposal system for electronics products. Bids were solicited for a contract with the municipality to collect electronic products from residential customer sites and to dispose of them through a commercial electronics recycler. The contract was awarded to Allied Waste, which collects the electronic waste and delivers it to Total Reclaim, a large electronics recycler in an industrial section of Seattle (see Figure ).
Figure 3 City of Bellevue municipal curbside e‐waste recycling.
State legislation was passed in Washington in 2006 mandating that producers of electronic products provide a system for disposal of those products in an environmentally safe manner, which will take effect in January 2009. However, the City of Bellevue decided to implement its program proactively in advance of the legislation, in order to improve service to its customers.
Electronic waste is collected at the customer site, and then transported to a holding area within the city. The e‐waste is placed into gaylords, bulk cargo containers, which are then loaded into a semi‐trailer; when the trailer is full (about 16–18 gaylords), Total Reclaim recycling picks up the trailer and delivers it to their electronic processing facility.
The electronic waste is sorted at the facility. Products are disassembled – plastic shredded, heavy metals and glass retrieved – and all components are recycled.
This system has the following advantages:
Proactive approach – ‘ahead of the curve’. The program was implemented well in advance of government legislation, allowing the possibility of a more favourable contract negotiation for the city. | |||||
Encourages high customer compliance. Previously, electronic waste recycling programs have relied on customers to bring their electronic waste to a central or regional recycling location; the convenience of curbside waste pickup encourages customer compliance. | |||||
Economies of scale. Because the program is part of a municipal waste disposal stream, it exploits economies of scale. For example, higher volumes mean full truckloads for transportation to the recycling facility, greater efficiencies in disassembling and recycling, and greatly mitigate the impacts of variability in volume. | |||||
This system's major challenge is that it is reactive to product design, and since the system is an ‘end‐of‐pipe’ solution, it cannot take advantage of efficiency improvements through product design.
Framework configuration:
Because electronic waste is a commodity‐type product that is produced by multiple manufacturers, industry‐wide collection is preferred, and a secondary facility – an electronics recycler – is used for processing. While it may be possible for individual electronics manufacturers to set up their own company‐specific collection system to process products at their original facility, the fact that a majority of electronics manufacturing facilities are located outside the US would make a proprietary system much more costly.
The City of Bellevue system takes greater advantage of economies of scale than prior electronics products recycling systems, such as the e‐Scrap case study (Hong et al. Citation2006). In the e‐Scrap case, customers brought used electronic products to a municipal collection site, where the products were sorted and then sent to commercial processing sites. Costs can be reduced in the City of Bellevue case because the electronic recycling is integrated into the solid waste stream.
4.2 Medical device refurbishing
A major medical device manufacturer on the West Coast has a refurbishing program, which operates on a trade‐in basis with customers under a service contract. An outdated machine may be either shipped back to the manufacturer's facility for refurbishing, or shipped directly to a national electronics recycler in Chicago, Sims/URI (see Figure ).
Figure 4 Major medical device manufacturer refurbishing.
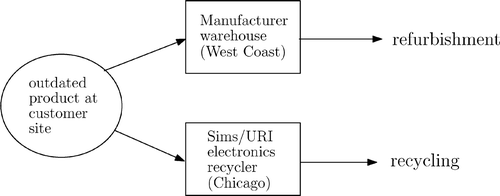
At the customer site, the outdated product is evaluated for recycling or possible refurbishing. Products to be recycled are shipped to the electronics recycler directly, reducing transportation costs that would be incurred if the product was shipped first to the manufacturer's warehouse on the West Coast and then to the recycling facility. Products that may be refurbished are shipped to a warehouse near the manufacturing plant. They are held until a customer order is received, and then they are refurbished to fill the order, avoiding the investment of unnecessary cost to refurbish a product that does not get sold. Periodically, the manufacturer's warehouse inventory is culled for excess inventory, and redundant machines are sent to the electronics recycler.
The electronics recycler has the capability to recover spare parts for the manufacturer's service part inventory. This provides valuable spare parts to repair older machines still in use by customers, typically those machines which are under a service contract for seven to 10 years.
This system has the following advantages:
On‐site evaluation for sort/test. Transportation costs are minimised by avoiding shipping scrap to the manufacturer's warehouse before shipping to the recycler. | |||||
Refurbish on customer order. Because machines are refurbished to order, unnecessary costs are avoided that would be incurred if a machine was refurbished and remained unsold. | |||||
Flexible spare part recovery. Spare parts can be recovered either by the recycler or at the manufacturing plant, allowing flexibility in maintaining outdated machine spare parts. | |||||
This system's major challenge is uncertainty in supply and demand. The volume and condition of return products is highly variable, complicating sales forecasting and inventory control of used machines. The producer's holding warehouse provides some mitigation as an inventory buffer.
Framework configuration:
The medical device manufacturer's system involves a single manufacturer's product in which proprietary knowledge is critical; company‐specific collection and original facility processing are preferable. This case has the advantage of distributed sort/test, shipping scrap directly from the customer site to the recycler, saving transportation costs. Performing sorting and testing at the collection site, as in this case study, is preferable over centralised sorting and testing whenever possible. Dealing with pre‐sorted returned product reduces costs at the processing centre, as well as transportation costs, for product that cannot be processed. For example, in the business lease‐return computer case study (Fleischmann Citation2000, Fleischmann et al. Citation2004), all return computers came into a central facility before they were recycled or refurbished, unlike the system in this new case study.
4.3 Carpet fibre recycling
Shaw Industries, a Dalton, Georgia flooring manufacturer, collects used carpet from a number of individual third‐party recycling centres located nation‐wide. The carpet is sorted at the recycling centres for a specific type of fibre (nylon 6), then bundled and shipped to Shaw's secondary nylon 6 recycling plant in Georgia (see Figure ).
Figure 5 Shaw Industries carpet fibre recycling.
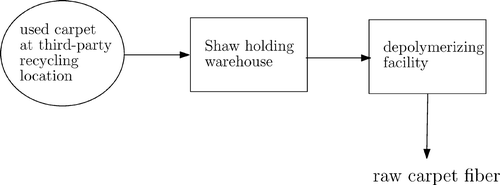
Used carpet is tested at the third‐party recycling centre with a hand‐held device that identifies the fibre content. Nylon 6 carpet is separated from other carpet types and bundled by the recycler, then shipped to a warehouse near the Shaw recycling plant. The carpet is unbundled and tested again; if a bundle is 96% or greater nylon 6 fibre, a bonus payment is given to the recycler. It is then stored in the warehouse both to adjust the humidity level of the carpet, and to buffer seasonal variations in inventory levels.
Used carpet is processed at the depolymerising plant, producing raw caprolactum fibre, the basis for nylon 6 fibre. The quality of the caprolactum fibre is actually higher than fibre obtained elsewhere by Shaw for carpet production, and it can be sold by Shaw to other carpet manufacturers. Shaw's customers indicate that, given a comparable price point between products made from recycled fibre and those made from virgin fibre, they will consistently buy the recycled product.
This system has the following advantages:
Collection site testing incentive program. Over the years, Shaw has found that the content of baled carpet bundles is consistently above 98% nylon 6, due to their incentive program. | |||||
Customer preference for recycled product. Having a recycling process for carpet production translates to increased customer sales. | |||||
Economies of scale. Having an industry‐wide, nation‐wide collection program helps promote efficiencies in transportation and processing of used carpet. | |||||
This system's major challenge is capital investment and costs of production. Under current conditions, production costs of recycled fibre slightly exceed the cost to purchase raw material. However, changing conditions, such as an increase in the cost of oil, may make recycled fibre more cost‐effective.
Framework configuration:
Shaw's carpet fibre recycling system is an industry‐wide collection system with the advantage of distributed sort/test. Although the recycled fibre is used in its original manufacturing facility, the recycling processing is performed at a secondary facility, which is typical for an industry‐wide collection system. The distributed sort/test feature is an improvement over the prior carpet case study listed in the paper by Realff et al. (Citation2000). The advantage of testing at the collection site is that the returned product is pre‐sorted, avoiding excess transportation costs for non‐nylon 6 carpet.
5. Discussion and future research
Reverse logistics complicates the supply chain. Often the reverse flow network is added as a solution to end‐of‐life product returns, and does not take advantage of efficiencies in the existing supply chain. A better understanding of the tradeoffs inherent in network design decisions is essential for producers and industries to develop efficient reverse logistics networks.
In this paper, we identified key tradeoff considerations for network design decisions, adapted from prior frameworks and by case study analysis of 13 case studies. We classified an additional 24 case studies using our framework to evaluate the tradeoff considerations, and we applied the framework to three new case studies. The identification of network configurations with tradeoff considerations provides a structured approach for new manufacturers to begin the process of designing their reverse logistics networks. Our classification of 37 case studies and three new case studies provides examples across products and industries for new manufacturers to learn from.
Future work will include a decision making model that integrates quantitative detailed models with high level configuration decisions to quantity the tradeoffs and assess the efficiency of network design, using multi‐objective programming and probabilistic approaches for managing uncertainties.
Related Research Data
References
- Barros , A. I. , Dekker , R. and Scholten , V. 1998 . A two‐level network for recycling sand: a case study. . European Journal of Operational Research , 110 : 199 – 214 .
- Bartel , T. 1995 . “ Recycling program for printer toner cartridges and optical photoconductors. ” . In Proceedings, IEEE International Symposium on Electronics and the Environment 225 – 228 . 1–3 May 1995, Orlando, FL
- Bloemhof‐Ruwaard , J. M. 1996 . An environmental life cycle optimization model for the European pulp and paper industry. . Omega , 24 : 615 – 629 .
- Carter , C. R. and Ellram , L. 1998 . Reverse logistics: a review of the literature and framework for future investigation. . Journal of Business Logistics , 19 (1) : 85 – 102 .
- Chang , N.‐B. and Wei , Y. L. 2000 . Siting recycling drop‐off stations in urban area by genetic algorithm‐based fuzzy multiobjective nonlinear integer programming modeling. . Fuzzy Sets and Systems , 114 : 133 – 149 .
- De Brito , M. P. and Dekker , R. 2003a . “ A framework for Reverse logistics (January). ” . Econometric Institute Report Series ERS‐2003‐045‐LIS, Erasmus University Rotterdam
- De Brito , M. P. and Dekker , R. 2003b . Modelling product returns in inventory control – exploring the validity of general assumptions. . Production Economics , 81–82 : 225 – 241 .
- De Brito , M. P. , Dekker , R. and Flapper , S. D. P. 2003 . “ Reverse logistics – a review of case studies (April). ” . ERIM Report Series ERS‐2003‐012‐LIS, Erasmus University Rotterdam
- Del Castillo , E. and Cochran , J. K. 1996 . Optimal short horizon distribution operations in reusable container systems. . Journal of the Operational Research Society , 47 : 48 – 60 .
- Díaz , A. and Fu , M. C. 1997 . Models for multi‐echelon repairable item inventory systems with limited repair capacity. . European Journal of Operational Research , 97 : 480 – 492 .
- Duhaime , R. , Riopel , D. and Langevin , A. 2001 . Value analysis and optimization of reusable containers at Canada post. . Interfaces , 30 (3) : 3 – 15 .
- Farrow , P. H. , Johnson , R. R. and Larson , A. L. 2000 . Entrepreneurship, innovation, and sustainability strategies at Walden Paddlers, Inc. . Interfaces , 30 (3) : 215 – 225 .
- Flapper , S. D. P. 1996 . “ Logistic aspects of reuse. ” . In First International Working Seminar on Reuse 109 – 118 . 11–13 November 1996, Eindhoven University of Technology Eindhoven, The Netherlands
- Fleischmann , M. 2000 . “ Quantitative Models for Reverse Logistics. ” . Thesis (PhD). Erasmus University Rotterdam
- Fleischmann , M. 1997 . Quantitative models for reverse logistics: a review. . European Journal of Operational Research , 103 : 1 – 17 .
- Fleischmann , M. 2000 . A characterisation of logistics networks for product recovery. . Omega , 28 : 653 – 666 .
- Fleischmann , M. 2001 . The impact of product recovery on logistics network design. . Production and Operations Management , 10 (2) : 156 – 173 .
- Fleischmann , M. 2004 . “ Chapter 4: reverse logistics network design. ” . In Reverse Logistics Quantitative Models for Closed‐Loop Supply Chains , Edited by: Dekker , R . Berlin : Springer‐Verlag .
- Guide , V. D. R. Jr. and van Wassenhove , L. N. 1997 . Rough‐cut capacity planning for remanufacturing firms. . Production Planning and Control , 8 (3) : 237 – 244 .
- Guide , V. D. R. Jr. and van Wassenhove , L. N. 2001 . Managing product returns for remanufacturing. . Production and Operations Management , 10 (2) : 142 – 155 .
- Gupta , T. and Chakraborty , S. 1984 . Looping in a multistage production system. . International Journal of Production Research , 22 (2) : 299 – 311 .
- Hong , I.‐H. 2006 . Planning the e‐scrap reverse production system under uncertainty in the State of Georgia: a case study. . IEEE Transactions on Electronics Packaging Manufacturing , 29 : 150 – 162 .
- Klausner , M. and Hendrickson , C. T. 2000 . Reverse‐logistics strategy for product take‐back. . Interfaces , 30 (3) : 156 – 165 .
- Kleineidam , U. 2000 . Optimising product recycling chains by control theory. . International Journal of Production Economics , 66 : 185 – 195 .
- Krikke , H. R. , van Harten , A. and Schuur , P. C. 1999a . Business case Océ: reverse logistic network re‐design for copiers. . OR Spektrum , 21 : 381 – 409 .
- Krikke , H. R. , van Harten , A. and Schuur , P. C. 1999b . Business case Roteb: recovery strategies for monitors. . Computers and Industrial Engineering , 36 : 739 – 757 .
- Kroon , L. and Vrijens , G. 1995 . Returnable containers: an example of reverse logistics. . International Journal of Physical Distribution & Logistics Management , 25 (2) : 56 – 68 .
- Krumwiede , D. W. and Sheu , C. 2002 . A model for reverse logistics entry by third‐party providers. . Omega , 30 : 325 – 333 .
- Linton , J. and Johnston , D. A. 1999 . A decision support system for planning remanufacturing at Nortel Networks. . Interfaces , 30 (6) : 17 – 31 .
- Listeş , O. and Dekker , R. 2005 . A stochastic approach to a case study for product recovery network design. . European Journal of Operational Research , 160 : 268 – 287 .
- Louwers , D. 1999 . A facility location allocation model for reusing carpet materials. . Computers and Industrial Engineering , 36 : 855 – 869 .
- Maslennikova , I. and Foley , D. 2000 . Xerox's approach to sustainability. . Interfaces , 30 (3) : 226 – 233 .
- McGavis , D. 1994 . “ The energy bucket and a not‐so‐drop‐in‐the‐bucket portion of the waste stream, consumables. ” . In Proceedings, IEEE International Symposium on Electronics and the Environment 2267 – 2272 . 2–4 May 1994, San Francisco, CA
- McIntyre , K. 2007 . “ Delivering sustainability through supply chain management. ” . In Global logistics: new directions in supply chain management , Edited by: Waters , D . 238 – 252 . London : Kogan Page Limited . In
- Meade , L. , Sarkis , J. and Presley , A. 2007 . The theory and practice of reverse logistics. . International Journal of Logistics Systems and Management , 3 (1) : 56 – 84 .
- Meyer , H. 1999 . Many happy returns. . Journal of Business Strategy , 20 (4) : 27 – 31 .
- Nagel , C. and Meyer , P. 1999 . Caught between ecology and economy: end‐of‐life aspects of environmentally conscious manufacturing. . Computers and Industrial Engineering , 36 : 781 – 792 .
- Realff , M. J. , Ammons , J. C. and Newton , D. 2000 . Strategic design of reverse production systems. . Computers and Chemical Engineering , 24 : 991 – 996 .
- Realff , M. J. , Ammons , J. C. and Newton , D. 2004 . Robust reverse production system design for carpet recycling. . IIE Transactions , 36 : 767 – 776 .
- Rubio , S. , Chamorro , A. and Miranda , F. J. 2008 . Characteristics of the research on Reverse Logistics (1995–2005). . International Journal of Production Research , 46 (4) : 1099 – 1120 .
- Rudi , N. , Pyke , D. F. and Sporsheim , P. O. 2000 . Product recovery at the Norwegian National Insurance Administration. . Interfaces , 30 (3) : 166 – 179 .
- Seitz , M. A. and Peattie , K. 2004 . Meeting the closed‐loop challenge: the case of remanufacturing. . California Management Review , 46 (2) : 74 – 89 .
- Spengler , T. 1997 . Environmental integrated production and recycling management. . European Journal of Operational Research , 97 : 308 – 326 .
- Staikos , T. and Rahimifard , S. 2007 . A decision‐making model for waste management in the footwear industry. . International Journal of Production Research , 45 (18–19) : 4403 – 4422 .
- Thierry , M. 1995 . Strategic issues in product recovery management. . California Management Review , 37 (2) : 114 – 135 .
- Thomas , M. Jr. 1997 . Emerging technology: production scheduling matures. . IIE Solutions , : 25 – 29 . January
- Toktay , L. B. , Wein , L. M. and Zenios , S. A. 2000 . Inventory management of remanufacturable products. . Management Science , 46 (11) : 1412 – 1426 .
- Wang , C.‐H. , Even , J. C. Jr. and Adams , S. K. 1995 . A mixed‐integer linear model for optimal processing and transport of secondary materials. . Resources, Conservation and Recycling , 15 : 65 – 78 .
- Yender , G. L. 1998 . “ Battery recycling technology and collection processes. ” . In Proceedings, IEEE international symposium on electronics and the environment 30 – 35 . 4–6 May 1998, Oak Brook, IL