
 ?Mathematical formulae have been encoded as MathML and are displayed in this HTML version using MathJax in order to improve their display. Uncheck the box to turn MathJax off. This feature requires Javascript. Click on a formula to zoom.
ABSTRACT
This paper presents design of a stand-alone hybrid photovoltaic (PV) energy system according to the daily electrical load demand of remote healthcare centre located in Madhya Pradesh, India. It employs an optimal design and sizing of hybrid PV energy system (PV generator, battery, inverter and diesel generator) according to load demand. An economic analysis has been presented for selection of an optimum hybrid PV energy system using a hybrid optimisation model for electric renewable (HOMER) software. Paper also presents comparison of environmental aspects of hybrid PV energy system with conventional system. The initial costs of PV–diesel–battery and diesel–battery systems are $2,418 and $879, respectively. Net present cost of PV system is $13,523 and diesel system is $20,515. Results show that hybrid PV–diesel–battery energy system is more economical and environmentally friendly energy system for remote healthcare centre. Hence, it can be concluded that the renewable energy systems is a better option for healthcare centre in remote areas.
Abbreviation: PV: Photovoltaic; HOMER: Hybrid optimization model for electric renewable; IEA: International energy agency; RES: Renewable energy system; HES: Hybrid energy systems; BTS: Base transceiver station; NPC: Net present cost; COE: Cost of energy; OC: Operating cost; LCC: Life cycle cost; ALCC: Annualized life cycle cost; GHG: Greenhouse gases; DG: Diesel generator; NOCT: Nominal operating cell temperature; SOC: State of charge; CC: Capital cost; RC: Replacement cost; OM: Operation & management cost; BOS: Balance of system; CGE: Cost of generated electricity; DOD: Depth of discharge
1. Introduction
World’s energy demands are rising drastically because of population growth and industrial evolution. One of the most important issues of 21st century is to mitigate energy crises. Developed countries have fulfilled the requirement of energy but developing countries are facing the problem of energy deficit (Shafiee and Topal Citation2009). According to International Energy Agency (IEA), about 1.3 billion people in the world (or about 1 in 5) were without access to electricity in 2010. The major global challenges are to provide reliable and cost-effective energy services (IEA Report Citation2014). India is the world’s third largest electricity producer and fifth largest consumer of energy (Raghuwanshi and Arya Citation2019a). Due to the increasing demand for energy and even the shortage of the supplied energy to the total population from the organised electric system, the implementation of electric generation system required other sources of energy. Renewable energy played an important role in our society and fulfilled the energy requirement. Renewable energy systems (RES) help to mitigate the emission of greenhouse gases (GHG) to the environment and reduce their impact on environmental changes (global warming) (Barzola, Espinoza, and Cabrera Citation2016). The renewable energy technologies have been progressing day to day and increases opportunity for exploitation of non-conventional resources. Sun is the main renewable energy source for the earth. The earth absorbs about GW solar energy daily. Solar cells modules are used to harness solar energy. Solar cell directly converts solar energy into electrical energy (Paridaa, Iniyan, and Goic Citation2011). For the optimal use of renewable energy sources, hybrid energy systems (HES) are used. HES is an excellent technique for generation of electricity for remote and rural areas. HES is more reliable and cost-effective as compared to individual RES (Jiang and Zhu Citation2011).
Renewable energy power projects aim to produce electrical energy. It is necessary to choose the most economic energy supply route for a given requirement. A large number of energy systems with their unique peculiar features is available (Cavazzini et al. Citation2016). The energy of solar system is diurnal and generally requires storage for its use, whereas wind energy is fluctuating and intermittent and generally requires a grid connection to maintain steady supply. To get a meaningful insight of these complex alternatives, a systematic evaluation of their financial and economic aspects is essential (Raghuwanshi and Gupta Citation2015; Das Barun and Zaman Citation2019).
Many researchers investigated optimised hybrid (photovoltaic (PV)–battery–diesel) system using different software, i.e. HOMER, MATLAB, etc. Numbers of studies suggested hybrid PV energy system for remote areas electrification.
A study was presented in Nigeria for techno-economic analysis of solar–wind–diesel with battery backup for electrification of mobile base transceiver station (BTS). Two best optimal hybrid systems (PV–diesel–battery and PV–wind–diesel–battery) were compared in terms of net present cost (NPC), cost of energy (COE), CO2 emissions and sensitivity analysis. Finally, from environmental and economic benefit point of view, hybrid PV–diesel–battery system configuration is accepted as compared to conventional system (Olatomiwa et al. Citation2015b, Citation2015a). In reference (Madziga, Rahil, and Mansoor Citation2018) three different configurations (PV–battery system, PV with diesel system and PV–diesel–battery system) of hybrid PV energy system were presented for fulfilment of energy demand, economy and environmental friendly system for a remote village, Gwakwani, in South Africa. A study was performed in Delhi, India, to analyse three HES configurations (Grid only, PV and grid and PV–diesel). These configurations are compared with economic (Operating cost (OC), COE, NPC) and GHG emission point of view (Usman et al. Citation2018). Life-cycle cost (LCC), annualised life-cycle cost (ALCC) and COE are evaluated for economic effectiveness of hybrid PV system to supply the electrical energy for a small building. Olatomiwa et al. (Citation2018) presented stand-alone hybrid RESs for healthcare services in the rural areas located in Nigeria. It employs an optimal techno-economic analysis of hybrid RESs electrical power systems and its components (wind, PV, battery and inverter) using HOMER software.
Based on these facts, hybrid PV systems were considered as an optimal solution in remote areas, to improve system reliability, reducing GHG emissions and overall system cost.
Literature studies show that to find out the most favourable hybrid RES for remote areas techno-economic analysis is used. Most of the studies compare different HES configurations with conventional system. Sizing of the RES according to daily load demand is not considered in the above studies. From environmental point of view, GHG and life cycle CO2 emissions (g CO2/kWh) of different stages of hybrid PV systems have been calculated and compared with conventional system. This has not done in previous literature. Additionally, annual cost saving and payback period of the system have also been calculated. Therefore, this research study presents optimal sizing and economic analysis of the hybrid PV energy system and conventional system. Detailed comparison analyses are carried out in terms of economic and environmental aspects for different configurations.
2. Stand-alone hybrid PV system
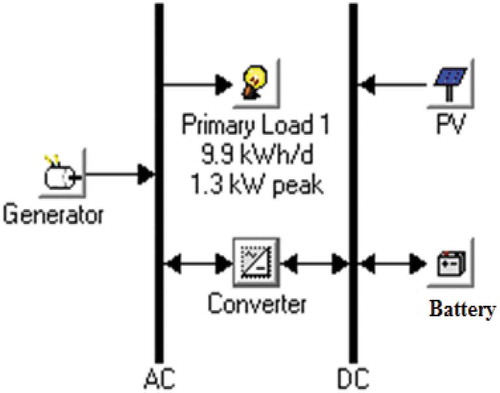
A hybrid PV energy system is a system that uses more than one resource to fulfil electrical demand of the load. One of these is a PV source and other resources may be diesel generator (DG), wind generators, fuel cells, etc. The best cost-effectiveness is generally obtained when PV energy capability is fully utilised. The integrated system provides back up support and better reliability. The complete design of stand-alone hybrid PV system to fulfil the load demand is shown in . The hybrid PV system consists of a PV generator, converter (DC–DC), battery and charge controller, inverter, DG set and load.
Figure 1. Stand-alone solar energy system for remote healthcare centre.
2.1 PV generator
The PV generator converts solar energy into DC electrical energy. The PV generator is linked to the DC–DC converter with MPPT to control the input voltage of the inverter.
The PV generator output power is given as follows (Raghuwanshi and Arya Citation2019b):
Where is output power of PV generator,
is rated power of PV generator,
is derating factor (%) of PV generator,
is solar insolation (W/m2),
is solar insolation under standard conditions (1 kW/m2),
is temperature coefficient,
is cell temperature,
is cell reference temperature (25°C).
The cell temperature is as follows (Raghuwanshi and Arya Citation2019b),
Where, is ambient temperature (20°C), nominal operating cell temperature (NOCT) is the temperature reached by a cell in open circuit module under 800 W/m2 insolation.
The annual generated solar PV energy is as follows (Abu-Hamdeh and Alnefaie Citation2019),
2.2. DC–DC converter
In DC to DC converter the output voltage can be lower or higher or both as compared to input voltage. These converters play a very important role in hybrid PV systems where they are used with MPPT, battery charger, etc. Generally, three types of converters (buck, boost and buck-boost) are used in PV system. Usually, buck-boost converter is used. The output voltage of the buck-boost converter is given as (Solanki Citation2009),
DC–DC converter can be controlled to present optimum impedance at the PV generator terminals that facilitate maximum power extraction from the PV generator. Input side expression for the converter impedance is express as follows (Solanki Citation2009),
Where, is the output voltage of the converter (V), D is the duty cycle,
is the load side impedance.
2.3 Battery and charge controller
In a hybrid PV system, batteries are required as energy storage or backup energy system. Battery energy system is generally used, when solar insolation is not available during non-sunshine hours. In this study, PV generator is connected to the DC bus, via a converter and charge controller, at which battery is connected. The battery is used to store/supply power and also to help during starting of the DG and load changing. A charge controller is used to prevent overcharging or deep discharging of the batteries and to preserve their life and better performance. Charge controller sense the state of charge of the batteries and prevent battery from overcharge or deep discharge by disconnecting the battery from PV generator or load.
The voltage at the battery terminal is given as follows (Mandal, Das, and Hoque Citation2018)
The battery terminal voltage is calculated as (Mandal, Das, and Hoque Citation2018)
Where, is the internal battery voltage (V),
is the battery voltage constant (V), SOC: State of charge,
is the battery current (A), A is the exponential amplitude (V), K is exponential time constant inverse (1/Ah), Q is the battery capacity.
2.4 Inverter
Inverter is a device that converts DC power into AC power at desired output voltage and frequency. The DC power input to the inverter may be battery or PV generator. Typically, inverter input voltage and current ranges from 12 to 72 V and 1 to 10 A, respectively. The output voltage of single-phase inverter is 240 V at 50 Hz. The efficiency of the inverter is as follows (Solanki Citation2009)
Where, is the AC output power (kW),
is the DC input power (kW).
2.5 Diesel generator
In this research work, a DG set is considered as a backup. DG set is a good option for auxiliary power supplies in general and particularly for non-sunshine hours. DG set is connected to the direct AC load. The fuel consumption of the DG for electricity generation is given as follows (Raghuwanshi and Arya Citation2019b),
Where, is rated power of DG,
is output power of DG,
is fuel curve intercept coefficient (0.000205 m3/h),
is fuel curve slope (0.00025 m3/h/kW).
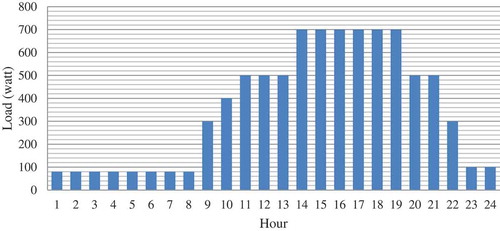
2.6 Load profile
shows working days average load profile of healthcare centre to carry out the economic analysis. The daily energy demand is 4635 W h/day. In the morning hours (6–9 am), average energy demand is 100 W h/day and in the evening hours (4–8 pm) average energy demand is 700 W h/day.
Figure 2. Daily load demand of the site.
3. Economic analysis
System LCC is calculated using HOMER software. LCC includes three cost components, i.e. initial capital cost (CC), replacement cost (RC), operation & management (OM) cost. These cost components should be known at the time of making investment decision. The component CC is known at the time of investment, but other two (OM and replacement) cost occur in future. CC of a PV system is proportional to its rated output power. It includes cost of the PV array, balance of system (BOS) costs, PV module support structure, cabling costs, controller, chargers, inverter, storage batteries, metering, land and foundation cost. CC of PV system is higher and OM cost is extremely low as compared with other renewable and non-RESs. OM cost can be divided into two categories: fixed costs which are not connected to the plant output; and variable costs, which are directly proportional to the output of the system. Fixed costs include site insurance, regular safety, insurance and variable cost includes fuel handling, wear and tear, etc. (Raghuwanshi and Arya Citation2019b; Solanki Citation2009).
The cost is calculated for the lifetime of the system, it is important to consider time value. There are two ways in which the value of money changes over time: inflation rate (i) and discount rate (d). The inflation rate accounts decline in the value of money over time. If the cost of product is Cp, then its cost, a year later will be and so on. The future cost of n year
, due to inflation rate, can be given (Kolhe, Kolhe, and Joshi Citation2002)
The discount rate gives the increase in value of money with respect to future value of money while the interest rate gives the increase in value of money with respect to current value of money.
Similarly, as inflation rate, increment in value of money in n year, M(n) due to discount rate, d as follows (Kolhe, Kolhe, and Joshi Citation2002),
Where, is the amount of money. The value of the money increases when the discount rate is higher than the inflation rate.
Present worth (pw) of a product is defined as the amount of money that needs to be invested today with discount rate and inflation rate, to purchase the product in future (n year later). Suppose, today, a product cost is not same in future RC of that product, because of the inflation rate increases and discount rate (assume higher than the inflation rate) also increases.
PW factor for future one-time investment is the ratio of the future cost to future value of the product (Kolhe, Kolhe, and Joshi Citation2002; Wongyu et al. Citation2018).
The present cost of the product is C0, and then its present worth value for one-time investment n year down the line would be given as
LCC analysis required expenditure cost of fuel and maintenance cost. PW of future investment is obtained by using EquationEq. (14)(14)
(14) where recurring investment is estimated in one time in a year.
Thus the present worth of recurring investment for the entire life of the system is (when the investment is done at the beginning of the year) (Wongyu et al. Citation2018)
Thus PW of recurring investment for the entire life of the system is (when the investment is done at the end of the year)
LCC of the energy system is the sum of the present value of all product costs over the lifetime of the product (Raghuwanshi and Arya Citation2019b).
Where, CC is the initial capital costs, RC is the present value of the replacements cost, FC is the fuel cost and OM is the present value of all future operation and maintenance.
Annualised LCC (ALCC): ALCC calculates the cost of the system that may occur every year. Therefore, ALCC is obtained by (Olatomiwa et al. Citation2018),
Cost of generated electricity (CGE): CGE is the ALCC of a given source and divided by the annual kWh generated by the system. CGE is as follows (Olatomiwa et al. Citation2018)
Operating cost: The operating cost is the difference between total annualised cost and total annualised CC (). Operating cost is as follows (Vides-Prado et al. Citation2018),
Net Present Cost (NPC): The total NPC is accounted CC, RC, OM and FC over its lifetime of the system. Total NPC of the system is as follows (Vides-Prado et al. Citation2018),
Where, is total annualised CC ($/year), CRF is a function returning the capital recovery factor, ir is the annual interest rate (%), and
is the system lifetime (year).
Payback period: after investing money into a solar PV system, it is required to determine what time period is required to recover the invested money. The period within which the invested money can be recovered is known as payback period. The calculation of payback period can be done by estimating payback period and LCC of the system. The simple payback period is the amount of time that is calculated by dividing the initial investment in a PV system and annual COE saving due to the PV system (Das et al. Citation2017).
4. Sizing of stand-alone hybrid PV energy system
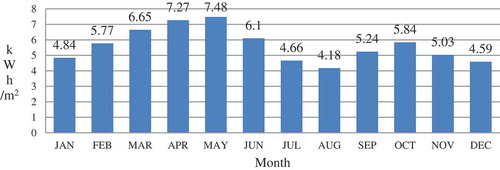
A healthcare centre located in Bijalpur village, near Indore city of Madhya Pradesh is considered as a case study in this research work. The average value of solar radiation intensity in Indore (latitude 22.6647°N and longitude 75.8359°E) is 5.63 kWh/m2/day is shown in (Raghuwanshi and Khare Citation2018).
Figure 3. Average monthly solar radiation at the selected site (Raghuwanshi and Khare Citation2018).
Sizing of stand-alone PV or DG system is being planned for remote area healthcare centre. Most of the stand alone PV applications require battery arrangement for smooth operation of the load during non-sunshine hours and different climate conditions. The healthcare centre load consists of a CFL, TV, fan, refrigerator, computer and other medical equipment. Most of the loads are of AC type, which requires an inverter and battery backup. Overall sizing of system is explained as follows:
Step-1: Determine the total load in Watt-hour
The energy consumption of each load calculated and tabulated in the .
Table 1. The energy consumption of each load.
The daily load consumption is 4635 Wh.
Step-2: Determine inverter rating
The required load is supplied from battery through an inverter. The input and output end of the inverter should be able to handle current according to load requirement. The output voltage of inverter is 240 V, 50 Hz. The total load connected to the inverter is (737/0.93 = 792 W), assuming 7% loss through the energy conversion (Solanki Citation2009). Therefore, the energy supplied to the inverter input should be more than the power used by the load. It is assumed that inverter efficiency as 93%. The energy supplied by the battery to inverter input is 4635/0.93 = 4983.8 Wh. For optimising power loss and system loss PV system voltage is 24 V (Latunussa et al. Citation2016).
Step-3: Sizing of batteries
The total energy required from battery is 4983.8 Wh. The sizing of the battery bank require three parameters, i.e. depth of discharge (DoD), ampere-hours (Ah) and number of days autonomy.
Battery rating is assumed 12 V, 100Ah capacity with 70% DoD (Solanki Citation2009). The energy required to be supplied by the battery bank is 4983.8Wh and PV system terminal voltage is 24 V. Hence, required charge capacity is as follows (Latunussa et al. Citation2016; Khan Citation2017),
Number of batteries required
The battery bank is needed to supply 24 V and 207.6 Ah, so it needs two 12 V, 100 Ah battery connected in series and three such series combinations are connected parallel. Hence total six batteries (12 V, 100 Ah) are required for battery bank.
Step-4: Sizing of PV module
For sizing of PV module following parameters are of concern:
Voltage, current and power of the module
Solar insolation in given location
Efficiency of batteries
Temperature of given location
Efficiency of the MPPT, charge controller and inverter
Dust level in working environment
PV module capacity depends on the daily requirement of the load. The daily energy supplied by the battery bank is 4983.8 Wh. The efficiency of the battery is in the range 80–90% (Solanki Citation2009). The efficiency of battery is assumed 85%. The input of the battery bank is (Latunussa et al. Citation2016; Khan Citation2017)
The charge controller feeds the power into battery bank. The controller efficiency is about 90% (Solanki Citation2009). The PV panel output of the controller is
It is assumed that total energy losses account around 16% due to degraded (dust, heat, etc.) solar module and cable loss (Khan Citation2017). PV panel input energy is 7556.93 Wh. The PV panel supply voltage is 24 V. Total Ah generated by the PV panel is
Solar PV module power capacity is measured at a solar radiation of 1000 W/m2. The daily 6 h peak sunshine is available in the location of the case study. Current of the PV panel is (Khan Citation2017)
In the Indian market, the availability of typically PV panel power capacity is in the range is 5—300 W with 1000 W/m2 at 25°C. This case study used solar panel ALP-250W. The typical solar panel ALP-250W voltage value is 29.5 V and current is 8.35 A (Raghuwanshi and Khare Citation2018). The numbers of PV panels required to fulfil the current requirement are (Khan Citation2017)
This study required roundup seven PV panels, which are connected in parallel and supplied total 58.45 A current and 29.5 V.
5. Results and discussion
List of various components of the PV system and their cost is given in . The cost of components have taken from the online e-commerce website, manufacturer and equipment suppliers and converted from Indian rupees to American dollar price value.
Table 2. Various components cost of the PV system.
shows design of PV–diesel–battery energy system using HOMER software. Hybrid PV energy system capacity is shown in . The generation system is connected with load which fulfils power demand. In this research work, inflation rate and discount rate are taken as 7.5% and 10%, respectively (Kolhe, Kolhe, and Joshi Citation2002).
Table 3. Hybrid PV system capacity.
Figure 4. Hybrid PV–battery–DG energy system.
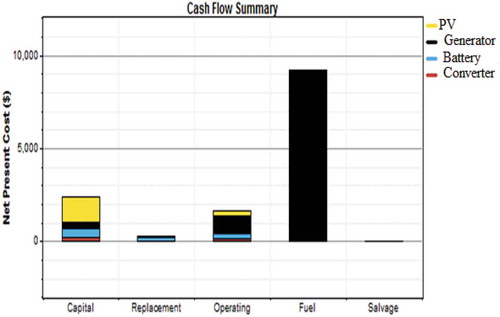
NPC of the system is (CC, RC, OC, FC and salvage cost) tabulated in . The total NPC and ALCC of PV–diesel–battery system are $13,523 and 1058$/years, respectively. The OC and CGE of PV–diesel–battery system are $869/year and $0.293/kWh, respectively. shows that NPC cash flow summary in terms of cost. The CC of the PV energy system is higher than DG set. The operating cost of DG system is higher than PV and battery system. It is clear from , FC is highest as compared to another cost.
Table 4. Net present costs of PV–diesel–battery system.
Figure 5. NPC cash flow summary in terms of cost type.
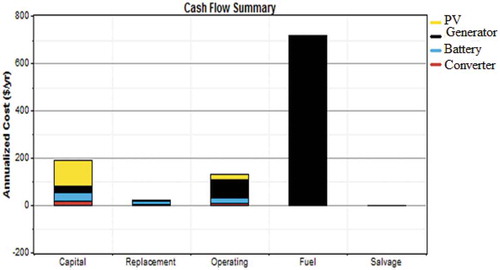
shows the annualised components of cost for PV system. The CC of the PV system is higher than other components of the system. The annualised fuel cost of the DG system is higher than all other system cost. The annualised cost of the system (CC, RC, OC, FC and salvage cost) shown in . The CC of the PV–battery energy system is higher than the DG annualised CC. The OC of the DG is higher than the PV and battery system. The fuel cost of the DG is higher than the other cost.
Figure 6. Annualised cash flow summary in terms of components.
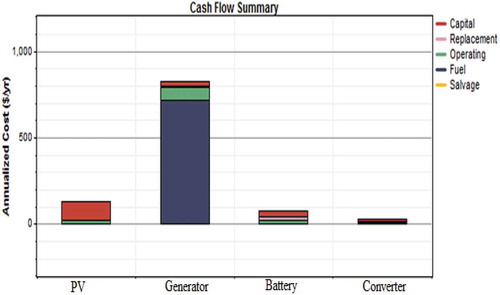
Figure 7. Annualised cash flow summary in terms of cost.
HOMER software gives results of various considered system, i.e. stand-alone PV only, hybrid PV, stand-alone DG only, hybrid DG, etc. In this study, one best non-conventional (PV–diesel–battery) and one best conventional (diesel–battery) system have been selected for comparison. Let us now calculate LCC for PV–diesel–battery system, as well as diesel–battery system. PW factor of future investment in batteries (to be replaced five years) and diesel (to be bought every year) is calculated for PV–diesel–battery system. shows cost analysis of PV–diesel–battery and diesel–battery systems. Results show that the CC of the PV–diesel–battery system is higher than diesel–battery system. The other cost (OM, RC and FC) in diesel–battery is higher than PV–diesel–battery system.
Table 5. Cost analysis of PV–diesel–battery and diesel–battery systems.
The cost comparison analysis of two systems (PV–diesel–battery vs. diesel–battery) using HOMER software is presented in . The initial cost of PV–diesel–battery and diesel–battery systems are $2418 and $879, respectively. NPC of PV system is $13,523 and diesel system is $20,515. illustrates that PV–diesel–battery is more reliable and cost-effective as compared to diesel–battery system.
Table 6. Comparison between stand-alone PV–diesel–battery vs. diesel–battery system.
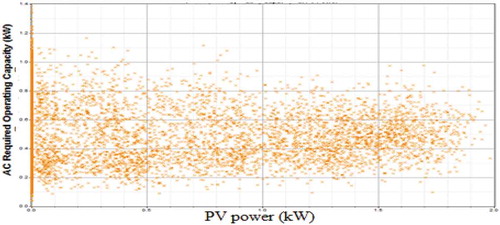
shows PV–diesel–battery system cash flow in 25 years. In the starting year PV system CC is highest. Next year fuel cost is highest and every fourth-year batteries are replaced so required minimum CC. illustrates monthly average electricity production by PV and DG set. It is clear from the figure the contribution of the PV system is 70% (January, February, March, April, May, October, November and December) of the total power and rest 30% comes from the DG set. illustrates that the AC required operating capacity (load demand) vs. PV generated power. The results show that the PV system is fully satisfied with the load demand.
Figure 8. Nominal cash flow vs. number of year for PV–diesel–battery system.
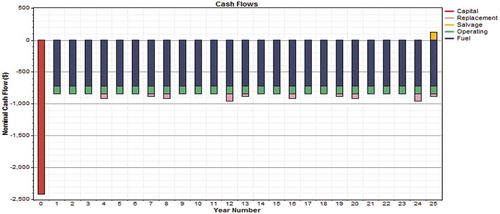
Figure 9. Monthly average electric production of PV and Diesel system.
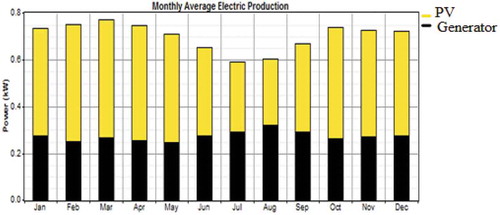
Figure 10. Required operating capacity (load demand) vs. PV generated power.
5. Socio-economic aspects
Electricity grids are often non-existing in rural areas and all forms of conventional energy are usually very expensive. In such remote areas, PV energy system can be highly competitive with other forms of energy supply especially in countries with high solar radiation level (5.63 kWh/m2) and its use is growing very rapidly. According to renewable energy report, 2014 (Ren21 Citation2014), increased interests in the use of solar PV energy system in remote areas include multiple applications (irrigation, light load, etc.), improved competitiveness, encouraged by support policies and rapid reductions in cost for many renewable technologies. Solar PV cost is declined by around 50% between 2010 and 2014. In this case study, DG produced pollutant gases and small carbon particles. The pollutant gases have increased ozone formation, smog and acid rain. Unburned hydrocarbons and particulate matter have created a significant health risk, e.g. lung cancer, asthma and bronchitis.
Referring , total cost of the PV system is 2518$. PV system is designed to supply 4.635 kWh/day. In India, the remote areas DG generated electricity cost is 10 Rs./unit = 0.15$/unit. Then the annual cost saving of PV system is (Rajoriya and Fernandez Citation2013):
From the EquationEq. (22)(22)
(22) payback period is calculated as,
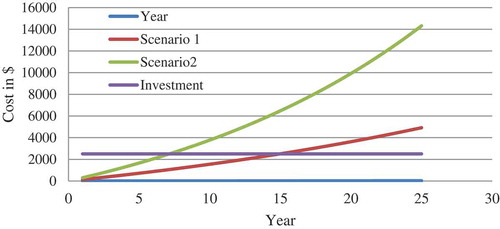
In this system, payback period is about 10 years and the solar panels service life is about 25 years, which means 15 years of free energy after the payback period is left for use. The cost saving of this study is shown in . Scenario 1 has taken present grid-connected electricity cost 0.075$/kWh and yearly 3% energy cost (unit/kWh) increase. Scenario 2 has taken present DG connected electricity cost 0.167$/kWh and yearly 5% energy cost (unit/kWh) increase.
represents the graphical analysis of cost saving between cumulative cost and number of years. The investment rate is constant at $2500/year. shows two scenarios is taken into account for cost saving. As seen from the graph, for 1st scenario the cost saving has been started after say 15 years and for scenario 2nd the same will be achieved after say 7 years. After 25 years, scenario one has $2422 cost saving and scenario 2 have $11,818 cost saving.
From the above, it is concluded that hybrid PV system will have positive impact on both public and environment.
6. Environmental impact assessment
shows that GHG emission of PV–diesel–battery and diesel–battery system. PV–diesel–battery system causes less GHG emission as compare to diesel–battery system. It is clear that RES emit less pollutant and it is the best options for improving climate conditions.
Table 7. Emission analysis of PV–diesel–battery and diesel–battery systems.
DG emits the GHG e.g. carbon dioxide (CO2), sulphur oxides, nitrogen oxides, carbon monoxides, unburned hydrocarbons and particles. These pollutants degrade environment, land, water, wildlife, and cause various health problems in human beings. CO2 gas is mainly responsible for global warming and acid rain. According to the national renewable energy laboratory (National Renewable Energy Laboratory report Citation2017), PV systems, GHG life-cycle emission rate range is 40–80 g CO2eq/kWh. The range is depending on some factors, such as the quantity of silicon, module efficiency, irradiation conditions and lifetime period. Most of DG life-cycle GHG emissions range between roughly 700 and 900 g CO2eq/kWh. This case study of hybrid PV–diesel–battery system has emitted 342 g CO2eq/kWh and diesel–battery system has emitted 641 g CO2eq/kWh. PV–diesel–battery system has lower emission rate about 53.3% as compared to diesel–battery system.
shows the complete lifecycle stages of CO2 emission of PV–diesel–battery and diesel–battery system. The upstream process consists of raw material extraction, material production, module manufacture, plant component manufacture, installation and plant construction. The upstream process emission is about 65% of total CO2 emission (g CO2/kWh) rate. The operational process consists of power generation and system/plant OM. The operational processes emission is about 24% of total CO2 emission (g CO2/kWh) rate. The downstream processes emission is about 11% of total CO2 emission (g CO2/kWh) rate. The downstream process consists of system/plant decommissioning and disposal.
Table 8. PV–diesel–battery and diesel–battery systems life cycle stages of CO2 emission in g CO2/kWh (Zhao et al. Citation2012).
PV–diesel–battery system life cycle GHG emissions from different stages are less than as compare to diesel–battery (conventional) energy system. With the growth of solar power the negative impact of power production on global world is reduced, since CO2 emissions are reduced. It also reduces air pollution which arises from NO2 and SO2 and also contributes to reduce pollution in regional environment.
Solar power systems (PV–diesel–battery) have a positive impact on the global and regional environment. From the environment point of view, solar power is the best option to produce electric power as compared to DG in remote areas.
The present research work has been compared with (Madziga, Rahil, and Mansoor Citation2018; Mandal, Das, and Hoque Citation2018; Halabi et al. Citation2017; Madziga, Rahil, and Mansoor Citation2018) present an optimal HES to meet the electrical demand in a reliable and sustainable manner for an off-grid remote village, Gwakwani, in South Africa. Three different scenario, i.e. PV systems with a DG, PV with battery storage, and PV with DG and battery storage have been analysed and select a PV with battery system in terms of energy demand satisfaction, system cost and pollution. Mandal, Das, and Hoque (Citation2018) presents six different cases of hybrid systems consists of PV, wind, diesel and battery system and select an optimal configuration basis of the lower COE and pollutant emissions and is compared with the grid connected and solar home systems. Halabi et al. (Citation2017) proposed an optimal configuration and compared with two existing system located in Pulau Banggi and Tanjung Labian, Sabah, Malaysia. The existing systems performances evaluated using economic and environmental analysis. Results show that the existing system is not designed optimally previous to installation.
The detailed comparison of the present work (Madziga, Rahil, and Mansoor Citation2018; Mandal, Das, and Hoque Citation2018; Halabi et al. Citation2017) on the basis of different parameters is shown in .
Table 9. The detailed comparison of present work with Madziga, Rahil, and Mansoor (Citation2018), Mandal, Das, and Hoque (Citation2018) and Halabi et al (Citation2017).
Figure 11. Annually cost saving graph.
It is clear from the , the main aim of all research work (Madziga, Rahil, and Mansoor Citation2018; Mandal, Das, and Hoque Citation2018; Halabi et al. Citation2017) is to select optimal HES in located area on the basis of technical, economic and environmental constraints. The present research work is additionally presented sizing, annualised cash flow in terms of components and cost, monthly average electric production, payback period and life cycle stages (upstream, operational and downstream processes) of CO2 emission in g CO2/kWh. These parameters are also essential for selection of optimal energy system. The outcome of this research work is to select optimal hybrid PV–diesel–battery energy systems that fulfil the energy demand with reliable, economy and sustainable manner.
7. Conclusions
A systematic analysis of RES is essential in terms of design and economic aspects. Such studies also help to optimise the allocation of funds by concentrating on those applications which are financially/economically more rewarding besides being socially acceptable and environmentally sustainable. This case study presented optimal sizing and LCC analysis of hybrid PV energy system. Economic analysis of hybrid PV–diesel–battery and diesel–battery (conventional) system have been accounted for 25 years. The initial cost of the hybrid PV–diesel–battery and diesel–battery are $2418 and $879, respectively. NPC of the PV–diesel–battery system and diesel–battery system are $13,523 and $20,515, respectively. PV–diesel–battery system emitted 342 g CO2eq/kWh and diesel–battery system emitted 641 g CO2eq/kWh. PV–diesel–battery system has lower emission rate is about 53.3% as compared to diesel–battery system.
The comparison of results shows that the hybrid PV energy system is more reliable and cost-effective as compared to conventional system. It is clear that hybrid PV energy system emits less pollutant and it is the best option for improving climate conditions.
Disclosure statement
No potential conflict of interest was reported by the authors.
Additional information
Notes on contributors
Santosh Singh Raghuwanshi
Santosh Singh Raghuwanshi is Assistant Professor in Department of Electrical Engineering, Medi-Caps University, Indore, MP, India. His research focuses on renewable energy, reliability, power electronics and drives. He has published more than twenty papers in international/National Journals and conferences.
Rajesh Arya
Rajesh Arya, ME, Ph.D is Associate Professor in the Department of Electrical Engineering, Medi-Caps University, Indore, MP, India. His area of research power system optimization, reliability engineering and application to renewable energy systems. He has published more than 25 papers in International/National Journals and Conferences.
References
- Abu-Hamdeh, N., and K. Alnefaie. 2019. “Techno-Economic Comparison of Solar Power Tower System/Photovoltaic System/Wind Turbine/Diesel Generator in Supplying Electrical Energy to Small Loads.” Journal of Taibah University for Science 13 (1): 216–224. doi:10.1080/16583655.2018.1556916.
- Barzola, J., M. Espinoza, and F. Cabrera. 2016. “Analysis of Hybrid Solar/Wind/Diesel Renewable Energy System for Off-Grid Rural Electrification.” International Journal of Renewable Energy Research 6 (3): 1146–1152.
- Cavazzini, G., A. Santolin, G. Pavesi, and G. Ardizzon. 2016. “Accurate Estimation Model for Small and Micro Hydropower Plants Costs in Hybrid Energy Systems Modelling.” Energy 103: 746–757. doi:10.1016/j.energy.2016.03.024.
- Das Barun, K., and F. Zaman. 2019. “Performance Analysis of a PV/Diesel Hybrid System for a Remote Area in Bangladesh: Effects of Dispatch Strategies, Batteries, and Generator Selection.” Energy 169: 263–276. doi:10.1016/j.energy.2018.12.014.
- Das, H. S., T. C. Wei, A. H. M. Yatim, and L. K. Yiew. 2017. “Feasibility Analysis of Hybrid Photovoltaic/Battery/Fuel Cell Energy System for an Indigenous Residence in East Malaysia.” Renewable and Sustainable Energy Reviews 76: 332–347. doi:10.1016/j.rser.2017.01.174.
- Halabi, L. M., S. Mekhilef, L. Olatomiwa, and J. Hazelton. 2017. “Performance Analysis of Hybrid PV/diesel/battery System Using HOMER: A Case Study Sabah, Malaysia.” Energy Conversion and Management 144: 322–339. doi:10.1016/j.enconman.2017.04.070.
- IEA Report, 2014. “When Measuring Energy Poverty, the Best and Latest Data Come from the IEA.” March 7. https://www.iea.org/newsroom/news/2014/march/when-measuring-energy-poverty-the-best-and-latest-data-come-from-the-iea.html
- Jiang, A., and Y. Zhu. 2011. “Life Cycle Cost Analysis of Residential Grid-Connected Solar Photovoltaic Systems in Florida.” International Journal of Construction Education and Research 7 (1): 71–81. doi:10.1080/15578771.2010.526443.
- Khan, B. H. 2017. Non-Conventional Energy Resource. 3rd ed. Chennai, India: Mc Graw Hill Education.
- Kolhe, M., S. Kolhe, and J. C. Joshi. 2002. “Economic Viability of Stand-Alone Solar Photovoltaic System in Comparison with Diesel-Powered System for India.” Energy Economics 24: 155–165. doi:10.1016/S0140-9883(01)00095-0.
- Latunussa, C. E. L., A. Gian Fulvio, R. Blengini, and M. Lucia. 2016. “Life Cycle Assessment of an Innovative Recycling Process for Crystalline Silicon Photovoltaic Panels.” Solar Energy Materials & Solar Cells 156: 101–111. doi:10.1016/j.solmat.2016.03.020.
- Madziga, M., A. Rahil, and R. Mansoor. 2018. “Comparison between Three Off-Grid Hybrid Systems (Solar Photovoltaic, Diesel Generator and Battery Storage System) for Electrification for Gwakwani Village, South Africa.” Environments 5 (57). doi:10.3390/environments5050057.
- Mandal, S., B. K. Das, and N. Hoque. 2018. “Optimum Sizing of a Stand-Alone Hybrid Energy System for Rural Electrification in Bangladesh.” Journal of Cleaner Production 200: 12–27. doi:10.1016/j.jclepro.2018.07.257.
- National Renewable Energy Laboratory report, 2017. “Life Cycle Assessment Harmonization”. https://www.nrel.gov/docs/fy13osti/57187.pdf
- Olatomiwa, L., R. Blanchard, S. Mekhilef, and D. Akinyele. 2018. “Hybrid Renewable Energy Supply for Rural Healthcare Facilities: An Approach to Quality Healthcare Delivery.” Sustainable Energy Technologies and Assessments 30: 121–138. doi:10.1016/j.seta.2018.09.007.
- Olatomiwa, L., S. Mekhilef, A. S. N. Huda, and O. S. Ohunakin. 2015a. “Economic Evaluation of Hybrid Energy Systems for Rural Electrification in Six Geo-Political Zones of Nigeria.” Renewable Energy 83: 435–446. doi:10.1016/j.renene.2015.04.057.
- Olatomiwa, L., S. Mekhilef, A. S. N. Huda, and K. Sanusi. 2015b. “Techno-Economic Analysis of Hybrid PV–Diesel–Battery and PV–Wind–Diesel–Battery Power Systems for Mobile BTS: The Way Forward for Rural Development.” Energy Science and Engineering 3 (4): 271–285. doi:10.1002/ese3.71.
- Paridaa, B., S. Iniyan, and R. Goic. 2011. “A Review of Solar Photovoltaic Technologies.” Renewable and Sustainable Energy Reviews 15: 1625–1636. doi:10.1016/j.rser.2010.11.032.
- Raghuwanshi, S. S., and R. Arya. 2019a. “Renewable Energy Potential in India and Future Agenda of Research.” International Journal of Sustainable Engineering. doi:10.1080/19397038.2019.1602174.
- Raghuwanshi, S. S., and R. Arya. 2019b. “Economic and Reliability Evaluation of Hybrid Photovoltaic Energy Systems for Rural Electrification.” International Journal of Renewable Energy Research 9 (1): 515–524.
- Raghuwanshi, S. S., and K. Gupta, 2015. “Modeling of a Single-Phase Grid-Connected Photovoltaic System Using MATLAB/Simulink” International Conference on Computer, Communication and Control (IC4), Indore, India, September 10–12. doi: 10.1109/IC4.2015.7375633.
- Raghuwanshi, S. S., and V. Khare. 2018. “Sizing and Modelling of Stand-Alone Photovoltaic Water Pumping System for Irrigation.” Energy & Environment 29 (4): 473–491. doi:10.1177/0958305X17752739.
- Rajoriya, A., and E. Fernandez. 2013. “Hybrid Energy System Size Optimization and Sensitivity Evaluation for Sustainable Supply in a Remote Region in India.” International Journal of Sustainable Energy 32 (1): 27–41. doi:10.1080/14786451.2011.592586.
- Ren21 2014. “Renewables 2014 Global Status Report”. http://www.ren21.net/Portals/0/documents/Resources/GSR/2014/GSR2014_full%20report_low%20res.pdf
- Shafiee, S., and E. Topal. 2009. “When Will Fossil Fuel Reserve Be Diminished?” Energy Policy 37 (1): 181–189. doi:10.1016/j.enpol.2008.08.016.
- Solanki, C. S. 2009. Solar Photovoltaics, Fundamentals, Technologies and Applications. PHI learning pvt.
- Usman, M., M. T. Khan, A. S. Ranab, and S. Ali. 2018. “Techno-Economic Analysis of Hybrid Solar-Diesel-Grid Connected Power Generation System.” Journal of Electrical Systems and Information Technology 5 (3): 653–662. doi:10.1016/j.jesit.2017.06.002.
- Vides-Prado, A., E. O. Camargo, C. Vides-Prado, I. H. Orozco, F. Chenlo, J. E. Candelo, and A. B. Sarmiento. 2018. “Techno-Economic Feasibility Analysis of Photovoltaic Systems in Remote Areas for Indigenous Communities in the Colombian Guajira.” Renewable and Sustainable Energy Reviews 82 (3): 4245–4255. doi:10.1016/j.rser.2017.05.101.
- Wongyu, C., B. P. Michael, D. W. Ryan, and R. M. Nelson. 2018. “An Economic Analysis Comparison of Stationary and Dual-Axis Tracking Grid-Connected Photovoltaic Systems in the US Upper Midwest.” International Journal of Sustainable Energy 37 (5): 455–478. doi:10.1080/14786451.2017.1294178.
- Zhao, R., P. Deutz, G. Neighbour, and M. McGuire. 2012. “Carbon Emissions Intensity Ratio: An Indicator for an Improved Carbon Labelling Scheme.” Environmental Research Letters 7 (1): 1–10. doi:10.1088/1748-9326/7/1/014014.