
 ?Mathematical formulae have been encoded as MathML and are displayed in this HTML version using MathJax in order to improve their display. Uncheck the box to turn MathJax off. This feature requires Javascript. Click on a formula to zoom.
ABSTRACT
The food processing industries significantly contribute to the consumption of fossil energy, materials, and other resources with commensurate GHG emissions. In this study, the Ecological Footprint (EF) assessment of four different food products (Pickles, Jams, Honey and Chutney) manufactured in a food processing industry (Merry Foods) in India has been presented. Simultaneously, the reduction potential in terms of the EF of the food products has also been estimated by suggesting the installation of some sustainable technologies.
The ecological footprint of packaged pickle, jam, honey and chutney products have been estimated as 1.67, 0.54, 15.94 and 2.18 gha/ton, respectively. The overall bio-productive land that had the maximum involvement for the food products’ processing at the industry was Cropland (85.7%) followed by CO2 absorption land (11.2%). The life cycle EF of suggested sustainable systems such as grid connected rooftop solar PV system, biogas plant, and rooftop rainwater harvesting system has been estimated as 56.18 gha, 1.33 gha, and 2.92 gha, respectively. Hence, the EF reduction potential of the food products by using all the suggested sustainable technologies was estimated as 99.6 gha. This study is a step towards the sustainability of industrial food products.
Abbreviations: EF: Ecological footprint; GRSPV: Grid-connected rooftop photovoltaic; C&D: Construction and demolition; RRH: Rooftop rainwater harvesting; LCEF: Life-cycle ecological footprint; GDP: Gross domestic product; gha: Global hectare; ei: Equivalence factor; LCA: Life cycle analysis; EFfood product: Ecological footprint of food products; EFe: Ecological footprint of energy consumption; EFw: Ecological footprint of water consumption; EFt: Ecological footprint of transportation; EFwe: Ecological footprint of C&D waste disposal; EFm: Ecological footprint of manpower; EFdirect: Ecological footprint of direct land consumption; GHG: Greenhouse gas; LPG: Liquefied petroleum gas; EFme: Ecological footprint of material consumption; HDV: Heavy duty vehicle.
1. Introduction
In India, the industrial sector accounts for approximately 36.5% (382.7 TWh) of the total electricity consumption (MPCEA Citation2018), 1.77 Mt of LPG consumption, while the total global biomass consumed in the industry was estimated to be about 7.7 exajoules (EJ) in the year 2015(IEA, Citation2017).Food production significantly contributes to the consumption of energy, materials, and natural resources as well as leaves a remarkable environmental imprint on the planet. The food processing industry is estimated to be around USD 180 billion and contributes about 1.3–1.5% to India’s GDP. Processing and preserving of fruits and vegetables in India engages 58,331 people in 1101 factories (MOFPI, Citation2017).
A well-developed food processing sector with a higher level of processing helps in the reduction of wastage, improves value addition, promotes crop diversification, ensures a better return to the farmers, promotes employment as well as increases export earnings. On a global scale, 1.3 × 10⁹ ton of food, is wasted annually, which amounts to approximately a third of the food produced for humans (Girotto, Alibardi, and Cossu Citation2015). Fruit juice facilities often produce peels, seeds, and other organic matter as waste (Qu et al. Citation2009; John, Muthukumar, and Arunagiri Citation2017). Nowadays, food-waste handling is a major challenge; in general food waste is disposed of as landfills, which is not a sustainable solution for waste handling (USEPA, Citation2016; Babbitt CW, Citation2017). RedCorn, Fatemi, and Engelberth (Citation2018) reported that industrial food waste has the potential to reduce approximately 1.9 × 10⁸ ton of CO2eq emissions if it is converted to a higher value product (RedCorn, Fatemi, and Engelberth Citation2018). Opatokun et al. (Citation2017) evaluated that the industrial anaerobic digestion, pyrolysis and integration of anaerobic digestion and pyrolysis processes may produce 0.369 kWh, 0.020 kWh and 0.365 kWh of heat per kg of food waste, respectively. Jin et al. (Citation2015) reported that food waste may be responsible for 96.97 kgCO2-eq emissions per ton if it is disposed of as a landfill. However, if it is utilised for biogas generation, then it may generate 2630 MJ of energy per ton of waste.
Some researchers have previously reported the environmental impact of various food products. Wiedemann, McGahan, and Murphy (Citation2017) reported that the total greenhouse gas emissions for 1 kg of the boneless chicken portion was estimated to be 4.78 kg CO2-eq and 3.9 kg CO2-eq, for two regions Queensland and South Australia, respectively. For organic, conventional and integrated apple production systems, the ecological footprint was 0.08 gha/ton, 0.34 gha/ton and 0.25 gha/ton, respectively (Limnios et al. Citation2009). Ghasempour and Ahmadi (Citation2016) reported that 1 kg of egg production was responsible for 4.09 kg CO2-eq for the Alborz province in Iran. The ecological footprint of biscuit production in the city of York is about 3.3 gha/ton (Barrett et al. Citation2002). Świąder et al. (Citation2018) have reported that the Ecological Footprint of food exceeded the biocapacity of the city of Wrocław, Poland by 10 times. Therefore, the environmental impact of food production should be reduced so that human activities pertaining to food consumption don’t exceed the carrying capacity of the planet.
Various techniques may be utilised to reduce the environmental impacts of the products manufactured in the industry. Various researchers have reported that the utilisation of renewable systems. Roof-top solar PV systems are applied in industrial complexes that help to address energy sustainability issues. In India, most of the industries meet their electricity demand through the grid. If industries use solar PV systems, it has potential to significantly reduce the environmental impact of the product because PV on an average reduces the emission up-to 0.7 kg CO2 per kWh electricity generated (Herzog Citation1999).
Omar and Mahmoud (Citation2018) have studied the technical performance and economic feasibility of grid-connected rooftop solar PV systems in Palestine and have reported that the system has a payback of 4.9 years and an annual yield of 1756 kWh/kWp. Ali, Shafiullah, and Urmee (Citation2018) have explored the possibility of installing a roof-mounted solar PV system in Maldives and have found out that there is potential for generating 4.8 GWh to 8.0 GWh of electricity from rooftop PV systems in a year. Brunklaus et al. (Citation2018) have performed an LCA study of converting food waste in Sweden into biogas by volarization techniques. Giacchetta, Leporini, and Marchetti (Citation2014) performed the technical and economic analysis of different cogeneration systems based on biogas and they have reported that the thermal energy sale price was about 0.025 €/kWht. Florkowskia, Usb, and Klepacka (Citation2018) have studied the conversion of food waste to biogas in Poland. Müller, Brandmayr, and Zörner (Citation2014) have developed and evaluated a methodology for the potential of solar-thermal energy use in the food industry and they reported that 6.4% of the thermal energy demands of dairies can be met through solar thermal systems. Ghimire et al. (Citation2017) have done the LCA of a commercial rainwater harvesting system and have also compared it to the Municipal water supply system. They have found out that the rainwater harvesting system is superior to the municipal water supply system in many respects. Lee et al. (Citation2016) have proposed rainwater harvesting system to mitigate water crisis in Malaysia.
The Ecological Footprint (EF) concept was developed in the mid-nineties by Mathis Wackernagel and William Rees (Wackernagel and Rees Citation1996). The indicator incorporates all inputs (resources) and converts them into a single parameter called ‘global hectare (gha)’. One global hectare (gha) is equivalent to 1 ha of bio-productive land with world average productivity (Bastianoni et al. Citation2006). The expression for evaluating EF (in gha) is as follows (GFN, Citation2010):
where, Ci is annual consumption of item i (kg/yr), Yi is annual productivity of item i (kg/ha), ei represents the equivalence factor of different land types (such as cropland, pastureland, forestland, marine land, etc.) and its values are depicted in . Carbon sequestration due to human activities (such as fossil fuel burning, emissions during material production, transportation, etc.) can be expressed as follows (GFN Citation2010):
Table 1. Equivalence factor (GFN Citation2016)
where, PC is annual CO2 emissions, Aoc is the fraction of annual oceanic anthropogenic CO2 sequestration and Af is the annual rate of carbon uptake per hectare of forestland at world average yield (GFN Citation2010).
According to Global Footprint Network, the total Ecological Footprint and per capita Ecological Footprint of India is 1.36 billion gha and 1.1 gha/person, respectively; while the bio-capacity deficit of the country is 0.7 gha/person (GFN Citation2017). Indian resource demands have already surpassed the available bio-capacity of the country.
In this paper, the EF of four different manufactured food products of a food processing industry (Merry Foods) located at Allahabad (UP), India has been assessed. Simultaneously, various measures such as Grid-connected rooftop solar PV system, biogas plant and rainwater harvesting system have been suggested to reduce the EF of all the products. The Life-Cycle Ecological Footprint (LCEF) of suggested sustainable systems has also been calculated to find out the net EF reduction. This study will be helpful for estimating the environmental impact of Indian food processing industries and providing an approach towards sustainable food processing in India by reducing its EF.
1.1. Aim and scope
The environmental impact of various food products should be assessed and various steps should be adopted for their possible impact reductions through the installation of sustainable systems. The ecological footprint of the food product should be mentioned on the packaging of the product; because it incorporates all the resource consumption that has a direct or indirect involvement for the manufacturing of the food product. It will facilitate the consumer to select a product amongst a large number of similar products. Also, it may act as a reference for policymakers to link the environmental impact of the industry with their taxation and loans.
This type of environmental labelling on the food packaging will act as an encouragement to the manufacturers to reduce their environmental impacts, which can be helpful to reduce the global industrial ecological footprint.
2. Methodology
A methodology has been proposed for assessing and reducing the ecological footprint of a food product being manufactured in a food processing industry. The detailed steps of the proposed methodology are as follows:
2.1. Ecological footprint of a food product (EFfood product)
The industrial ecology considers the production of finished goods, distribution, and consumption of resources and services including the utilisation of direct energy and waste disposal, etc. In order to evaluate EFfood product, all the resources related to a production system are converted into their equivalent bio productive land that is needed to produce or absorb their impacts in the form of land categories (such as CO2 land, forestland, cropland, built-up land, etc.). The system boundary of the food processing industry is shown in . All the resources consumed during the manufacturing of the final products, steps involved in the processing of the food products, waste generation and corresponding transportation are depicted in . All the factors influencing the EFfood product and involvement of different types of bio-productive land are shown in . The estimation of EFfood product is given by the EquationEquation (1)(1)
(1) :
Figure 1. The production process of the food industry
Figure 2. Ecological footprint of the final product
Here, EFe, EFme, EFwe, EFt, EFw, EFm and EFbuilt-up represent the Ecological Footprint of product’s energy consumption, material consumption, waste generation, transportation, water consumption, manpower, and direct land consumption of the final product, respectively, which cumulatively assesses the EF of a food product. All the above parameters have been further discussed below:
2.1.1. Ecological footprint of energy consumption (EFe)
The EFe has been determined by the direct energy-related emission during the manufacturing of a food product. The EFe of a food product is calculated by using EquationEquation (2)(2)
(2) :
where Cei is direct energy consumption during the manufacturing process of the food product; λi is the corresponding emission factor of ith fuel (i.e. diesel, LPG, electricity); Aoc (i.e. 0.3) represents percentage of CO2 absorption in oceans (SIO Citation2017), Af (i.e. 2.68 tCO2/ha) is CO2 absorption factor of forests (Mancini et al. Citation2016). The termland is the equivalence factor of CO2 absorption land listed in .
2.1.2. Ecological footprint of materials (EFme)
where, Cmi is the consumption of the ith natural raw material during the processing of the food product; is the productivity of ith natural raw material; ‘a’ is waste factor of raw material; Pmj is the jth manufactured product consumed during food processing; λj is corresponding embodied emission factor of jth material;
2.1.3. Ecological footprint of transportation (EFt)
The EFt depends on three parameters: first, materials transportation from the cultivation site to the industrial location; second, manpower transportation from their houses to the industrial location; and third, waste disposal from the industry to landfill area/recycling plant. The data for the estimation of the EFt based on survey and response to questionnaires are as follows:
Materials and wastes are transported through Heavy Duty Vehicles (HDV).
Labourers use diesel-fuelled buses to reach the site of the industry from their houses.
The average distance travelled by labourers is 5–10 km while materials and wastes are transported to a distance of 10–15 km.
Estimation of the EFt of material, manpower and wastes is done by EquationEquation (4)(4)
(4) :
where, Cmi and Dmi are consumption and the average distance of transportation of ith material, respectively. Cwj and Dwj are waste generation and the average distance travelled by the jth material, respectively. Mk and Dmk are the numbers of labourers and the average distance travelled by them, respectively. Tc and Tb represent the capacity of truck (3.5 ton) and bus (50 passenger), respectively; and λdiesel emission factor of diesel fuel (3.17 CO2 kg/kg of diesel (EEA Citation2013). The average fuel efficiency of HDT (EHDV) and Bus (Ebus) are 0.222 and 0.238 kg of fuel/km, respectively (Baidya and Borken-Kleefeld Citation2009).
2.1.4. Ecological footprint of labour/manpower (EFm)
The EFm is associated with food consumption of labour/manpower because the impact of their mobility/transportation is already included in Section 2.1.3. During work-hours (10 h) nearly 1500 kcal is consumed at the rate of 155.3 kcal/hr (Rocamora, Solís-Guzmán, and Marrero Citation2017). This is nearly 65% of the daily metabolic calories burned (2400 kcal/day (NIN Citation2011)) by a labour. The daily diet of labourers is variable and it has not been calculated precisely. Therefore, the National Sample Survey Office (NSSO Citation2014) report is used to calculate the food consumption of manpower/labourers in India. The annual EF per person for food consumption in India is depicted in . The per capita annual EF of the total number of labour involved during the manufacturing process of the food products have been obtained by industry survey. The EFm is determined by EquationEquation (5)(5)
(5) :
Table 2. Main raw materials for food preparation per capita in India
where, N is the number of labours involved in food processing, dw is total number of days per year during which the industry is processing the food product; fd is daily food intake fraction of an Indian adult (65%); Cfi is food consumption category j (kg/person); and Yfi is food production yield of ith material (kg/ha). Cfuelj is fuel consumption category j for meal preparation (kg/person), λfuelj is an emission factor of category j fuel.
2.1.5. The ecological footprint of material waste (EFwe)
The material waste generally results in landfill disposal and transportation of the waste materials, while its transportation is included in the Section 2.1.3. However, recycling/reuse of waste materials may reduce ecological impact. The EFwe is determined by EquationEquation (6)(6)
(6) :
where, Cwi represents the amount of waste generated during manufacturing process of the food product (m3), R represents the fraction of waste that is directly reusable and R’ represents the fraction of waste that can be recycled, Ywi represents the assimilation rate of waste disposal and elandfill represents the equivalence factor of the type of bio-productive land for the waste to be disposed (0.43 gha/ha pasture land (GFN Citation2016)).
2.1.6. The ecological footprint of water consumption (EFw)
The EFw depends on water consumption during the manufacturing process of a food product. In India, groundwater is generally used in industries; therefore, CO2 absorption land is needed to compensate for the energy for uplifting water from underground to overhead tanks. The EFw of water consumption is determined by EquationEquation (7)(7)
(7) :
where, Cw is total water consumption during the manufacturing process (m3); Ew is energy consumption to extract groundwater (kWh/m3); and λfuel is emission factor of fuel used for groundwater extraction.
2.1.7. The ecological footprint of direct/physical land (EFdirect land)
This section focuses on the direct/physical land occupied by the food processing industry that is involved for the manufacturing of food products. The EFdirect land of a food product is determined by EquationEquation (8)(8)
(8) :
where, A is the area of occupied land for manufacturing of food products within an industry (ha) and edirect land is the equivalence factor of direct/physical land.
2.2 EF reduction measures
Energy and water both are essential for a food industry. Renewable energy systems are a clean power source; however, they consume some energy (associated with materials, transportation, etc.) and therefore are responsible for a small amount of GHG emissions. Therefore, EF analysis of such type of systems should also be included while assessing the overall EF of the food products. The methodology of detailed EF assessment of selected sustainable systems has been given below:
2.2.1. Grid connected roof-top solar PV (GRSPV) system
Various research studies on LCA of different types of solar photovoltaic (SPV) module systems suggest its potential to reduce environmental impact (Prakash and Bansal Citation1995; Cucchiella, D’Adamo, and Koh Citation2015). RETScreen Software has been used to simulate the capacity of the GRSPV system for the available rooftop of Merry Foods. In this study, multi-Si based PV module has been suggested because other modules have some constraints (such as material, high degradation rate and hazardous waste disposal (i.e. Cd) of the thin film (CIS, a-Si and CdTe) based solar PV systems, as well as, multi-Si PV systems have the largest market share (51%) due to their competitive cost (IRENA Citation2016). Details of the suggested GRSPV systems have been discussed in Section 4.2.1.
2.2.2. Biogas plant
Biogas, being carbon neutral, is a more sustainable energy source that can be used in place of fossil fuel-based energy source (Cecchi and Cavinato Citation2015). One kg of biogas is capable of replacing 0.25 kg of LPG (Agrahari and Tiwari Citation2013). Ogur and Mbatia (Citation2013) have provided technical details of the biogas plant (digester capacity of 4.8 m3) which provides sufficient biogas to completely meet the heating demands of Merry Foods. Details of the suggested biogas plant have been discussed in Section 4.2.2.
2.3. Roof-top rainwater harvesting (RRH) system
In India, food industries mainly utilise groundwater for processing activities, this can cause the groundwater level to deplete. According to Roof top Rain Water Harvesting 2016 report, rooftop rainwater harvesting system may provide approximately 1.4 m3 water per m2 of catchment area in India (Kalimuthu Citation2016). The water demand of the Indian industrial sector (approx. 35% groundwater consumed by industries) is gradually increasing and it will reach two digits during the next three decades (FICCI Citation2011). Rainwater harvesting can fulfil the industrial water needs and simultaneously increase the groundwater table. For the suggested RRH system at Merry Foods, technical assistance has been taken from RRWH (Citation2016) report. Details of the suggested RRH has been discussed in Section 4.2.3.
3. Case study
Merry Foods, a food processing industry located at Allahabad, India has been selected for our study. It manufactures four types of food products (Pickles, Jams, Honey and Chutney) in blister packs. The detailed information about Merry Foods has been mentioned in .
Table 3. Details about Merry Foods industry
4. Results
4.1. The ecological footprint of the food processing industry
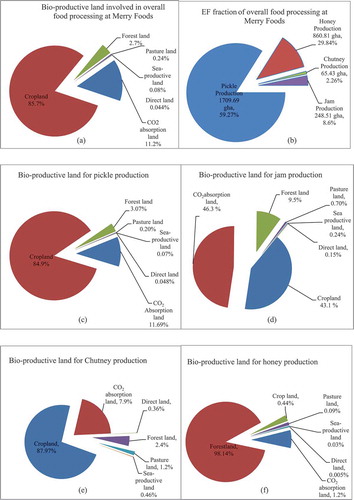
The annual ecological footprint of the four products manufactured at Merry Foods has been estimated to be 2884.44gha. The overall bio-productive land (cropland – 85.7%, CO2 absorption land – 11.2%, forestland – 2.7%, pastureland – 0.23%, Sea productive land – 0.08%, direct land – 0.044%) involvement is depicted in ). The input parameters have been considered individually to estimate the total Ecological Footprint of the food products being manufactured.
Figure 3. (a) Bio-productive land involved in overall food processing at Merry Foods, (b) EF fraction of overall food processing at Merry Foods, (c) Bio productive land for pickle production, (d) Bio productive land for jam production, (e) Bio productive land for chutney production, (f) Bio productive land for honey production
The impact of the different input parameters (such as energy consumption, material and natural resource consumption, manpower, transportation and waste generation) which influence the EF of the food products has been individually calculated and discussed below:
4.1.1 Ecological footprint of energy consumption (EFe)
The grid electricity and LPG consumption in the industry have been obtained by industry survey and data collection and mentioned in . The EFe for pickle, jam, honey and chutney production are 78.59 gha, 43.96 gha, 4.16 gha and 2.31 gha, respectively. The combined EFe is 129 gha, which is about 4.5% of the total Ecological Footprint of the food products being manufactured at Merry Foods.
4.1.2. Ecological footprint of material consumption (EFme)
The annual raw material consumed in the industry has been obtained by industry survey and data collection and it is mentioned in . The EFme for pickle, jam, honey and chutney production are 1590.2 gha, 185.04 gha, 850.16 gha and 57.08 gha, respectively. The combined EFme is 2682.5 gha, which is about 93% of the total Ecological Footprint of all four food products. Therefore, the material consumption is the major contributor to the EF of the food products being processed at Merry Foods.
Table 4. Details of material and resource consumption in the industry
4.1.3. Ecological footprint of transportation (EFt)
The EFt for pickle, jam, honey and chutney production are 17.6 gha, 7.93 gha, 0.93 gha and 0.52 gha, respectively. This is about 0.9% of the total Ecological Footprint of the food products being manufactured at Merry Foods.
4.1.4. Ecological footprint of labour/manpower (EFm)
The EFm for pickle, jam, honey and chutney production are 21.94 gha, 10.97 gha, 5.49 gha and 5.49 gha, respectively. This is about 1.5% of the total Ecological Footprint of the food products being manufactured at Merry Foods.
4.1.5. Ecological footprint of waste generation (EFwe)
The annual waste generation of the industry has been obtained by survey and data collection and is found out to be 237.5 ton. The EFwe for pickle, jam, honey and chutney production are 0.303 gha, 0.14 gha, 0.02 gha and 0.01 gha, respectively. This is about 0.016% of the total Ecological Footprint of the food products being manufactured at Merry Foods.
4.1.6. Ecological footprint of water (EFw)
The EFw for pickle, jam, honey and chutney production are 0.19 gha, 0.09 gha, 0.01 gha and 0.006 gha, respectively. The combined EFw calculated is about 0.3 gha, which is 0.01% of the total EF of the food products being manufactured at Merry Foods.
4.1.7. Ecological footprint of direct land (EFdirect land)
The EFdirect land for pickle, jam, honey and chutney production are 0.82 gha, 0.37 gha, 0.04 gha and 0.02 gha, respectively. The combined EFdirect land calculated is about 1.26 gha, which is 0.04% of the total EF of the food products being manufactured at Merry Foods.
4.1.8. Distribution of the components of EFfood product
The contribution of pickle, jam, honey and chutney production is 59.27%, 8.61%, 29.84% and 2.26%, respectively, of the total EF of the food products ()). The contribution of all bio-productive land types for the four food products manufactured at Merry Foods is depicted in ). The significant land types involved in the EFfood product are cropland and CO2 absorption land (i.e. 85.7% and 11.2% of the total bio-productive land, respectively). The ecological footprint of pickle, jam, honey and chutney finished products are 1.67, 0.54, 15.94 and 2.18 gha per ton, respectively. The contribution of all bio-productive land types for different food products (Pickles, Jams, Honey and Chutney) are depicted in .
Table 5. Ecological footprint for pickle production
Table 6. Ecological footprint for jam production
Table 7. Ecological footprint for honey production
Table 8. Ecological footprint for chutney production
In this study, the analysis of the environmental impact of the packaging has also been performed, and it is estimated to be about 1.4 gha per ton of final food product (i.e. 7.6% of the total EF of the food products).
4.2 Ecological footprint reduction measures
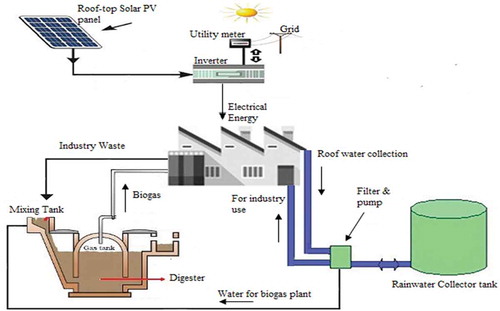
The proposed systems for the Merry Foods Industry are depicted in the .If all the suggested measures are installed in Merry Foods, it may reduce the total EF of the food products by about 99.6 gha (i.e. about 3.5% of the total EF of the four food products being manufactured at Merry Foods).
Figure 4. Proposed sustainable systems for the industry (Merry Foods)
4.2.1 Grid connected rooftop solar PV (GRSPV) system
As per the available roof area of the industry, the capacity of the proposed GRSPV system simulated by RETScreen software is 133 kWp. The detailed specification of the proposed GRSPV system has been mentioned in . The proposed GRSPV system may annually generate 238,010 kWh of electricity for the climatic condition of Allahabad. It can meet 77.78% of the total annual grid electricity demand of the industry with a payback period of 4.6 years. The LCEF of the proposed GRSPV system has been estimated to be 56.18 gha and annual average EF of the system is 2.8 gha (i.e.,20 year life cycle of the system). The average life cycle ecological footprint per m2 collector area of the solar PV system has been evaluated as 0.0694 gha/m2.
Table 9. Detailed specifications of 133 kW capacity GRSPV system
EF of grid electricity = 93.67 gha (i.e. about 78% of the total consumption)
EF of electricity generated by GRSPV = 2.8 gha
Total EF reduction = (93.67–2.8) gha = 90.87 gha
The proposed GRSPV system may reduce the annual ecological footprint of the food products by 3.2%.
4.2.2 Biogas plant
The proposed biogas plant capacity (4.8 m3) is based on the food waste (i.e. 80 kg/day, 11.5% of the total industrial food waste) which may annually generate7300 kg of biogas. (Ogur and Mbatia Citation2013).The detailed specification of the proposed biogas system has been mentioned in . The proposed biogas plant may completely meet the annual LPG requirement of the industry. The life-cycle EF of the proposed biogas plant has been estimated to be 1.33 gha and annual average EF of the system is 0.066 gha (20-year lifespan of the system).The total installation cost of the proposed biogas plant is about Rs. 120,000 with a three month payback period. The environmental impact of waste transportation and landfill may also reduce because 11.5% of the total food waste will be utilised in the proposed biogas plant.
Table 10. Biogas plant specifications
EF saving due to LPG replacement = 8.6 gha
EF saving due to waste utilisation = 11.5% of 0.464 gha = 0.053 gha
EF saving due to reduced waste transportation = 11.5% of 0.007 gha = 0.0008 gha
EF due to construction of biogas plant = 0.06 gha
Total EF reduction = (8.6+0.053+0.0008–0.06) gha = 8.59 gha
The proposed Biogas system may reduce the annual ecological footprint of the food products by 0.3%.
4.2.3 Roof-top rainwater harvesting (RRH) system
The proposed RRH system capacity (250 m3) is based on the annual water requirement of the industry and the annual rainfall received at Allahabad city. The proposed RRH system may also recharge the groundwater level.
The EF of the RRH system has been estimated to be 2.92 gha and annual average EF of the system is 0.146 gha (i.e.20 year life cycle of the system). The detailed specification of a rainwater harvesting system has been mentioned in .
Table 11. Rainwater harvesting system specifications
EF saving due to reducing water pumping = 0.29 gha
EF of RRH system = 0.146 gha
EF saving through RRH system = (0.29–0.146) gha= 0.144 gha (nearly half of the EFw of the food products)
5. Conclusions
The environmental assessment of the food industry in India was performed because it is responsible for GHG emissions, waste generation and various types of resource consumption. In this study, the EF of the different food products manufactured in the Merry Foods was determined (i.e. 2884.44 gha for the year of 2017). The ecological footprint of pickle, jam, honey and chutney finished products are 1.67, 0.54, 15.94 and 2.18 gha per ton, respectively. The bio-productive land that had the maximum involvement for the food processing was found to be cropland (85.7%) followed by CO2 absorption land (11.2%). The environmental impact of the packaging was estimated to be about 0.14 gha per ton of final food product.
This study also presents the net EF reduction that is feasible through the installation of sustainable technologies at Merry Foods; while also considering the EF of the sustainable systems as proposed. The suggested sustainable systems have the potential to significantly (3.5%) reduce the overall ecological footprint of the four food products manufactured at Merry Foods. The life cycle Ecological Footprint (LCEF) of 133 kW capacity grid connected rooftop solar PV (GRSPV) system has been estimated as 0.422 gha/kWp while the EF of life-cycle electricity generation from SPV is about 2 x 10⁻⁵gha/kWh. The suggested biogas plant (digester capacity of 4.8 m3 with EF of the system as 1.33 gha) has the potential to reduce EF by 8.59 gha annually. Finally, the proposed rainwater harvesting system (300 m3 tank capacity with EF 2.92 gha) has the potential to completely meet all the water needs of the industry. Rather, the excess rainwater collected may replenish the groundwater table. If all the suggested measures are installed at Merry Foods, it may reduce the total EF of the food products by about 99.6 gha (i.e. about 3.5% of the total EF of the four food products being manufactured at Merry Foods).
In this study, the impact of the machinery used for food processing has not been incorporated, while environmental impact of the building has also not been assessed. So, the overall industrial ecological footprint could not be computed through this assessment. In the future studies, other sustainable systems, EF of the overall industry, and potential reduction through improved manufacturing techniques may also be examined.
The food processing industry is a land-intensive sector and therefore, the current study has examined the feasibility of reducing bio-productive land required in this sector through sustainable systems. In view of the projected growth in the food processing sector with rising population globally, this study is of considerable significance for various stakeholders. It is further suggested that EF labelling may be done on the packaging of food products, which can make the consumers and the manufacturers aware of the sustainability of their food products.
Disclosure statement
No potential conflict of interest was reported by the authors.
Additional information
Notes on contributors
Dilawar Husain
Dilawar Husain is currently pursuing doctoral programme in the Department of Mechanical Engineering at the Motilal Nehru National Institute of Technology, Allahabad (UP), India. His academic interests include life cycle analysis, renewable system technologies and sustainability.
Pulkit Garg
Pulkit Garg is an undergraduate student of Food Technology and Management at National Institute of Technology Entrepreneurship and Management, India. His academic interest lie in the domain of agricultural sustainability and climate change.
Ravi Prakash
Dr Ravi Prakash is currently working as a Professor in the Department of Mechanical Engineering at the Motilal Nehru National Institute of Technology, Allahabad (UP), India. His academic interests include energy management, life cycle energy analysis, and sustainability. He is a Fellow of the Institution of Engineers (India) and a member of the International Solar Energy Society.
References
- Agrahari, R.P., and G.N. Tiwari. 2013. “The Production Of Biogas Using Kitchen Waste”, International Journal Of Energy Science; 3: 12-06.
- Ali, I., G. M. Shafiullah, and T. Urmee. 2018. “A Preliminary Feasibility of Roof-mounted Solar PV Systems in the Maldives.” Renewable and Sustainable Energy Reviews 83: 18–32. doi:10.1016/j.rser.2017.10.019.
- Babbitt, C. W. 2017. “Foundations of Sustainable Food Waste Solutions: Innovation, Evaluation, and Standardization.” Clean Technologies and Environmental Policy 19 (5): 1255–1256. doi:10.1007/s10098-017-1364-7.
- Baidya, S., and J. Borken-Kleefeld. 2009. “Atmospheric Emissions from Road Transportation in India.” Energy Policy 37: 3812–3822. doi:10.1016/j.enpol.2009.07.010.
- Barrett, J., H. Vallack, A. Jones, and G. Haq. 2002. A Material Flow Analysis and Ecological Footprint of York. Stockholm Environment Institute (SEI). Accessed July 2018. https://metabolismofcities.org/publication/148
- Bastianoni, S., A. Galli, V. Niccolucci, and R. M. Pulselli. 2006. The Ecological Footprint of Building Construction. UK: WIT press. ISSN 1743-3541. doi:10.2495/SC060331.
- Biomass Energy Centre (BEC). 2017. Accessed April 2017. http://www.biomassenergycentre.org.uk/portal/page?_pageid=75,163182&_dad=portal&_schema=PORTAL;
- Brunklaus, B., E. Rex, E. Carlsson, and J. Berlin. 2018. “The Future of Swedish Food Waste: An Environmental Assessment of Existing and Prospective Valorization Techniques”.” Journal of Cleaner Production 202: 1–10. doi:10.1016/j.jclepro.2018.07.240.
- Cecchi, F., and C. Cavinato. 2015. “Anaerobic Digestion of Bio-Waste: A Mini-Review Focusing on Territorial and Environmental Aspects.” Waste Management & Research 33: 429–438. doi:10.1177/0734242X14568610.
- Chambers, N., Simmons C., Wackernagel, M. 2004. “Sharing Nature’s Interest: Ecological Footprints as an Indicator of Sustainability”. Sterling Earthscan, London, Great Britain. ISBN-13: 978-1853837395
- Cucchiella, F., I. D’Adamo, and S. C. L. Koh. 2015. “Environmental and Economic Analysis of Building Integrated Photovoltaic Systems in Italian Regions.” Journal of Cleaner Production 98: 241–252. doi:10.1016/j.jclepro.2013.10.043.
- De-Miguel, S., T. Pukkala, and A. Yeşil. 2013. “Integrating Pine Honeydew Honey Production into Forest Management Optimization.” European Journal of Forest Research 133 (3): 423–432. doi:10.1007/s10342-013-0774-2.
- Economic Rate of Return for various Renewable Energy Technologies (ERRRET) report. 2017. “Ministry of New and Renewable Energy, Government of India.” Accessed November 2018. https://mnre.gov.in/file-manager/UserFiles/Draft-Report-Study-on-ERR-for-RETs.pdf
- European Environment Agency (EEA). 2013 “EMEP/EEA Air Pollutant Emission Inventory Guidebook – 2013”. http://www.eea.europa.eu/publications/emep-eea-guidebook-2013
- Federation of Indian Chambers of Commerce and Industry(FICCI). 2011. “Water Use in Indian Industry Survey.” Accessed September 2018. http://ficci.in/Sedocument/20188/Water-Use-Indian-Industry-survey_results.pdf
- Florkowskia, W. J., A. Usb, and A. M. Klepacka. 2018. “Food Waste in Rural Households Support for Local Biogas Production in LubelskieVoivodship (poland).” Resources, Conservation & Recycling 136: 46–52. doi:10.1016/j.resconrec.2018.03.022.
- Forest Survey of India (FSI), Ministry of Environment, Forest & Climate Change. “India State of Forest Report 2015” Accessed September 2017. http://fsi.nic.in/details.php?pgID=sb_62
- Ghasempour, A., and E. Ahmadi. 2016. “Assessment of Environment Impacts of Egg Production Chain Using Life Cycle Assessment.” Journal of Environmental Management 183: 980–987. doi:10.1016/j.jenvman.2016.09.054.
- Ghimire, S. R., J. M. Johnston, W. W. Ingwersen, and S. Sojka. 2017. “Life Cycle Assessment of a Commercial Rainwater Harvesting System Compared with a Municipal Water Supply System.” Journal of Cleaner Production 151: 74–86. doi:10.1016/j.jclepro.2017.02.025.
- Giacchetta, G., M. Leporini, and B. Marchetti. 2014. “Technical and Economic Analysis of Different Cogeneration Systems for Energy Production from Biomass.” International Journal of Productivity and Quality Management, no. 3: 314–335. doi:10.1504/ijpqm.2014.060419.
- Girotto, F., L. Alibardi, and R. Cossu. 2015. “Food Waste Generation and Industrial Uses: A Review.” Waste Management 45: 32–41. doi:10.1016/j.wasman.2015.06.008.
- “Global Footprint Network (GFN) 2017): Ecological wealth of nations.” Accessed December 2017. http://www.footprintnetwork.org/content/documents/ecological_footprint_nations/ecological.html
- Global Footprint Network (GFN). 2010. “Calculation Methodology for the National Footprint Accounts, 2010 Edition.” Accessed 21 August 2018. http://www.footprintnetwork.org/content/images/uploads/National_Footprint_Accounts_Method_Paper_2010.pdf
- Guidebook to the National Footprint Accounts (GFN). 2016. https://www.footprintnetwork.org/content/documents/National_Footprint_Accounts_2016_Guidebook.pdf
- Herzog, H. 1999. “The Economics of CO2 Separation and Capture.” Proceedings of the second Dixy Lee Ray memorial symposium, Washington, D.C.
- Indian Horticulture Database (IHD). 2014. “Ministry of Agriculture.” Government of India. www.nhb.gov.in
- International Energy Agency (IEA). 2017. “Renewable Energy for Industry from Green Energy to Green Materials and Fuels.” https://www.iea.org/publications/insights/insightpublications/Renewable_Energy_for_Industry.pdf
- International Renewable Energy Agency (IRENA) and International Energy Agency (IEA). 2016. End-of-life management: solar photovoltaic panels
- Jin, Y., T. Chen, X. Chen, and Z. Yu. 2015. “Life-cycle Assessment of Energy Consumption and Environmental Impact of an Integrated Food Waste-based Biogas Plant.” Applied Energy 151: 227–236. doi:10.1016/j.apenergy.2015.04.058.
- John, I., K. Muthukumar, and A. Arunagiri. 2017. “A Review on the Potential of Citrus Waste for D-limonene, Pectin, and Bioethanol Production.” International Journal of Green Energy 14 (7): 599–612. doi:10.1080/15435075.2017.1307753.
- Jungbluth, N., M. Stucki, and R. Frischknecht 2009. “Photovoltaics.” (Part XII) esu-services.ch/fileadmin/download/06_XII_Photovoltaic-v2.2plus.pdf
- Kalimuthu, A. 2016. A Practical Guide on Roof Top Rain Water Harvesting (RRWH). First ed.
- Lee, K., M. Mokhtar, M. M. Hanafiah, A. Azhar Halim, and J. Badusah. 2016. “Rainwater Harvesting as an Alternative Water Resource in Malaysia: Potential, Policies and Development.” Journal of Cleaner Production 126: 218–222. doi:10.1016/j.jclepro.2016.03.060.
- Limnios, E. A. M., A. Ghadouani, S. G. M. Schilizzi, and T. Mazzarol. 2009. “Giving the Consumer the Choice: A Methodology for Product Ecological Footprint Calculation.” Ecological Economics 68: 2525–2534. doi:10.1016/j.ecolecon.2009.04.020.
- Mancini, M. S., A. Galli, V. Niccolucci, D. Lin, S. Bastianoni, M. Wackernagel, and N. Marchettini. 2016. “Ecological Footprint: Refining the Carbon Footprint calculation.Ecological.” Indicators 61 (2): 90–403.
- Ministry of Food Processing Industries, Government of India (MOFPI). 2017. “Annual Report.” Accessed September, 2018. www.mofpi.nic.in
- Ministry of New and Renewable Energy (MNRE). 2015. Accessed August 2017. https://mnre.gov.in/scheme-documents
- Ministry of Power Central Electricity Authority (MPCEA). “Government of India. (2016). CO2 Baseline Database for the Indian Power Sector, User Guide, 2016.” Accessed on December 2018. http://www.cea.nic.in/reports/others/thermal/tpece/cdm_co2/user_guide_ver11.pdf
- Müller, H., S. Brandmayr, and W. Zörner. 2014. “Development of an Evaluation Methodology for the Potential of Solar-thermal Energy Use in the Food Industry.” Energy Procedia 48: 1194–1201. doi:10.1016/j.egypro.2014.02.135.
- National Institute of Nutrition (NIN), Dietary Guidelines for Indians –A Manual. 2011. Accessed on March, 2018. http://ninindia.org/DietaryGuidelinesforNINwebsite.pdf
- National sample survey office (NSSO). 2014. “Household Consumption of Various Goods and Services in India 20ll-12, Ministry of Statistics and Programme Implementation.” Government of India. Accessed 22 November 2017. http://mospi.nic.in/sites/default/files/publication_reports/Report_no558_rou68_30june14.pdf
- Ogur, E. O., and S. Mbatia. 2013. “Conversion of Kitchen Waste into Biogas.” The International Journal Of Engineering And Science 2 (11): 70–76.
- Omar, M. A., and M. M. Mahmoud. 2018. “Grid Connected PV- Home Systems in Palestine: A Review on Technical Performance, Effects and Economic Feasibility.” Renewable and Sustainable Energy Reviews 82 (Part 3, February): 2490–24971. doi:10.1016/j.rser.2017.09.008.
- Opatokun, S. A., A. M. Lopez-Sabiron, G. Ferreira, and V. Strezov. 2017. “Life Cycle Analysis of Energy Production from FoodWaste through Anaerobic Digestion, Pyrolysis and Integrated Energy System.” Sustainability 9: 1804. doi:10.3390/su9101804.
- Open Government Data (OGD). 2017. “Government of India.” https://data.gov.in/node/94765/download
- Pacca, S., D. Sivaraman, and G. A. Keoleian. 2007. “Parameters Affecting the Life Cycle Performance of PV Technologies and Systems.” Energy Policy 35: 3316–3326. doi:10.1016/j.enpol.2006.10.003.
- Pacey, A., and A. Cullis. 1989. Rainwater Harvesting: The Collection of Rainfall and Runoff in Rural. London: Intermediate Technology Publications.
- Prakash, R., and N. K. Bansal. 1995. “Energy Analysis of Solar Photovoltaic Module Production in India.” Energy Sources 17: 605–613. doi:10.1080/00908319508946107.
- Praseeda, K. I., B. V. V. Reddy, and M. Mani. 2015. “Embodied Energy Assessment of Building Materials in India Using Process and Input–Output Analysis.” Energy and Buildings 86: 677–686. doi:10.1016/j.enbuild.2014.10.042.
- Qu, W., Z. Pan, R. Zhang, X. Chen, B. Zhu, Z. Wang et al. 2009. “Integrated Extraction and Anaerobic Digestion Process for Recovery of Nutraceuticals and Biogas from Pomegranate Marc.” Trans ASABE 52 (6): 1997–2006. doi:10.13031/2013.29196.
- RedCorn, R., S. Fatemi, and A. S. Engelberth. 2018. “Comparing End-Use Potential for Industrial Food-Waste Sources.” Engineering 4: 371–380. doi:10.1016/j.eng.2018.05.010.
- Rocamora, A. M., J. Solís-Guzmán, and M. Marrero. 2017. “Ecological Footprint of the Use and Maintenance Phase of Buildings: Maintenance Tasks and Final Results.” Energy and Buildings 155: 339–351. doi:10.1016/j.enbuild.2017.09.038.
- Scripps Institution of Oceanography (SIO).: TheKeeling Curve. 2017. Accessed 13 march 2107. https://scripps.ucsd.edu/programs/keelingcurve/2013/07/03/how-much-co2-can-the-oceans-take-up/
- Świąder, M., S. Szewrański, J. K. Kazak, J. Van Hoof, D. Lin, M. Wackernagel, and A. Alves. 2018. “Application of Ecological Footprint Accounting as A Part of an Integrated Assessment of Environmental Carrying Capacity: A Case Study of the Footprint of Food of A Large City.” Resources 7 (3): 52. doi:10.3390/resources7030052.
- US Environmental Protection Agency (USEPA). 2016. “Advancing Sustainable Materials Management: 2014 Fact Sheet. Assessing Trends in Material Generation, Recycling, Composting, Combustion with Energy Recovery and Landfilling in the United States. Washington, DC.” US Environmental Protection Agency
- Wackernagel, M., and W. Rees. 1996. “Our Ecological Footprint: Reducing Human Impact 0on the Earth.” New Society. Gabriola Island, British Columbia.
- Wiedemann, S. G., E. J. McGahan, and C. M. Murphy. 2017. “Resource Use and Environmental Impacts from Australian Chicken Meat Production.” Journal of Cleaner Production 140 (Part 2, January 1): 675–684. doi:10.1016/j.jclepro.2016.06.086.