
 ?Mathematical formulae have been encoded as MathML and are displayed in this HTML version using MathJax in order to improve their display. Uncheck the box to turn MathJax off. This feature requires Javascript. Click on a formula to zoom.
ABSTRACT
This study investigates the feasibility of applying coagulation/flocculation process for real textile wastewater treatment. Batch experiments were performed to detect the optimum performance of four different coagulants; Ferric Sulphate (Fe2(SO4)3), Aluminium Chloride (AlCl3), Aluminium Sulphate (Al2(SO4)3) and Ferric Chloride (FeCl3) at diverse ranges of pH (1–11) on the removal of chemical oxygen demand (COD), total suspended solids (TSS), colour, total nitrogen (TN) and turbidity from real textile wastewater. At pH 9, FeCl3 demonstrated the most effective removal for all studied contaminants. Experiments were conducted to assess the dosage and operating conditions to achieve optimum removal efficiency for all studied contaminants by using FeCl3. The obtained results demonstrated the higher ability of FeCl3 in textile wastewater treatment with optimum conditions; pH 9, 150 rpm in 1 min rapid mixing, 30 rpm in 20 min slow mixing and 30 min settling. Artificial neural network (ANN) model was applied to predict the removal efficiencies of the studied contaminants under different variables using FeCl3 coagulant. ANN model adequately predicted the studied parameters removal efficiencies with a coefficient of determination greater than 90% and has the capability of simulating the coagulation process and predicting removal percentages using the author’s experimental data.
1. Introduction
Water pollution is one of the main causes of public health deterioration. A proper strategy has to be applied to diminish water pollution and optimise the use of recycled water. The textile industry is one of the greatest substantial pollution sources. Moreover, it is very voracious to consume fresh water during its production processes (Ghaly et al. Citation2014). In general, textile wastewaters contain dissolved organic and inorganic ingredients, such as dyes, heavy metals, detergents, starch etc. It can be characterised by elevated chemical oxygen demand (COD), turbidity, temperature, pH and robust colour (Holkar et al. Citation2016; Yaseen and Scholz Citation2019). The colour of the discharged textile effluents is mainly owing to the use of dyes which primarily have complex aromatic molecular structure (Carmen and Daniela Citation2012). Dyes are usually organic and non-biodegradable. It mainly consists of a group of atoms called ‘Chromophore’ responsible for their colour in addition to donating substituent called ‘Auxochrome’ which improves the colour of chromophore (Dos Santos, Cervantes, and van Lier Citation2007; Ghanbari and Moradi Citation2016). The most common chromophores are carbonyl (–C = O), azo (–N = N–) and nitro (–NO2) groups. The dye molecules can be strongly fixed by forming covalent bonds that caused by chemical reactions between substitutes on the dye molecules and the fibres (Carmen and Daniela Citation2012). Dyes in water are frequently toxic and has a significant influence on causing carcinogenicity to the marine organisms and humans (Lellis et al. Citation2019). On the other side, marine’s life is significantly affected by the increase of organic and inorganic substances as well as suspended solids accompanying the discharged water. They can prevent natural light from penetrating the water which catalyse the occurrence of the eutrophication process (Lellis et al. Citation2019; Holkar et al. Citation2016). All of these detrimental characteristics donate to the primacy of textile wastewater treatment before discharging into the environment (Carmen and Daniela Citation2012). There are several effective methods applied for treating real textile wastewater such as, nanofiltration (Kurt et al. Citation2012; Riera-Torres, Gutiérrez-Bouzán, and Crespi Citation2010), ultrafiltration (Alventosa-deLara et al. Citation2012), electrochemical processes (Chatzisymeon et al. Citation2006), electrocoagulation (Merzouk et al. Citation2009), ozonation (Fatimah and Wiharto Citation2017), reverse osmosis (Kurt et al. Citation2012), adsorption (Karam, Zaher, and Mahmoud Citation2020), photocatalysis (Noman et al. Citation2020) and advanced oxidation processes (Patel and Vashi Citation2015). All of these methods are either difficult to operate or periodic maintenance (Ghaly et al. Citation2014). The conventional biological treatment is common used for textile wastewater treatment attributable to its great ability to remove dissolved matters from effluents (Yaseen and Scholz Citation2019; Elawwad, Karam, and Zaher Citation2017). Nevertheless, it is not a sufficiently effective method for removing colour due to the poor biodegradation of some types of dyes (Rai et al. Citation2005).
Coagulation/flocculation process is a frequently used technique for numerous years as a main treatment or pre-treatment stage in textile wastewater treatment plants. It has an excellent ability to discolour textile effluents and diminish the total load of suspended solids (Tan, Teng, and Omar Citation2000; Verma, Dash, and Bhunia Citation2012); regardless the amount of sludge produced due to the excess dose of the coagulant. The efficiency of this method depends on the characteristics of raw wastewater, especially pH, temperature, the type and the dosage of the used coagulant, as well as the intensity and duration of mixing (Verma, Dash, and Bhunia Citation2012). The addition of flocculation process is highly recommended to improve coagulation process effluents by enlarging the size of flocs and, consequently causing rapid settling (Teh et al. Citation2016). Nevertheless, the core disadvantage of applying coagulation/flocculation process for textile wastewater treatment is the enormous amounts of generated sludge which have a serious disposal problem (Dalvand et al. Citation2017; Verma, Dash, and Bhunia Citation2012). Therefore, determining the appropriate dose of coagulant is extremely important not to increase sedimentation sludge (Aboulhassan et al. Citation2006). In general, aluminium salts and ferric ions are the principally used coagulants for wastewater treatment owing to their massive ability to attain particulate destabilisation via charge neutralisation for the negatively charged particles (Ghafari et al. Citation2009). Several coagulants, such as Fe2(SO4)3, AlCl3, Al2(SO4)3 and FeCl3 have been evaluated for wastewater treatment (Verma, Dash, and Bhunia Citation2012; Teh et al. Citation2016). However, a considerable amount of studies have revealed the best performance of FeCl3 for the removal of dyes (Assadi et al. Citation2013), metals ions (Johnson et al. Citation2008), phosphorus (Zhou et al. Citation2008) as well as oil & grease (Chatoui, Lahsaini, and Aguelmous Citation2017) from wastewater. Moreover, FeCl3 showed a tremendous ability in dealing with hard wastewaters, such as pulp and paper wastewater (Jaafarzadeh, Ghanbari, and Alvandi Citation2017), dairy wastewater (Kurup, Adhikari, and Zisu Citation2019), petrochemical wastewater (Ribera-Pi et al. Citation2020) and landfill leachate (Moradi and Ghanbari Citation2014). On the other side, estimating and predicting future conditions have been reported to govern many critical engineering activities such as the forecast of the performance of wastewater treatment plants (Hassen and Asmare Citation2019). Future predictions can save time, resources, efforts, costs, and increase the chances of project success (Maier et al. Citation2010). Artificial neural networks (ANN) are currently employed in several areas of science and engineering and are considered as a promising tool due to their simplicity towards simulation, prediction – with a restricted range of experiments – and modelling (Willis et al. Citation1991). The applying of ANN to unravel environmental engineering issues has been reported in several articles and applied within the biological treatment of wastewater and the physical-chemical treatment of wastewater (Häck and Köhne Citation1996). In this research, batch coagulation studies were performed for obtaining the optimum pH values of different coagulants; Fe2(SO4)3, AlCl3, Al2(SO4)3 and FeCl3 for the removal of COD, TSS, colour, TN and turbidity from real textile effluents. In addition, investigating the feasibility of using FeCl3 coagulant under various operating conditions for real textile wastewater treatment. The application of ANN modelling was performed to predict the removal efficiencies of the tested contaminants under different variables using FeCl3 coagulant. The input layer of ANN receives records from the experimental work carried out by the authors. A comparison was conducted between the target and the network output (prediction) through calculating the mean squared error (MSE) and linear regression analysis.
2. Materials and methods
2.1. Chemicals
The used chemicals for this study were Fe2(SO4)3, AlCl3, Al2(SO4)3 and FeCl3.6H2O. They were supplied by (Aldrich Co.). All chemicals were of commercial grade and used without further purification. Ethyl alcohol (C2H6O, 95% pure, World Co.), Sodium hydroxide (NaOH) and Sulphuric acid (H2SO4), 95–97%, Honeywell Co.
2.2. Analytical analysis
The textile effluent samples were analysed for pH, COD, TSS, colour, TN and turbidity. The medium pH was measured using Multi metre PH/OXI 340 I (JERMANY/WTW 340i/05281018, Germany). The analysis of COD and TSS was conducted using spectrophotometer (HACH DR/2000) set at 620 nm and 810 nm wavelength, respectively. Turbidity was measured by turbidity metre (COLE PALMER-USA/08391.45/12,106,698). A spectrometer (HACH DR/2000 set at 455 nm wavelength) was used for colour detection by following the APHA Platinum-Cobalt Method (set at 455 nm wavelength) and distilled water was used as a blank.
2.3. Calculations
The percentage of removal efficiency for all studied contaminants was calculated using (Equationeq.1)(1)
(1) .
Where: Ci is the initial concentration (mg/L) and Ce is the equilibrium concentration (mg/L).
2.4. Samples collection
Composite textile wastewater samples of end-of-pipe effluent were collected from local textile mill located at El-Sadat City, Menoufia-Egypt. The samples were compiled per hour of work throughout the whole working day (8 hours) to give a representative picture of different pollutant concentrations throughout the day. After that, the samples were mixed and reserved in plastic containers then stored in refrigerator and transported to the laboratory for characterisation according to the standard methods for the Examination of Water and Wastewater (Federation Citation2005).
2.4.1. Characteristics of raw textile effluent
The raw textile samples were dark brown coloured, alkaline with pH ranged between 9 and 9.5. It also contain maximum concentrations of TSS (2230 mg/L), COD (3257 mg/L), turbidity (75 NTU), TN (35 mg/L) and colour (819 Pt-Co). The elevated concentration of colour was basically by reason of using several types of dyes in the dyeing and printing processes.
2.5. Batch studies
In this study, chemical coagulation/flocculation experiments were conducted at room temperature using batch studies. Four beakers were assembled in the Jar test apparatus; each containing 1000 mL of real textile wastewater. Measurements of COD, TSS, colour, TN, and turbidity of the initial textile wastewater sample were applied and taken as a reference to determine the removal efficiency of different coagulants at diverse pH values (1–11). Fe2(SO4)3,AlCl3, Al2(SO4)3 and FeCl3 were tested as chemical coagulants for optimal removal rates at 1 g/L dose to conduct the effect of each coagulant at pH 1, 3, 5, 7, 9 and 11. Sulphuric acid (H2SO4) and Sodium hydroxide (NaOH) were utilised to control the pH values during the study. After that, the Jar test experiment was performed in three steps for determining the optimum operating conditions of using FeCl3; the first is rapid mixing at 50, 100, 150, 200 and 250 rpm for 1, 2, 3, 4 and 5 min; aiming to achieve complete mixing of the coagulant to improve colloidal particles destabilisation. Second step is slow mixing at 10, 20, 30, 40 and 50 rpm for 10, 15, 20, 25 and 30 min with the aim of enhancing the contact between coagulating particles and facilitating the formation of large flocs. The third step is settling stage at 10, 20, 30, 40 and 50 min for settling optimisation of the formed flocs. Different dosages of FeCl3 were used (0.25, 0.5, 0.75, 1, 1.25 and 1.5 g/L) to determine the optimum FeCl3 coagulant dose. All of these conditions were optimised depending on the maximum removal rates of the studied constituents. All the results at different dosages and different operating conditions were recorded.
2.6. Artificial neural network (ANN)
Artificial Neural networks (ANN) are a widely used technology that established and verified for many complex predicting problems. In the coagulation process, there are many variables can influence the removal percentage, such as the effect of dose, rapid mixing speed, slow mixing speed, rapid mixing time, slow mixing time and settling time. The optimisation of these parameters may influence the process efficiency. FeCl3 at pH 9 was chosen as a coagulant for coagulation/flocculation because it demonstrated the most effective removal of COD, TSS, colour, TN and turbidity. The range of used variables in ANN is shown in .
Table 1. Range of variables in ANN
The framework of ANN involves input layer, one or more hidden layer, and output layer. Every layer of the network consists of variety of interconnected process components (neurons). Neurons interact with each other with the help of the weight. Each neuron is connected to all the neurons in the next layer. The data is given to the neural network within the input layer. The output of the neural network is conferred by output layer for the given input data. The complicated relations between input and output that computed by the networks are enabled by the hidden layers. The number of hidden layers is to be selected in respect of the complexity of the problem (Kundu, Debsarkar, and Mukherjee Citation2013; Zangooei, Delnavaz, and Asadollahfardi Citation2016). The architecture of ANN is shown in .
Figure 1. Architecture of ANN model
The training of neural network is performed by preparing a series of input data and target output values. The parameters affecting the output should be selected as input parameters (effect of dose, rapid mixing speed, slow mixing speed, rapid mixing time, slow mixing time and settling time). In the backpropagation training algorithm, each input is multiplied by its weight, then, sum the product and processing the sum using a nonlinear transfer function to produce results. The backpropagation is essentially a gradient descending method to minimise the network error function (Equationeq.2)(2)
(2) .
Where: ei (j) and ti (j) are estimated and targeted values, respectively. ‘n’ is the number of output nodes, and ‘k’ is the number of training samples. Weights shall be initially randomised before the beginning of ANN training. According to the error propagation, weights are adjusted based on (Equationeq.3)(3)
(3) .
Where: Wij (n) and Wij (n-1) are the weights increment between nodes I and j during the adjacent iteration and α and are learning rate and momentum factor (Kundu, Debsarkar, and Mukherjee Citation2013). The ANN model training was performed by preparing the complete input data set to the network and continued till reaching the minimum average MSE. The trained network is tested by preparing the set of test data and then comparing the network output with the target (actual) values. After that, several statistical parameters, such as coefficient of determination (R) and mean squared error (MSE) can be used to measure the ANN model performance. Value close to 1 and error should be least to get a well-trained model. One of the main reasons of not widely using advanced methods such as neural networks to improve predictions, is that such methods can be difficult to master. Microsoft Excel is a familiar software that provides an integrated tool for forecasting, but the accuracy of its results is considerably reduced in the presence of nonlinear relationships or missing data. However, ANN add-in programmes can solve these problems such as NeuroXL Predictor that can hide the complexity of its advanced neural network-based methods while useful predictions can be carried out via the familiar Excel interface in minimum learning time as add-in package. Therefore, it was used as it offers accurate and fast predictions as a complement to Microsoft Excel, taking the advantages of the latest advances in artificial intelligence and making a complex prediction of the neural network considering the nonlinear variables. Consequently, it is ideal for predicting dynamic systems and recognising the subtle relationships between variables. Synapses of every neuron were initialised with random values from 0 to 0.30, the learning rate value was 0.30, the value for momentum was 0.60, and Zero-based log sigmoid as activation (transfer) function was used. The difference between predicted and experimental values should be small as possible to have a well performance network. The network was tested to assess its general ability with the experimental output. Once the neural networks tested with success, they can be used for prediction. In order to measure the pollutant removal efficiency and the performance of the developed neural network model, MSE were used to estimate the error (Equationeq.4)
(4)
(4) .
Where: ‘N’ is number of data points; Ti is predicted value; Ai is experimental value.
3. Coagulation/flocculation study
3.1. Effect of pH
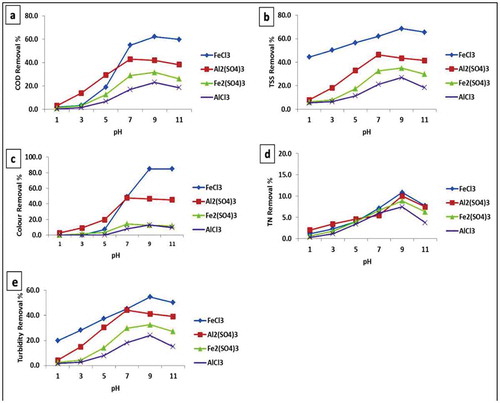
Batch experiments were carried out using Fe2(SO4)3, AlCl3, Al2(SO4)3 and FeCl3 coagulants individually to detect the impact of pH on COD, TSS, Colour, TN and turbidity reduction from real textile wastewater. shows the effect of pH which was observed on coagulation process. All trials were taken at different pH values 1, 3, 5, 7, 9 and 11 while the dosing rate of all coagulants was kept constant as 1 g/L. Coagulants were added and rapidly mixed for 1 min by a stirrer at 150 rpm and subsequently slowly mixed for 20 minutes at 30 rpm and sample was left over for 30 minutes settling. The supernatant was decanted off and its value for COD, TSS, colour, TN and turbidity was measured. ) represents the effect of pH on the performance of all studied coagulants for COD removal. At pH 5, Al2(SO4)3 and FeCl3 showed more COD reduction (29.3% and 18.9%) than the reduction achieved by using Fe2(SO4)3 and AlCl3 (12.6% and 6.7%). The optimum pH range for all studied coagulants was observed between 7 and 9 with better removals by using FeCl3. At pH 7, the COD removal efficiency for Fe2(SO4)3, AlCl3, Al2(SO4)3 and FeCl3 was enhanced to be 28.9%, 23%, 42.8% and 54.9%, respectively. The highest percentage of COD removal (62.2%) was achieved at pH 9 by using FeCl3. By increasing the pH from up to 11, the COD removal decreased for all studied coagulants.
) represents the effect of pH on the performance of all studied coagulants for TSS removal. The pH behaviour was similar as in COD reduction however, FeCl3 showed higher results at low pH values. At pH 7, Al2(SO4)3 and FeCl3 demonstrated more TSS reduction 46.4% and 62.1%, respectively, as shown in ). A maximum percentage of removal was observed 68.6% by using FeCl3 at pH 9. A dramatic decrease of the TSS removal rates was observed by increasing the pH from 9 to 11 for all studied coagulants. The variation in colour was also studied and presented in ). At pH ≤5 (acidic medium), there was a poor removal efficiency for all studied coagulants. However, the colour removal rates were significantly increased to 84.7% by using FeCl3 at pH 9 and 47.6% by using Al2(SO4)3 at pH 7. At pH ≥9, the colour removal efficiency was stable and high by using FeCl3 while showing a remarkable drop by using the other studied coagulants. The TN removal from real textile effluents was presented in ). It was observed that all TN removal results were not efficient enough and close to each other for all studied coagulants. At pH 9, the optimum TN removal was achieved and reached 10.9%, 8.9%, 7.4% and 10% after using FeCl3, Fe2(SO4)3, AlCl3 and Al2(SO4)3, respectively. At pH 11, there was a sudden drop in the TN removal results for all studied coagulants.
) shows the experimental data of the pH effect on the performance of Fe2(SO4)3, AlCl3, Al2(SO4)3 and FeCl3 for turbidity removal. At pH 5, the turbidity removal efficiency was 37.3%, 14.2%, 7.9% and 30.3% after using FeCl3, Fe2(SO4)3, AlCl3 and Al2(SO4)3, respectively. At pH 7, a significant increase was detected; 45.3%, 29.8%, 18% and 44.2% for FeCl3, Fe2(SO4)3, AlCl3 and Al2(SO4)3, respectively. A marked improvement was observed in the removal rates of turbidity reached to 54.7% after using FeCl3 at pH 9. While, a clear decrease in the turbidity removal efficiencies was noted for all studied coagulants for further pH values above 9. As a whole, the great performance of FeCl3 to contaminants removal could be attributed to the iron and chloride ions which neutralising the charged colloidal particles. Furthermore, the great contaminant particles adsorption ability of the formed ferric hydroxide resulted from the reactions between ferric ions and hydroxide ions in water. The removal rates of Al2(SO4)3 and FeCl3 for the reduction of COD, TSS and colour from real textile wastewater was also studied by (Naghan et al. Citation2015). The obtained results showed better removal rates of 72% for COD, 60% for TSS and 98% for colour by using FeCl3 rather than using Al2(SO4)3. Another researchers (Rana and Suresh Citation2017) compared the reduction of COD from real textile effluent by using diverse coagulants; FeCl3, FeSO4, Al2(SO4)3, Poly Aluminium Chloride (PAC), Tamarind seed powder, Chitosan and Xanthium gum. The results of the study showed 54% reduction of the COD rates at pH 4 and 4 g/L dose compared to the other studied coagulants. All observations revealed that treatment of textile effluents is highly reliant on the initial pH value of the effluent sample. At high pH values, contaminant particles retain net negative charges which enhance the performance of cationic coagulant to combine with particles (Naghan et al. Citation2015). Based on the obtained results, the optimum pH for FeCl3 was consistent with the actual pH of real textile effluents compared to other studied coagulants. Consequently, pH adjustment is not required in case of using FeCl3 and this positively affects the cost of the treatment process. In addition, the extensive use of Al2(SO4)3 has been linked to health risks (Verma, Dash, and Bhunia Citation2012). Therefore, FeCl3 was selected because of its high performance, availability, less toxicity and low cost compared to other studied coagulants (Jaafarzadeh, Ghanbari, and Alvandi Citation2017).
Figure 2. pH effect on all studied coagulants for the removal of a) COD, b) TSS, c) Colour, d) TN and e) Turbidity (dose 1 g/L, 150 rpm rapid stirring rate)
3.2. Operating conditions based on FeCl3 coagulant
3.2.1. Effect of dose
At optimum pH 9, the removal efficiency of COD, TSS, TN and colour related to different dosages of 0.25, 0.5, 0.75, 1, 1.25 and 1.5 g/L of FeCl3 coagulant was examined as shown in ). It was observed that as dosing quantity is increased the removal efficiency is enhanced for the COD, TSS, TN and turbidity and diminished for colour. At maximum dose of 1.5 g/L, the optimum removal efficiency of COD, TSS, TN and turbidity was achieved to be 72%, 73.4%, 18.3%, and 75.3%, respectively. However, at high coagulant doses greater than 1 g/L, the colour removal efficiency showed a significant drop from 84.7% at 1 g/L dose to 83% at 1.25 g/L dose and then to 79.5% at 1.5 g/L dose. It may be attributed to the increased oxidised iron content which provides a red colour in addition to the existing dyes colour in the water. The minimum effective dose for best COD, TSS, TN, turbidity and colour removal efficiency was detected to be 1 g/L.
3.2.2. Effect of rapid mixing
A series of tests were conducted with FeCl3 as coagulant to examine the effect of initial mixing on the removal performance of COD, TSS, TN, turbidity and colour. ) shows the effect of rapid mixing speed (50, 100, 150, 200 and 250 rpm) on the removal performance for FeCl3 dosage of 1 g/L. For the removal of COD, TSS, TN, turbidity and colour, a significant difference was seen at all mixing speeds with the optimum rapid mixing speed of 150 rpm. The optimum COD, TSS, colour, TN and turbidity removal was 61%, 64.6%, 82.7%, 10% and 52.4%, respectively. The medium mixing speeds may improve the removal of COD, TSS, colour, TN and turbidity, owing to reduced shearing of the floc during initial formation. ) shows the influence of rapid mixing time on the removal of COD, TSS, colour, TN and turbidity at FeCl3 dosage of 1 g/L. Rapid mixing times of 1, 2, 3, 4 and 5 min were used. It can be observed that 1 min mixing was adequate to give higher removal of COD, TSS, colour, TN and turbidity. The removals of COD, TSS, colour, TN and turbidity were 60.9%, 64.3%, 82.1%, 7.1% and 49.7%, respectively.
3.2.3. Effect of slow mixing
) shows the effect of slow mixing speed (10, 20, 30, 40 and 50 rpm) on removal of COD, TSS, colour, TN and turbidity. Similar to previous results, a significant difference was seen between the mixing speeds in the removal of COD, TSS, colour, TN and turbidity with the optimum slow mixing speed for FeCl3 being 30 rpm. The optimum COD, TSS, colour, TN and turbidity removals using FeCl3 were 57.9%, 58.8%, 79%, 6.6% and 50.1%, respectively. The lower mixing speed could develop the removal of COD, TSS, colour, TN and turbidity in consequence of decreasing flocs shearing during the flocculation stage.
) shows the consequence of slow mixing time on the removal rates of COD, TSS, colour, TN and turbidity at FeCl3 dosage of 1 g/L. Slow mixing times of 10, 15, 20, 25 and 30 min were used. As can be seen from ), after the first 15 min, there is a significant change in the removal percentage of COD, TSS, colour, TN and turbidity. It can be observed that 20 min mixing time was adequate to give higher removal of COD, TSS, colour, TN and turbidity. The removals of COD, TSS, colour, TN and turbidity were 60.9%, 63.2%, 82.7%, 11.4% and 54.5%, respectively.
3.2.4. Effect of settling time
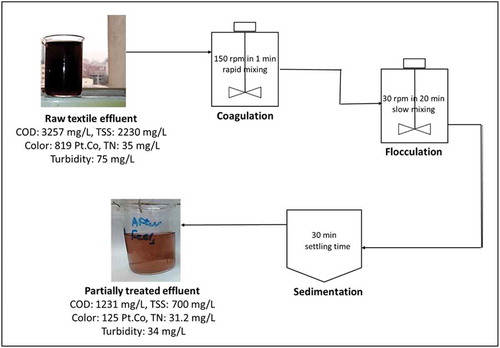
The consequence of settling time on the removal effectiveness was also examined. Rapid and slow mixing speeds and durations were 150 rpm for 1 min mixing, 30 rpm for 20 min slow mixing with settling time of 10, 20, 30, 40, and 50 min. ) shows the effect of settling time at the optimum FeCl3 dosage of 1 g/L. The flocs quickly settle out within the first 10 min, with significant change in the final values after 30 min. The optimum percentage of removals for COD, TSS, colour, TN and turbidity were 58.9%, 62.8%, 82.2%, 9.1% and 55.1%, respectively. shows the raw and final effluent-treated sample characterisation with optimum operating conditions; pH, coagulant dose, rapid and slow mixing conditions by using FeCl3.
Figure 3. Operating conditions of Fecl3 for the removal of COD, TSS, Colour, TN and turbidity a) effect of dose, b) effect of rapid mixing speed, c) effect of rapid mixing time, d) effect of slow mixing speed, e) effect of slow mixing time and f) effect of settling time
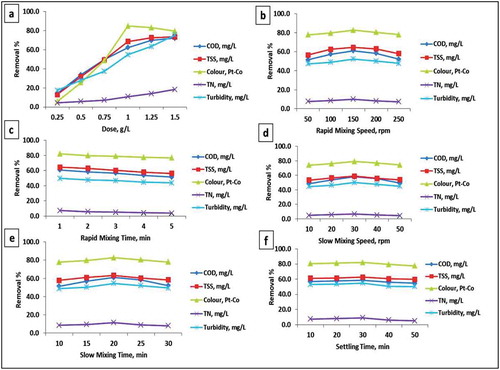
Figure 4. Raw and final effluent treated sample with optimum operating conditions by using 1 g/L FeCl3 at pH 9
4. Comparison results for the treatment of real textile effluent by different coagulants
reviews several studies that depended on the coagulation and flocculation process in treating real textile wastewater in terms of operating conditions and removal efficiencies using various chemical coagulants. Moreover, the removal efficiency by FeCl3 used in this study was listed and compared with other listed coagulants. As presented in , the FeCl3 coagulant used in this study demonstrated high removal efficiency of COD rather than all listed coagulants and also showed higher performance in colour removal better than the Al2(SO4)3 coagulant used by (Naghan et al. Citation2015). Concentrations of effluent pollutants, coagulant dose, mixing and flocculation stirring speed, durations, and settling time are considered the mechanisms that control the difference in removal efficiencies from one study to another.
Table 2. Optimum operating conditions for the treatment of real textile effluents using different coagulants in various literatures
5. ANN model and results
Two ANN models (Model ‘A’ and ‘B’) were trained and tested reasonably well to predict COD, TSS, colour, TN, and turbidity removal efficiently based on several variables.
Model (A) is the prediction of removal efficiencies of the tested parameters (COD, TSS, Colour, TN, and Turbidity) based on one variable (each separate variable) as follows:
“A1- the effect of Dose”, “A2- the effect of Rapid mixing speed”, “A3- the effect of Slow mixing speed”, “A4- the effect of Rapid mixing time”, “A5- the effect of Slow mixing time” or “A6- the effect of Settling time”. When using one variable, other variables are known. In this model, total of (5 x 31 = 155) data set were used, 31 for each tested parameter.
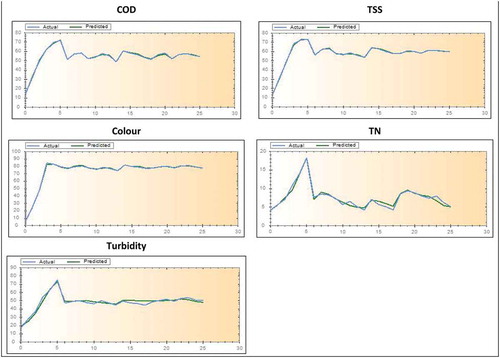
Model (B) is the prediction of removal efficiencies of the tested parameters (COD, TSS, colour, TN, and Turbidity) based all variables together: ‘effect of Dose, Rapid mixing speed, Slow mixing speed, Rapid mixing time, Slow mixing time and Settling time’. In this model, total of (5 x 26 = 130) data set were used, 26 for each tested parameter.
Predicted values versus target (actual) values for the removal of COD, TSS, colour, TN and turbidity were plotted for both models (A and B) as presented in ().
Figure 5. Predicted vs. target values for the removal of COD, TSS, colour, TN and turbidity based on the effect of: A1- dose, A2- rapid mixing speed, A3- slow mixing speed
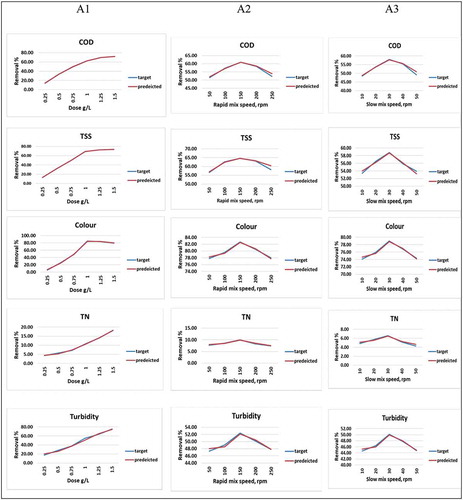
(Model A)
Figure 6. Predicted vs. target values for the removal of COD, TSS, colour, TN and turbidity based on the effect of: A4- rapid mixing time, A5- slow mixing time, A6- settling time
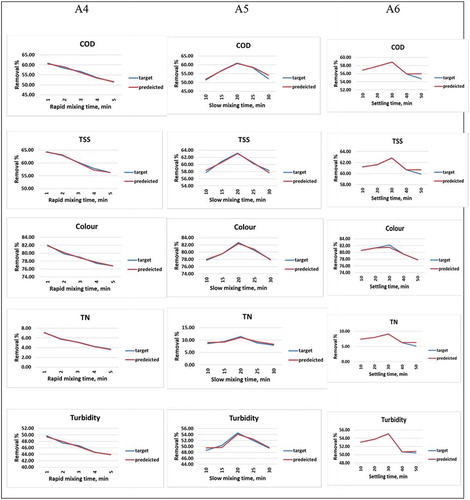
(Model A)
Figure 7. Predicted vs. target (actual) values for the removal of COD, TSS, colour, TN and turbidity based on the effect of all variables (Model B)
A comparison was conducted between the target and the network output (prediction) through calculating the mean squared error (MSE) was performed to show the network response between the predicted output and the corresponding target. Comparing between the removal efficiencies of both predicted (network output) & target for the removal of COD, TSS, colour, TN and turbidity was presented in the scattered diagrams of linear regression analysis for the models as presented in ().
Figure 8. Linear regression between predicted (network output) & target for the removal of COD, TSS, colour, TN and turbidity based on the effect of: A1- dose, A2- rapid mixing speed, A3- slow mixing speed (Model A)
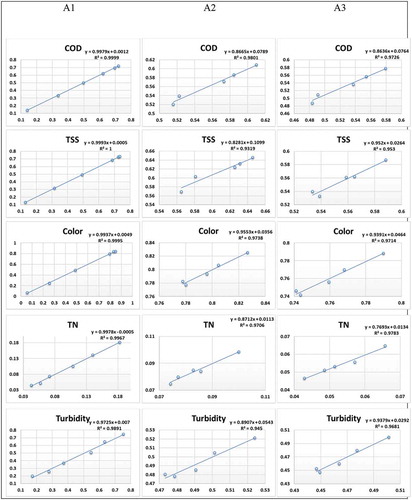
Figure 9. Linear regression between predicted (network output) & target for the removal of COD, TSS, colour, TN and turbidity based on the effect of: A4- rapid mixing time, A5- slow mixing time, A6- settling time (Model A)
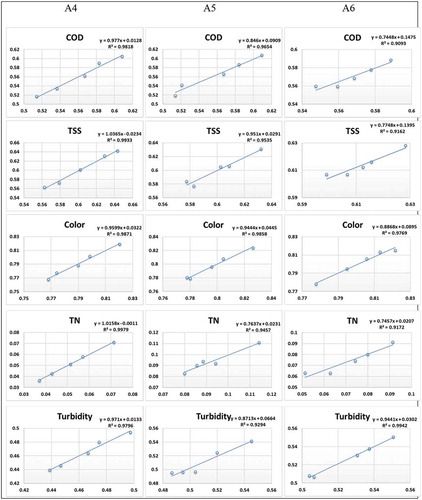
Figure 10. Linear regression between predicted (network output) & target for the removal of COD, TSS, colour, TN and turbidity based on the effect of all variables (Model B)
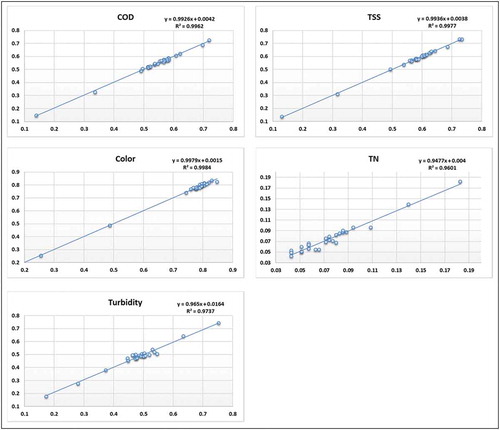
The coefficient of determination values is observed to be more than 0.98, 0.93, 0.95, 0.97, 0.92 and 0.90 for the variables of dose, rapid mixing speed, slow mixing speed, rapid mixing time, slow mixing time, and settling time, respectively, in Model A. On the other hand, the coefficient of determination values is observed to be more than 0.97 Model B. Consequently, the coefficient of determination values is observed to be more than 0.90 for all output results, which present a realistic fitting to experimental data. The linear regression between the network outputs and the corresponding targets showed that the predicted values were clearly approved with the experimental values. It proved a well ANN performance.
6. Conclusion
This research has studied the performance of applying coagulation/flocculation process for real textile effluent treatment. The obtained results concluded that FeCl3 showed better COD, TSS, colour, TN and Turbidity removals than Fe2(SO4)3, AlCl3 and Al2(SO4)3. Also, it was concluded that the ANN model adequately predicted the studied parameters removal efficiencies with a coefficient of determination greater than 90%. The results showed that ANN had the ability of simulating the coagulation process and predicting COD, TSS, colour, TN, and turbidity removal with different experimental data. Therefore, it can reduce the number of laboratory tests, which are time-consuming and expensive. Further research for testing different coagulants that are more effective, environmentally friendly is needed.
Acknowledgments
This research was supported by Nile University (NU).
Disclosure statement
The author(s) declared no potential conflicts of interest with respect to the research, authorship, and/or publication of this article.
Additional information
Notes on contributors
Ahmed Karam
Dr. Ahmed Karam is an Assistant Professor of water and environmental engineering. He has been working in teaching for more than 6 years at reputable universities. He currently works at the civil and infrastructure engineering and management program at Nile University in Egypt. He is an expert in water and wastewater treatment and has many international ranked publications between ranked international journals and conferences. He is currently working on several million Egyptian pound grant for industrial wastewater treatment and management using nanotechnology. Dr. Karam serves as a reviewer in several international journals. He also received a lot of awards and prizes for research activities.
Emad S. Bakhoum
Dr. Emad S. Bakhoum is an Associate Professor in the school of Engineering and Applied Science at Nile University. He has been a faculty member since 2019, in the Civil Engineering and Infrastructure Engineering and Management program. Dr. Emad completed his Ph.D. at University of Southampton, UK and his master’s degree and undergraduate studies at Cairo University, Egypt. His research interests lie in the area of sustainable construction including waste management, green buildings, decision analysis, and automation. Since 2003, Emad has been working at National Research Centre (NRC). He collaborated actively with researchers in local projects during his work at NRC and published many technical papers in several international journals.
Khaled Zaher
Dr. Khaled Zaher is a Professor of sanitary and environmental engineering at the faculty of engineering department at Cairo University. He has more than 40 years of experience in the field of water and wastewater treatment. Dr. Zaher has several published papers in international refereed journals and international refereed conferences. He served as a moderator, internal and external examiner for many M.Sc. and Ph.D. thesis committees and singly supervised Masters and Ph.D. theses in environmental engineering. He has many contributions in the field of engineering consultancy for many national projects.
References
- Aboulhassan, M. A., S. Souabi, A. Yaacoubi, and M. Baudu. 2006. “Removal of Surfactant from Industrial Wastewaters by Coagulation Flocculation Process.” International Journal of Environmental Science & Technology 3 (4): 327–332. doi:https://doi.org/10.1007/BF03325941.
- Alventosa-deLara, E., S. Barredo-Damas, M. I. Alcaina-Miranda, and M. I. Iborra-Clar. 2012. “Ultrafiltration Technology with a Ceramic Membrane for Reactive Dye Removal: Optimization of Membrane Performance.” Journal of Hazardous Materials 209: 492–500. doi:https://doi.org/10.1016/j.jhazmat.2012.01.065.
- Assadi, A., R. Nateghi, G. R. Bonyadinejad, and M. M. Amin. 2013. “Application of Coagulation Process Reactive Blue 19 Dye Removal from Textile Industry Wastewater.” International Journal of Environmental Health Engineering 2 (1): 5. doi:https://doi.org/10.4103/2277-9183.107913.
- Carmen, Z., and S. Daniela 2012. “Textile Organic Dyes–characteristics, Polluting Effects and Separation/elimination Procedures from Industrial Effluents–a Critical Overview.” In Organic pollutants ten years after the Stockholm convention-environmental and analytical update 10: 32373. Croatia: InTech Rijeka.
- Chatoui, M., S. Lahsaini, and A. Aguelmous. 2017. “Removal of Oil and Grease from Vegetable Oil Refinery Wastewaters by Coagulation-flocculation Process.” Moroccan Journal of Chemistry 5 (4): 4–5. 2683–2690.
- Chatzisymeon, E., N. P. Xekoukoulotakis, A. Coz, N. Kalogerakis, and D. Mantzavinos. 2006. “Electrochemical Treatment of Textile Dyes and Dyehouse Effluents.” Journal of Hazardous Materials 137 (2): 998–1007. doi:https://doi.org/10.1016/j.jhazmat.2006.03.032.
- Dalvand, A., M. H. Ehrampoush, M. T. Ghaneian, et al. 2017. “Application of Chemical Coagulation Process for Direct Dye Removal from Textile Wastewater.” Journal of Environmental Health and Sustainable Development 2 (3): 333–339.
- Dos Santos, A. B., F. J. Cervantes, and J. B. van Lier. 2007. “Review Paper on Current Technologies for Decolourisation of Textile Wastewaters: Perspectives for Anaerobic Biotechnology.” Bioresource Technology 98 (12): 2369–2385. doi:https://doi.org/10.1016/j.biortech.2006.11.013.
- Elawwad, A., A. Karam, and K. Zaher. 2017. “Using an Algal Photo-Bioreactor as a Polishing Step for Secondary Treated Wastewater.” Polish Journal of Environmental Studies 26 (4): 4. doi:https://doi.org/10.15244/pjoes/68426.
- El-Gohary, F., and A. Tawfik. 2009. “Decolorization and COD Reduction of Disperse and Reactive Dyes Wastewater Using Chemical-coagulation Followed by Sequential Batch Reactor (SBR) Process.” Desalination 249 (3): 1159–1164. doi:https://doi.org/10.1016/j.desal.2009.05.010.
- Fatimah, S., and W. Wiharto. 2017. “Modeling of Decolorization Dyes by Ozonation Techniques Using Levenberg-Marquardt Neural Network.” Malaysian Journal of Fundamental and Applied Sciences 13 (4): 737–741. doi:https://doi.org/10.11113/mjfas.v0n0.694.
- Federation, W. E. American Public Health, A. 2005. Standard Methods for the Examination of Water and Wastewater. Washington, DC, USA: American Public Health Association (APHA).
- Ghafari, S., H. A. Aziz, M. H. Isa, and A. A. Zinatizadeh. 2009. “Application of Response Surface Methodology (RSM) to Optimize Coagulation–flocculation Treatment of Leachate Using Poly-aluminum Chloride (PAC) and Alum.” Journal of Hazardous Materials 163 (2–3): 650–656. doi:https://doi.org/10.1016/j.jhazmat.2008.07.090.
- Ghaly, A. E., R. Ananthashankar, M. Alhattab, and V. V. Ramakrishnan. 2014. “Production, Characterization and Treatment of Textile Effluents: A Critical Review.” J Chem Eng Process Technol 5 (1): 1–19.
- Ghanbari, F., and M. Moradi. 2016. Electrooxidation Processes for Dye Degradation and Colored Wastewater Treatment. London: CRC Press LLC.
- Häck, M., and M. Köhne. 1996. “Estimation of Wastewater Process Parameters Using Neural Networks.” Water Science and Technology 33 (1): 101–115. doi:https://doi.org/10.2166/wst.1996.0010.
- Hassen E. B., and A. M. Asmare. 2019. “Predictive Performance Modeling of Habesha Brewery’s Wastewater Treatment Plant Using Artificial Neural Networks.” Chemistry International 5(1):87-96. doi:https://doi.org/10.31221/osf.io/k6bvj.
- Holkar, C. R., A. J. Jadhav, D. V. Pinjari, N. M. Mahamuni, and A. B. Pandit. 2016. “A Critical Review on Textile Wastewater Treatments: Possible Approaches.” Journal of Environmental Management 182: 351–366. doi:https://doi.org/10.1016/j.jenvman.2016.07.090.
- Jaafarzadeh, N., F. Ghanbari, and M. Alvandi. 2017. “Integration of Coagulation and Electro-activated HSO5− to Treat Pulp and Paper Wastewater.” Sustainable Environment Research 27 (5): 223–229. doi:https://doi.org/10.1016/j.serj.2017.06.001.
- Johnson, P. D., P. Girinathannair, K. N. Ohlinger, S. Ritchie, L. Teuber, and J. Kirby. 2008. “Enhanced Removal of Heavy Metals in Primary Treatment Using Coagulation and Flocculation.” Water Environment Research 80 (5): 472–479. doi:https://doi.org/10.2175/106143007X221490.
- Karam, A., K. Zaher, and A. S. Mahmoud. 2020. “Comparative Studies of Using Nano Zerovalent Iron, Activated Carbon, and Green Synthesized Nano Zerovalent Iron for Textile Wastewater Color Removal Using Artificial Intelligence, Regression Analysis, Adsorption Isotherm, and Kinetic Studies.” Air, Soil and Water Research 13: 1178622120908273. doi:https://doi.org/10.1177/1178622120908273.
- Kundu, P., A. Debsarkar, and S. Mukherjee. 2013. “Artificial Neural Network Modeling for Biological Removal of Organic Carbon and Nitrogen from Slaughterhouse Wastewater in a Sequencing Batch Reactor.” Advances in Artificial Neural Systems 2013: 1–15. doi:https://doi.org/10.1155/2013/268064.
- Kurt, E., D. Y. Koseoglu-Imer, N. Dizge, S. Chellam, and I. Koyuncu. 2012. “Pilot-scale Evaluation of Nanofiltration and Reverse Osmosis for Process Reuse of Segregated Textile Dyewash Wastewater.” Desalination 302: 24–32. doi:https://doi.org/10.1016/j.desal.2012.05.019.
- Kurup, G. G., B. Adhikari, and B. Zisu. 2019. “Treatment Performance and Recovery of Organic Components from High pH Dairy Wastewater Using Low-cost Inorganic Ferric Chloride Precipitant.” Journal of Water Process Engineering 32: 100908. doi:https://doi.org/10.1016/j.jwpe.2019.100908.
- Lellis, B., C. Z. Fávaro-Polonio, J. A. Pamphile, and J. C. Polonio. 2019. “Effects of Textile Dyes on Health and the Environment and Bioremediation Potential of Living Organisms.” Biotechnology Research and Innovation 3 (2): 275–290. doi: https://doi.org/10.1016/j.biori.2019.09.001.
- Maier, H. R., A. Jain, G. C. Dandy, and K. P. Sudheer. 2010. “Methods Used for the Development of Neural Networks for the Prediction of Water Resource Variables in River Systems: Current Status and Future Directions.” Environmental Modelling and Software 25 (8): 891–909. doi:https://doi.org/10.1016/j.envsoft.2010.02.003.
- Merzouk, B., B. Gourich, A. Sekki, K. Madani, C. Vial, and M. Barkaoui. 2009. “Studies on the Decolorization of Textile Dye Wastewater by Continuous Electrocoagulation Process.” Chemical Engineering Journal 149 (1–3): 207–214. doi:https://doi.org/10.1016/j.cej.2008.10.018.
- Moradi, M., and F. Ghanbari. 2014. “Application of Response Surface Method for Coagulation Process in Leachate Treatment as Pretreatment for Fenton Process: Biodegradability Improvement.” Journal of Water Process Engineering 4: 67–73. doi:https://doi.org/10.1016/j.jwpe.2014.09.002.
- Naghan, D. J., M. D. Motevalli, N. Mirzaei, et al. 2015. “Efficiency Comparison of Alum and Ferric Chloride Coagulants in Removal of Dye and Organic Material from Industrial Wastewater-a Case Study.” Bulgarian Chemical Communications 47 (Specia): 206–210.
- Noman, M., M. Shahid, T. Ahmed, et al. 2020. “Use of Biogenic Copper Nanoparticles Synthesized from a Native Escherichia Sp. As Photocatalysts for Azo Dye Degradation and Treatment of Textile Effluents”. Environmental Pollution 257: 113514. https://doi.org/10.1016/j.envpol.2019.113514.
- Patel, H., and R. T. Vashi. 2015. Characterization and Treatment of Textile Wastewater.United States: Elsevier. doi:https://doi.org/10.1016/C2014-0-02395-7.
- Rai, H. S., M. S. Bhattacharyya, J. Singh, T. K. Bansal, P. Vats, and U. C. Banerjee. 2005. “Removal of Dyes from the Effluent of Textile and Dyestuff Manufacturing Industry: A Review of Emerging Techniques with Reference to Biological Treatment.” Critical Reviews in Environmental Science and Technology 35 (3): 219–238. doi:https://doi.org/10.1080/10643380590917932.
- Rana, S., and S. Suresh. 2017. “Comparison of Different Coagulants for Reduction of COD from Textile Industry Wastewater.” Materials Today: Proceedings 4 (2): 567–574.
- Ribera-Pi, J., M. Badia-Fabregat, D. Arias, et al. 2020. “Coagulation-flocculation and Moving Bed Biofilm Reactor as Pre-treatment for Water Recycling in the Petrochemical Industry”. Science of the Total Environment 715: 136800. doi:https://doi.org/10.1016/j.scitotenv.2020.136800.
- Riera-Torres, M., C. Gutiérrez-Bouzán, and M. Crespi. 2010. “Combination of Coagulation–flocculation and Nanofiltration Techniques for Dye Removal and Water Reuse in Textile Effluents.” Desalination 252 (1–3): 53–59. P 0011-9164.
- Tan, B. H., T. T. Teng, and A. K. M. Omar. 2000. “Removal of Dyes and Industrial Dye Wastes by Magnesium Chloride.” Water Research 34 (2): 597–601. doi:https://doi.org/10.1016/S0043-1354(99)00151-7.
- Teh, C. Y., P. M. Budiman, K. P. Y. Shak, and T. Y. Wu. 2016. “Recent Advancement of Coagulation–flocculation and Its Application in Wastewater Treatment.” Industrial & Engineering Chemistry Research 55 (16): 4363–4389. doi:https://doi.org/10.1021/acs.iecr.5b04703.
- Verma, A. K., R. R. Dash, and P. Bhunia. 2012. “A Review on Chemical Coagulation/flocculation Technologies for Removal of Colour from Textile Wastewaters.” Journal of Environmental Management 93 (1): 154–168. doi:https://doi.org/10.1016/j.jenvman.2011.09.012.
- Willis, M. J., C. Di Massimo, G. A. Montague, M. T. Tham, and A. J. Morris. 1991. “Artificial Neural Networks in Process Engineering.” In IEE Proceedings D (Control Theory and Applications), Vol. 138, 256–266. doi:https://doi.org/10.1049/ip-d.1991.0036
- Yaseen, D. A., and M. Scholz. 2019. “Textile Dye Wastewater Characteristics and Constituents of Synthetic Effluents: A Critical Review.” International Journal of Environmental Science and Technology 16 (2): 1193–1226. doi:https://doi.org/10.1007/s13762-018-2130-z.
- Zangooei, H., M. Delnavaz, and G. Asadollahfardi. 2016. “Prediction of Coagulation and Flocculation Processes Using ANN Models and Fuzzy Regression.” Water Science and Technology 74 (6): 1296–1311. doi:https://doi.org/10.2166/wst.2016.315.
- Zhou, Y., X.-H. Xing, Z. Liu, et al. 2008. “Enhanced Coagulation of Ferric Chloride Aided by Tannic Acid for Phosphorus Removal from Wastewater.” Chemosphere 72 (2): 290–298. DOI:https://doi.org/10.1016/j.chemosphere.2008.02.028.
