
 ?Mathematical formulae have been encoded as MathML and are displayed in this HTML version using MathJax in order to improve their display. Uncheck the box to turn MathJax off. This feature requires Javascript. Click on a formula to zoom.
ABSTRACT
This study presents green-concrete’s mechanical-properties modelling with cementitious portion replaced by PBA/BN ranging from 0-50% using fuzzy-logic. Incorporation of these admixtures in concrete encourages solid-waste derivatives utilization to achieve cost-effective and eco-efficient construction-materials which also mitigates environmental-degradation challenges due to CO2-emission during cement production and hydration. Assessment of the elemental-oxides inherent in the admixtures showed a good pozzolanic-activity with Al2O3+SiO2+Fe2O3 results of 74.75% and 72.03% for PBA and BN respectively. The maximum and minimum strength-responses were derived at 5%-replacement and 50%-replacement with experimental-results of 19.48-4.17MPa, 21.85-4.84MPa, 26.30-8.637MPa, 32.77-12.713MPa and 35.53-18.46MPa for 3-d,7-d,28-d,60-d and 90-d respectively. Fuzzy-logic technique was utilized to evaluate the strength development property of the green-concrete as it takes precisely into account the issue of vagueness of well-defined parameters to develop expert intelligent-model using Mamdani-FIS. The model’s performance was evaluated by using MLR-models, MAPE and RMSE. R2 of 84.905% and 99.1% was calculated for MLR-model and fuzzy-logic model respectively. RMSE and MAPE score of 2.406-2.14%, 6.5935-7.29%, 0.4183-4.62%, 0.2774-1.54%, 0.7544-2.06%, 0.4197-1.48% and 0.7912-1.66% were calculated for the initial and final setting-time, 3-d,7-d,28-d,60-d and 90-d concrete’s compressive-strength target responses respectively. The results obtained from the indicates better performance for the fuzzy-logic model in predicting the setting-time and mechanical-properties of PBA/BN-concrete.
1. Introduction
The conventional ingredients of concrete mixture consist of water, cement, fine and coarse aggregates. However, chemical and mineral admixture are added as supplementary components in order to improve its properties in hardened or fresh state. The method for choosing the required or appropriate mixture ingredients proportion of the concrete so as to obtain concrete of obligatory mechanical, durability and economical parameters is termed mix design (Aprianti Citation2017). The development of techniques used to obtain the optimised proportion of concrete mixture has been a subject of several studies to determine a cost effective and ample material to constitute the concrete mixture. Cement-based materials’ engineering properties depend majorly on the following factors; the intrinsic different characteristics of various ingredients in the mixture, the non-homogenous nature of these components and the existence of contradictory effects of some mixture components on its performance (Elinwa and Mahmood Citation2002; Attah, Etim, and Sani Citation2019). A better understanding of these complex factor constraints is necessary to successfully utilise and incorporate these supplementary cementitious materials (SCMs) in various engineered construction works to achieve desired durability performance (Ettu et al. Citation2013).
The development of supplementary cementitious materials (SCMs) is fundamental to advancing low cost construction materials to be used in the production of a self-sufficient means of shelter especially in developing countries (Snellings, Mertens, and Elsen Citation2012). Further interest in sustainable concrete materials will revolve round the merits and benefits associated with using SCMs. Apart from improving concrete’s mechanical properties, the main benefits come from saving natural resources and energy as well as protecting the environment through the use of these mineral admixtures (Werner Citation1994). In the previous research on utilisation of palm bunch ash to achieve sustainable construction materials, the effect of palm bunch ash PBA in the production of clay bricks was investigated with SCM levels arranging from 3 to 35%. Bricks were produced by replacing clay of 5, 10, 20, 25 , and 35% with palm bunch ash and fired at 900, 1000, 1100, 1200, 1500°C, respectively (Mbadike Citation2010). Also, Ahmad et al. (Citation2011); in their work on the effect of Pakistan Bentonite as admixture mixed with concrete and mortar on the engineering properties was assessed with varying ratio of cement in the concrete and mortar mixture replaced with the Bentonite ranging from 0 to 50%. Strength activity index results obtained for the admixture indicated that it conforms to ASTM C618 standard specifications provided it is not treated at 900C temperature. The resultant concrete’s permeability test results indicate a decrease in water absorption for mortar as the cement ratio was partially substituted up to 30% by the Bentonite; the durability test results indicate better compressive strength obtained when soaked in 2% MgSO4 and 5% Na2SO4 was also at 30% replacement ratio. It was observed that the addition of higher percentage of Bentonite resulted to increase in water demand of the concrete mixture while the compressive strength characteristics of the concrete decreases as the replacement ratio increases. Moreover, Aggarwal et al. (Citation2013a); in their study on utilisation of soft computing techniques (fuzzy logic model) for the prediction of the compressive strength of high – strength concrete (HSC). In their mixture design, supplementary cementitious materials namely; fly ash, silica fume, fibre and super plasticiser were added to the concrete mix. The laboratory responses together with the generated data are used for the fuzzy logic model development. To evaluate the generated model performance, mean absolute error (MAE), correlation coefficient (R2), root mean squared error (RMSE) were used and the obtained results was further validated using artificial neural network (ANN) model. Furthermore, Akkurt, Tayfur, and Can (Citation2004); in their work, fuzzy logic model technique was utilised for the prediction of 28-day compressive strength property of cement mortar. Data sets used for the model development were obtained from the cement plant with the alkali variables namely; tri-calcium silicates (C3S), SO3 and Blaine were the input variables while the 28-day compressive strength was the output variable. The developed model was compared with the ANN model for performance evaluation and the results indicate a better model performance.
Mixture of concrete are defined to give a wide range of durability and mechanical characteristics to attain the design specification and requirements of a structure. The concrete’s compressive strength is one of the essential common performance evaluation measure utilised by the engineers in the structural design and analysis of building or other concrete framed structures (Onuamah Citation2015; Alaneme, Ezeokpube, and Mbadike Citation2020). It is calculated from the quotient between the load at failure and the cross-sectional area of the concrete resisting the applied load and the result is presented in units of mega Pascal (MPa) or Newton per squared millimetre (N/mm2). The concrete’s compressive strength specifications and requirements may vary from 17 MPa for concrete works utilised in residential building up to 30 MPa and higher for commercial and high-rise structures (Neville and Brooks Citation2002). The test results of the compressive strength of the concrete are mainly used to ascertain that the mixture of the concrete as delivered meets or attains the required specification for specified strength (fc) (Elinwa, Ejeh, and Akpabio Citation2005).
Fuzzy logic is a multi-valued logic processing system, which does not provide discrete values but works on value ranging from 0 to 1 and possesses linguistic variables. Moreover, the fuzziness, impreciseness and vagueness inherent in linguistic variables is being translated into mathematical notation which will enable computers to process, compute and manipulate it. Fuzzy controllers can also approximate the relationship between model inputs and outputs parameters through interpolation in a vague environment (Demir Citation2005). The idea in this research study is to evaluate the mechanical strength and setting time properties of concrete whose cementitious portion were partially replaced by varying ratios of palm bunch ash (PBA) and bentonite (BN) through the development of expert artificial intelligent systems using fuzzy logic so as to achieve sustainable concrete for structural works. Development of models. One of those novel breakthroughs is the generation of intelligent models for compressive strength and setting time for performance monitoring and engineering design of concrete works. This research will also contribute to scientific knowledge on soft-computing techniques deployment for the modelling of cement-SCM blend, to enhance good decision making in the admixtures’ utilisation in concrete production and improve its general engineering properties. Moreover, this work presents a new approach for the recycling and reuse of solid waste and its derivatives as pozzolanic component in concrete through expert artificial intelligent systems development using fuzzy logic in modelling its rheological and mechanical strength behaviour (Baykasoglu, Dereli, and Tanis Citation2004; Mazer and Geimba Citation2011).
1.1 Research significance
This research study provides additional information on the optimization and utilization of solid waste and its derivatives as supplementary cementitious materials for concrete works.
To evaluate the applicability of fuzzy logic model soft computing technique in prediction of the setting time and mechanical properties of the concrete formed.
To ascertain the optimal combination levels of the admixtures’ in the concrete mixture with respect to the desired mechanical strength and setting time properties.
To validate the performance of the model developed using MLR, RMSE and MAPE
1.2 Fuzzy logic
Fuzzy logic is an efficient and effective system of implementing the non-linear mapping between the output and input variables. Fuzzy set theory presents a systematic computation to deal with linguistic variables and perform numerical calculation using linguistic labels which are simulated by associated membership functions (Kim and Heeyoung Citation2016). Fuzzy logic is a type of multi-valued logic processing system which deals with reasoning in an approximate intelligent manner instead of exact and fixed. Contrary to the Boolean and traditional logic system where the result is either false or true. It is also systematic to deal with the concept of partial truth where the truth value ranges from completely false to completely true (Madadi, Tasdighi, and Eskandari-Naddaf. Citation2019; Topcu and Sarıdemir Citation2008).
Fuzzy logic is a mathematical computation technique with words using a logic based on the principles of a fuzzy set. It refers to multi-valued logic system where its truth value stipulation of a complex logical proposition is ascertained by the truth value of its components and its varying degrees of truth are represented by values between 0 and 1 (Zadeh Citation1992). Through this computational process, the concrete mixture components’ proportions obtained from expert judgement and relevant literatures on concrete ingredients’ mixture design formulation, with its corresponding responses are synthesised to generate intelligent model with high prediction accuracy (Aryafar et al. Citation2018).
Classical set is a set of variables such that x is from the universal discourse X and x has a property . This is expressed mathematically in EquationEqn. 1
(1)
(1) below;
While in a fuzzy set, we provide x with a membership function of x in the set A i.e. for every element the degree of membership must be between 0 and 1; and x is coming from a universal discourse X. this is expressed mathematically in EquationEqn. 2
(2)
(2) below;
That is to say that the membership function quantifies the degree of belongingness of x to A (Mazer and Geimba Citation2011).
1.3 The membership functions basic features
The membership functions utilised in fuzzy logic method has the following features outlined below and showed diagrammatically in .
Core
Figure 1. Basic features of membership function
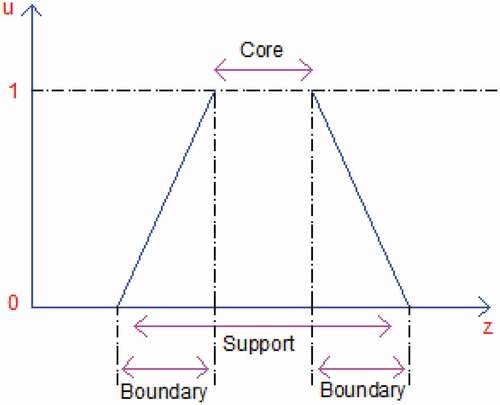
The core of a Membership Function for a fuzzy set is the region of the universe discourse which is characterised by complete or full membership in a fuzzy set. The core of the membership function constitute all elements (z) of the discourse such that
.
Support
The support of a membership function for a fuzzy setis the region of the universe discourse which is characterised by non-zero membership in the fuzzy set. The support of the membership function constitutes all elements (z) of the discourse such that
.
Boundary
The membership function boundary of a fuzzy set is the region of the universe discourse which is characterised by an incomplete membership set but also non-zero membership in the fuzzy set. The boundary of the membership function constitutes all elements (z) of the discourse such that
2.2 Fuzzy Inference System (FIS)
Fuzzy inference system (FIS) is a decision-making system which is based on fuzzy logic rules to generate crisp output result. It take inputs data to process them to specified rules to enable the generation of outputs. The generated output and inputs are real valued, while the internal processing system is based on fuzzy arithmetic. Fuzzy inference is defined as a process of formulating input and output mapping using fuzzy logic system and its system of operation is shown in .
Fuzzification
Figure 2. Components of Fuzzy Inference System (FIS)
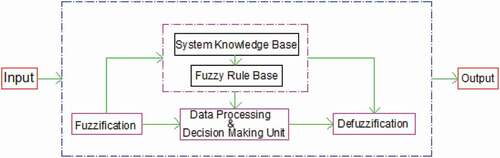
It involves the conversion of the pieces of input data sets to degrees of membership by matching up with their corresponding series of membership functions. Its purpose is to map the inputs from a set of sensors (or features of those sensors) to values from 0 to 1 using a set of input membership functions. In this operation, crisp input data are accurately translated into linguistic variables.
Fuzzy rule base
It consists of basically fuzzy rules where all possible fuzzy relationship between the output and input data sets obtained from the system knowledge base For fuzzy logic approach, there is no model parameters and mathematical equations required and all constraints, model complexity and non-linear relationships are incorporated in the fuzzy inference setup in the form of IF-THEN statements.
Fuzzy inference engine
The fuzzy inference engine major function is to simulate the reasoning process of human being by evaluation of the inputs fuzzy inference and the IF-THEN fuzzy rules. It considers all the rules in the fuzzy rule base and then learns to transform sets of input variables into output results.
Defuzzification
This involves the conversion of resulting outputs obtained from the inference engine to a crisp numerical values. It converts the fuzzy output of the decision-making unit or inference engine to crisp using membership functions analogous to the ones used by the fuzzifier (Nasrollahzadeh and Basiri Citation2014; Klir and Yuan Citation2001).
2.3 Two types of fuzzy inference method
Mamdani FIS
Mamdani method was presented by Ebrahim Mamdani in 1976; the method utilises minimum of two input variable and one output variables. In this fuzzy inference system, the consequent of the fuzzy rule in the form of IF-THEN is represented as fuzzy area; that is to say that the output and input variables are divided into fuzzy sets in this method and the output parameter possesses a non-continuous surface (Mamdani Citation1975).
Sugeno FIS
This method also known as Takagi-Sugeno-Kang method of fuzzy inference. Introduced in 1985, it is similar to the Mamdani method in several respects. The first and second stages of the fuzzy inference process, which involves inputs fuzzification and fuzzy operator applications are exactly similar; but the major differences between Sugeno and Mamdani fuzzy inference method is that in Sugeno, the membership function of the output variables are either constant or linear (Topcu and Sarıdemir Citation2008).
The fuzzy rule for this method takes the following form presented in EquationEqn. 3(4)
(4) ;
If Input 1 = X1, Input 2 = X2, Input 3 = X3, then the output Y = aX1 + bX2 + cX3 + d(3)
The output level Y is a constant (that is a = b = c = 0) for a zero-order Sugeno model.
2.4 Multiple Linear Regression MLR
Multiple Linear Regression MLR is a statistical technique for estimating the dependent variables outcomes based on the values of possible independent variables. It is expressed mathematically in EquationEqn. 4(4)
(4) using explanatory variables and coefficients to predict the values for the response parameter.
Where is the predicted or response of the dependent variables;
are independent variables or predictors;
is the intercept or the constant term and also represents the value of
when all the predictor variable
are zero. The idea of simple linear regression involves the use of a single predictor or input variable to model the response or target variable where as in many non-trivial applications, there exists more than one factors to be considered for either the predictor variables or the response variable. Thus MLR is utilised for modelling of multiple input and multiple/single output system (Rencher and Christensen Citation2012).
3. Materials and methods
3.1 Materials
3.1.1 Portland cement
Dangote cement (53 grade) was used in this study with 30% normal consistency conforming to the requirements of cements class (CEM II) as prescribed in Nigerian Industrial Standard (NIS) 444–1 specifications, composition and conformity criteria.
3.1.2 Water
Water is a very important ingredient which affects the concrete’s mechanical and rheological properties. Clean potable water were taken for this experiment and it satisfies ASTM C1602-12 requirement of water for use in concrete mixtures.
3.1.3 Test admixtures
The palm bunch ash (PBA) was obtained through controlled incineration of the palm bunch to temperature of about 60°C which is a solid waste from processing of palm oil. The palm bunch is gotten from Adapalm in Ohaji Local Government Area of Imo State, Nigeria. The ash residue obtained after the incineration is collected and sieved in the laboratory using 150 sieve to obtain a finely divided material for the experimental process and prepared according to BS 8615–1:2019 specifications.
The bentonite (BN) was procured from building material market in Imo State, Nigeria. The fine aggregate used was clean river sand, free from deleterious substances with a specific gravity of 2.62 and bulk density of 1533 kg/m3. The coarse aggregate was obtained from a nearby local supplier with a maximum size of 20 mm, specific gravity of 2.65 and bulk density of 1467 kg/m3 (Onyelowe and Ubachukwu Citation2015; Akbar et al. Citation2013).
3.1.4 Concrete aggregates
The fine aggregates used is clean river sand which is free from dirt and obtained from a river-bed in Mkpat Enin, Akwa Ibom State, Nigeria. The fine aggregate used passes through 2.36 mm sieve size and was prepared to BS EN 12,620.
The coarse aggregate used is also clean and free from deleterious materials, well graded and conforming to ASTM C125-16 (2016). It is crushed granite of maximum size 20 mm.
3.2 Methods
Concrete mixtures of varying replacement proportion the cementitious portion palm bunch ash (PBA) and Bentonite (BN) replacement ranging from 0 to 50% were investigated in this experimental study to evaluate the setting time and compressive strength properties of the concrete produced after 3, 7, 28, 60 and 90 days of hydration. The basic parameters for the concrete ingredients mixture design are; characteristic target strength of 43 N/mm2, cement content of 340 kg/m3, water cement ratio (w/c) of 0.5, fine and coarse aggregate content of 627 and 1273 kg/m3, respectively (Naderpour, Rafiean, and Fakharian Citation2018).
3.2.1 Compressive strength test
The compressive strength is determined in the laboratory using crushing test. The test involves thorough mixing of the aggregates and the mixture ingredients. In the mixture, cementitious content of the concrete is substituted by varying ratios of palm bunch ash (PBA) and bentonite (BN) from 0% (which is the control) to 50%. After mixing thoroughly, the concrete moulds measuring were prepared to minimise friction between the moulds and the concrete mix. The concrete mix is then placed in mould and compacted well to the brim in three layers using a scoop. After 24 h, the concrete samples were de-moulded and cured for 3-day, 7-day, 28-day, 60-day and 90-day respectively, and at the end of each period of curing, the concrete samples are crushed to obtain the average compressive strength with three replicates for each experimental run. The mathematical formula is presented in EquationEqn. 5
(5)
(5) . (Naderpour, Rafiean, and Fakharian Citation2018).
3.2.2 Setting time test
Vicat apparatus is utilised to obtain the initial and final setting of the mixture paste. For the control (0% replacement), 200 g of cement was used with 100 g of water during the experiment and mixed to obtain a cement paste in plastic form. The plastic mixture is then poured carefully into the vicat mould and then placed on the vicat apparatus. Before the placement of the vicat mould containing the mixed paste, the initial setting pin is fixed on the vicat apparatus to determine its initial setting time. The apparatus is calibrated in millimetres and for the setting time determination, the initial pin is dropped on the paste to mm calibration mark on the vicat apparatus. The initial setting time is then recorded starting from the time water was added to the cement till the time of dropping of the pin is
mm mark on the apparatus. The final setting time was obtained using the final setting pin which is attached to the apparatus immediately after the initial setting time reading is taken. The final setting time was taken when only the inner pin makes a mark on the paste when allowed to drop freely. The final setting time is then recorded starting from the time water was added to the cement till the time the inner final setting pin makes a mark on the paste. This experiment is then repeated for 5, 10, 20, 30, 40, and 50% replacement of cement with palm bunch ash (PBA) and bentonite (BN) respectively, with three replicates for each experimental run (Chimmaobi et al. Citation2020; BS EN 12390–3 Part 3 Citation2002).
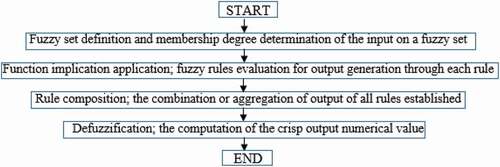
3.1 Data processing techniques
For this purpose, we assess the setting time and compressive strength property of the concrete with the cementitious content replaced by varying proportions of BPA and BN. Fuzzy logic based algorithm modelling was adapted in the study using fuzzy logic toolbox in MATLAB. The processing parameters utilised for this modelling process are triangular membership function which depicts the degree of truth of a fuzzy logic; Mamdani fuzzy inference system which is widely accepted for capturing expert knowledge, producing a precise value of output resulting from generated rules integration and to infer new idea based on existing data sets (Mamdani Citation1975). It involves four sequential stages shown in .
Figure 3. Flow chart illustrating mamdani FIS sequence of operation
The parameters used in the Mamdani FIS is presented in
Table 1. Mamdani FIS modelling parameters
The rule base is generated using the following format; If Input is X1 and Input is X2 and Input is X3; then Output is Y1, Output is Y2, Output is Y3, Output is Y4, Output is Y5, Output is Y6, Output is Y7.
Where X1, X2, X3, is the corresponding membership functions for the input parameters and Y1, Y2, Y3, Y4, Y5, Y6, Y7 is for the output variables’ membership functions.
The obtained fuzzy logic-based model will be validated using loss function parameters namely; Root mean squared error (RMSE), mean absolute percentage error (MAPE) and these results are further compared with Multiple Linear Regression (MLR) performance results.
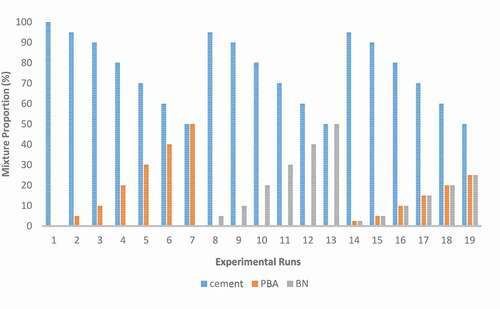
3.2 System data base for the fuzzy logic model development
The data generated from the laboratory methods to determine the mechanical properties and setting time of concrete constitute the system knowledge base of the fuzzy logic model for this study. The input variables consist of the mixture ratio of ingredients which constitute the cementitious portion of the test concrete mix namely; cement ratio, PBA ratio and BN ratio. The cement proportion was as usual dominant while the proportions of PBA and BN ranges from 5 to 50% replacement. The variation of these proportion mix is expected to have effects on the setting time and the mechanical properties of the test concrete. The bar chart showing these cementitious ingredients proportion of the test concrete is presented in .
Figure 4. Cementitious ingredients proportion of the test concrete
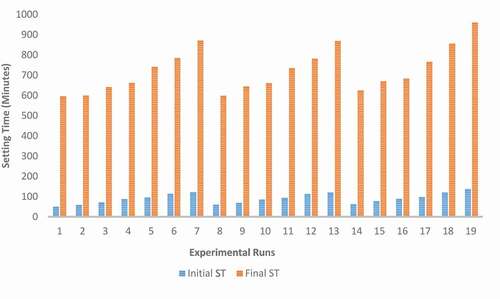
The setting time of the cement paste is presented in a bar chart in , which shows the initial and final setting time with units in minutes. These generated values constitute the output variables of the fuzzy logic model.
Figure 5. Setting time response
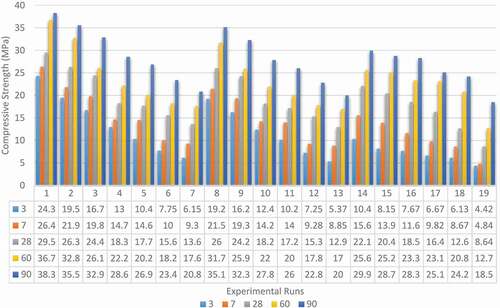
The compressive strength result of the concrete is presented in the bar chart in , which shows the test concrete responses with respect to varying periods of hydration with units in MPa. The curing periods include; 3-day, 7-day, 28-day, 60-day and 90-day and these generated results are used for the output variables of the fuzzy logic model development.
Figure 6. The compressive strength response with respect to varying curing periods
3.3 Model performance measure
Statistical analysis tools and techniques were employed for the computation to evaluate the model performance using multiple linear regression MLR and loss function parameters namely; mean absolute percentage error (MAPE) and root mean square error (RMSE) is computed using EquationEqns. (6–7)(6)
(6) below;
Where n represents the sample size, represents the measure or experimental values and
represents the estimated or predicted values.
MAPE is a prediction accuracy measure of a predicting model in statistics which is utilised as loss function in machine learning regression problems. It is used to measure the error size of a model in percentage terms while the error is defined as the difference between the actual and predicted values (Kim and Heeyoung Citation2016).
RMSE is simply the squared root of standard deviation of the difference between the actual and estimated values for the model validation. This calculation is done using Microsoft Excel software and the essence of the computation is to enable us to determine the distance apart from the regression line data points and to assess the measure of how dispersed the residuals are from the fitted line. The results range from 0 for the best performance, which means all points lie on the line signalling zero error to 1 for the worst performance (Ritter and Muñoz-Carpena Citation2013; Hyndman and Koehler Citation2006).
4. Results and discussion
The physicochemical assessment of the supplementary cementitious materials used in this study is presented in . From the result, the combined ratio of Al2O3+ SiO2+ Fe2O3 which satisfies a good pozzolanic material as stipulated in ASTM C618 (Citation2008) were used to validate the results. From the results, PBA possessed by percentage 52.23 (SiO2), 20.70 (Al2O3) and 1.8 (Fe2O3) totalling 74.75% while BN possessed by percentage 54.58 (SiO2), 16.19 (Al2O3) and 1.26 (Fe2O3) totalling 72.03%. BN also possess higher percentage of MgO and ZnO (2.5% and 0.89%) compared to PBA with 1.52 and 0.34%, respectively. These results indicate a better pozzolanic behaviour for the admixtures when mixed with concrete to improve its durability property. Specific gravity and bulk density of 2.74 and 805 kg/m3 were obtained for PBA while 2.76 and 785 kg/m3 were obtained for BN, respectively (Mbadike Citation2010).
Table 2. Physical and chemical analysis of Palm Bunch Ash (PBA) and Bentonite (BN)
4.1 Compressive strength of the PBA/BN Concrete versus concrete curing period
From the generated laboratory data utilised for the evaluation of the setting time and mechanical properties of the concrete whose portion of the cementitious content is substituted with varying ratio of PBA and BN. The compressive strength test results obtained for varying hydration period enable us to observe the effect of pozzolanic reaction in strength development of the test concrete from 3 to 90 days of hydration. The maximum and minimum strength responses were derived at 5% and 50% replacement of cement by the admixtures with experimental results of 19.48–4.17, 21.85–4.84, 26.30–8.637, 32.77–12.713 and 35.53–18.46 MPa for 3, 7, 28, 60 and 90 d, respectively. The experimental results obtained were in agreement with the research findings by Naderpour, Rafiean, and Fakharian (Citation2018) which meet the requirements of concrete for structural use NCP 1 and for reinforced concrete according to BS 8110: Part 1.
The graphical presentation of the compressive strength responses with respect to varying hydration period of PBA-BN concrete is shown in , and . The result shows that 0% replacement (control) produced the maximum compressive strength. The strength decreases with increase in proportion of PBA and BN in the test concrete mix and the minimum strength is obtained at 50% replacement of the cement with PBA and BN.
Figure 7. The graph of compressive strength versus concrete curing age for PBA
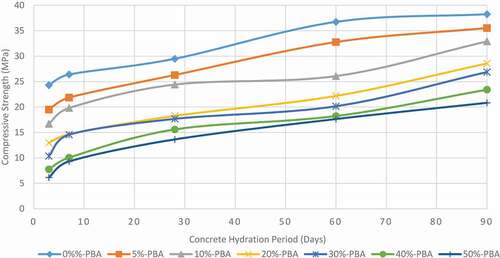
Figure 8. The graph of compressive strength versus concrete curing age for BN
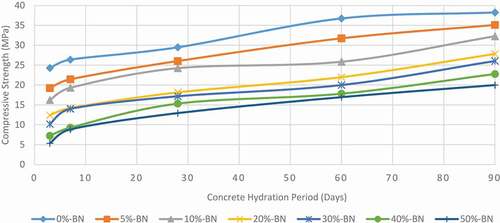
Figure 9. The graph of compressive strength versus concrete curing age for PBA/BN
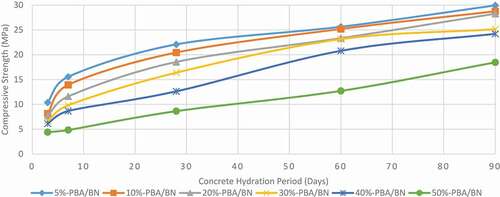
For the 3-day and 7-day hydration periods which are the initial or early curing stages, the results obtained indicates slow gain of compressive strength at that period of curing. At 28-day hydration often utilised as a major strength indicator because the specimen is expected to develop more than 90% strength at this stage, the compressive strength value obtained increases relatively for varying replacement levels with 50% replacement of PBA and BN producing the minimum compressive strength. Moreover, at 60-day curing period, the strength results obtained for PBA and BN replacements was observed to increase rapidly more than the relative increase witnessed for the control concrete mixture (0% replacement). Although the control mix produced the maximum compressive strength, the varying levels of replacement produced an improved value compared to their strength at early curing stages. This is due to the commencement of pozzolanic action, which takes place when the alumina-silicates present in PBA and BN samples react with the hydrated lime liberated during cement hydration. Finally, at 90-day curing period, there is further improvement in the compressive strength values obtained for the concrete mix replaced with percentages of PBA and BN; even though the control mix (0% replacement) produced maximum compressive strength while the significant improvement in the compressive strength is to further confirm that the cement continues to hydrate and gain more strength at extended hydration periods (Mbadike Citation2010).
4.2 Fuzzy logic model development
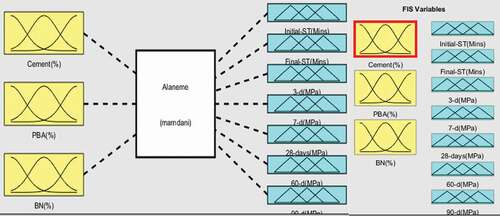
Fuzzy logic model was generated and used to estimate the setting time and the mechanical properties of concrete whose cementitious content were substituted by varying proportions of PBA and BN. The Mamdani fuzzy inference system FIS was utilised for the model development as it has the ability to accommodate multiple input and multiple output system. The input variables are the cement (%), PBA (%) and BN (%) proportion while the output variable which include the initial and final setting time, 3-day, 7-day, 28-day, 60-day, 90-day hydration period compressive strength and the connections of variable are presented in .
Figure 10. The input and output variables connections
4.2.1 Membership functions of the input and output variables
The triangular membership function is utilised for the fuzzy model development for the output and input parameters and is presented from MATLAB computation report in . The Membership function is assigned to the corresponding fuzzy set based on expert judgement, experiences and assessment of the generated laboratory data which constitute the system knowledge base for the modelling process. From the tabulated script we observe that five membership functions each were assigned to the three input variables and the seven output variables structured so the evaluation of the setting time and mechanical properties namely. Very low (VL), low (L), medium (M), high (high) and very high (VH) (Klir and Yuan Citation2001).
Table 3. Membership functions of the FIS variables
4.2.2 Fuzzy rules generation
Based on experts judgement, the input and output datasets were assessed to produce the rules autonomously through the help of the assigned membership functions MF and the rules take the following form in Eqn. 8
If Input 1 = MFin 1 and/or Input 2 = MFin 2 and/or … then output 1 = MFout 1, output 2 = MFout 2 … output 7 = MFout 7(8)
Based on thorough assessment of the data sets and expert judgement, nineteen rules were established (Yilmaz and Yuksek Citation2009).
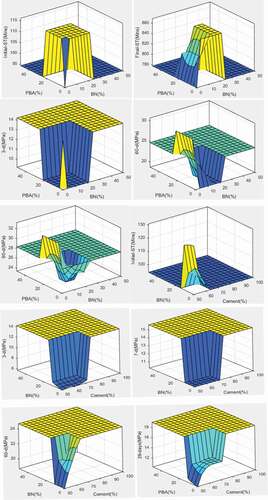
4.2.3 Inputs and outputs variables relationship (surface plot) of the fuzzy model
After assignment of appropriate membership functions MFs according to experienced decision making, these membership functions were utilised to formulate the fuzzy rules using the IF-THEN format to enhance better generalisation of data for better estimation of the output results. This functional relationship is shown in a surface plot in , which creates a 3-dimensional surface to observe and evaluate the effect of variations of the input parameters on the output variable results obtained (Prasad, Eskandari, and Venkatarama Reddy Citation2009).
Figure 11. The input and output variables surface plots
4.2.4 Defuzzification
In order to determine the crisp numeric output value in Mamdani fuzzy inference system, defuzzification is performed after aggregation of the formulated fuzzy IF-THEN rules based on the assigned membership functions. This is carried out by method known as centroid of area method and it signals the final stage of the fuzzy inference operation after which the output crisp values corresponding to the set of fuzzified inputs will be derived based on the formulated rule base and the modelling parameters used. Quantifiable output values are obtained in crisp logic from the fuzzy set at the end of this computational process (Das and Sivakugan Citation2010).
4.3 Validation of model performance evaluation
The developed fuzzy logic model performance in terms of accuracy of prediction is evaluated using loss function parameters MAPE and RMSE after which the system data base were also modelled using MLR statistical methodology; the results obtained were compared with fuzzy logic model results in order to affirm its predicting accuracy. Due to the fact that the use of coefficient of determination alone can mislead because better R2 does not absolutely signify better model generalisation performance (Alaneme et al. Citation2020; Das and Sivakugan Citation2010). The result summary for MLR modelling is presented in ; from the results, regression coefficients and model summary indicates that the generated regression model possesses a non-robust characteristic and average performance with average coefficient of determination of (COD) 84.905% this computed results.
Table 4. Multiple Regression Analysis Result
The loss function computation was carried out using Microsoft excel software and from the obtained results, which yields a sufficient assessment of the developed fuzzy logic model performance in terms of improved accuracy of prediction. The results indicate that there is a good correlation between the laboratory or actual data and the fuzzy logic model results with an average coefficient of determination (COD) of 99.1%.
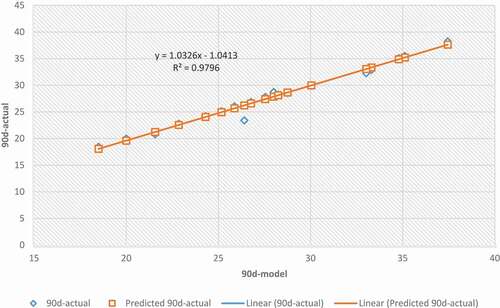
The residual response line of fit plot which expresses the best relationship points between two variables is shown in . The results present the slope of the regression line of fuzzy logic model vs. experimental results, line of fit equations for the target response parameters is presented in EquationEqns(1)
(1) . 9–15. The computed statistical results shows that there is no significant difference between the actual values and fuzzy logic model results with RMSE, MAPE and R2 of 2.406, 2.14% and 0.9909; 6.5935, 7.29% and 0.997; 0.4183, 4.62% and 0.9954; 0.2774, 1.54% and 0.997; 0.7544, 2.06% and 0.982; 0.4197, 1.48% and 0.9956; 0.7912, 1.66% and 0.9796 for the initial and final setting time, 3-d, 7-d, 28-d, 60-d and 90-d concrete’s compressive strength target responses, respectively, as shown in . The model statistical evaluation results were also are in agreement with the fuzzy-logic model validation results obtained by Alaneme et al. (Citation2020) and Reza et al. (Citation2018) which indicate that the developed model exhibits better performance.
Table 5. Test of adequacy of the generated model
Figure 12. Line of fit plot for initial setting time
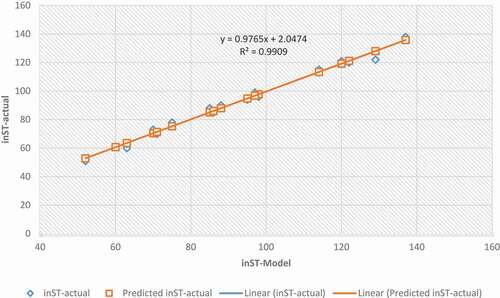
Figure 13. Line of fit plot for final setting time
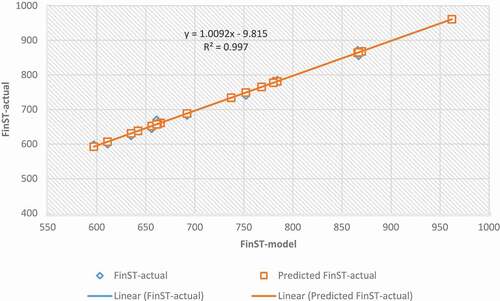
Figure 14. Line of fit plot for 3d compressive strength
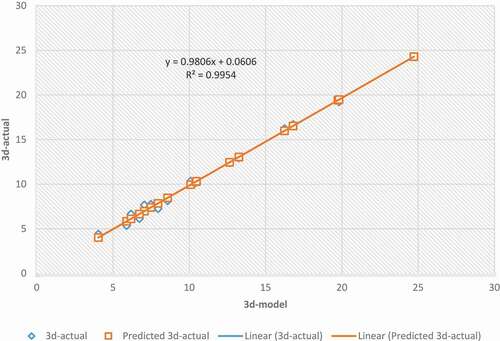
Figure 15. Line of fit plot for 7d compressive strength
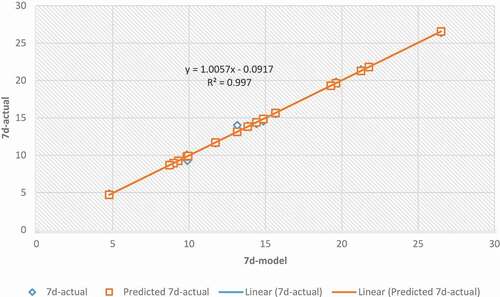
Figure 16. Line of fit plot for 28d Compressive Strength
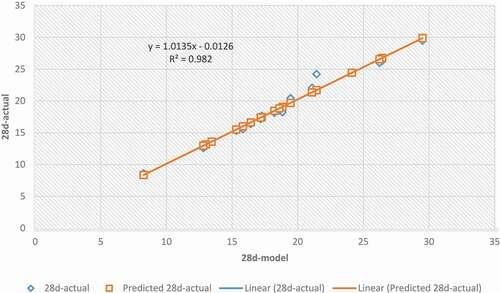
Figure 17. Line of fit plot for 60d compressive strength
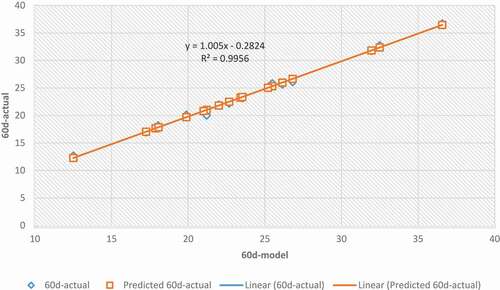
Figure 18. Line of fit plot for 90d compressive strength
5. Abbreviations
SCM : Supplementary cementitious Material; PBA : Fraction of palm bunch ash; BN : Fraction of bentonite; InST : Initial setting time; FinST : Final setting time; C–S–H : Calcium silicate hydrate; FIS : Fuzzy Inference System; R2 : Coefficient of Determination (COD); MAPE : Mean Absolute Percentage error; MLR : Multiple Linear Regression; RMSE : Root mean square error; 3d – 3 :Day cured concrete compressive strength; 7d – 7: Day cured concrete compressive strength; 28d – 28: Day cured concrete compressive strength; 60d – 60: Day cured concrete compressive strength; 90d - 90– Day cured concrete compressive strength
6. Conclusion
Experimental investigations were carried out in this research study to evaluate the setting time and compressive strength properties of PBA-BN concrete through expert intelligent model development using fuzzy logic. The incorporation of these admixtures, which possess good pozzolanic property in concrete resulted in significant improvement in its mechanical properties with the strength development observed to be slower during the initial days of hydration while the strength gain for the concrete kept on increasing with prolonged curing. Palm bunch ash (PBA) and bentonite (BN) possess remarkable pozzolanic activity and from physicochemical analysis results, Al2O3+ SiO2+ Fe2O3 values obtained were 74.75 and 72.03% for PBA and BN, respectively, which shows a good pozzolanic material according to the requirements of ASTM C618 (1991). From the experimental test results, we observe rise in percentage difference with PBA and BN replacements (5–50%) from 16.22–82.08%, 0.8–37.65%, 22.02–119.25%, 18.82–95.74%, 11.45–73.58%, 11.42–70.30% and 7.38–48.15% for initial and final setting time, 3, 7, 28, 60 and 90 days hydration period target responses, respectively. These results signify an increase in setting time property as the proportion of PBA/BN increase while there were also decreased in percentage difference as the curing duration increases which indicates the pozzolanic reaction effect in mechanical strength development of PBA/BN concrete. The test of adequacy of the model was carried out using MLR models and loss function parameters; MAPE and RMSE. From the MLR model summary, coefficient of determination of (COD) of 84.905% was calculated which is lower than 99.1% obtained for the fuzzy logic model results. Model evaluation computation results showed there is no significant difference between the actual values and fuzzy logic model results with RMSE and MAPE score of 2.406 and 2.14%; 6.5935 and 7.29%; 0.4183 and 4.62%; 0.2774 and 1.54%; 0.7544 and 2.06%; 0.4197 and 1.48%; 0.7912 and 1.66% for the initial and final setting time, 3-d, 7-d, 28-d, 60-d and 90-d concrete’s compressive strength target responses, respectively. Due to reduction in the quantity of Portland cement for concrete production by some fractions of PBA and BN, cost-effective, ecofriendly and sustainable green concrete is derived with better mechanical and durability characteristics.
Disclosure statement
There are no recorded conflicts of interests in this research work.
Additional information
Notes on contributors
George Uwadiegwu Alaneme
George Uwadiegwu Alaneme is a postgraduate student of Michael Okpara University of Agriculture Umudike, he obtained his B.Eng. (2014) in Civil Engineering Department and M.Eng. (2021) in structural Engineering in same school, he has published several research papers in reputable journals with research interest on structural, geotechnical and highway pavement materials development.
Elvis Michael Mbadike
Elvis Michael Mbadike is an associate professor at Civil Engineering Department in Michael Okpara University of Agriculture Umudike, he obtained his B.Eng. (1997) and M.Eng. (2008) in Civil Engineering Department at Federal University of Technology Owerri and PhD (2013) in University of Nigeria Nsukka. He is a member of Council for the regulation of Engineers in Nigeria COREN and Nigerian Society of Engineers NSE. His research interests in on structural materials.
References
- Aggarwal, P., Y. Aggarwal, R. Siddique, S. Gupta, and H. Garg. 2013a. “Fuzzy Logic Modeling of Compressive Strength of High-strength Concrete (HSC) with Supplementary Cementitious Material.” Journal of Sustainable Cement-Based Materials, no. 2: 128–143. doi: https://doi.org/10.1080/21650373.2013.801800.
- Ahmad, S., S. Barbhuiya, A. Elahi, and J. Iqbal. 2011. “Effect of Pakistani Bentonite on Properties of Mortar and Concrete.” Clay Minerals 46 (1): 85–92. doi:https://doi.org/10.1180/claymin.2011.046.1.85.
- Akbar, J., B. Alam, M. Ashraf, S. Afzal, A. Ahmad, and K. Shahzada. 2013. “Evaluating the Effect of Bentonite on Strength and Durability of High Performance Concrete.” International Journal of Advanced Structures and Geotechnical Engineering 02 (1): 1–5.
- Akkurt, S., G. Tayfur, and S. Can. 2004. “Fuzzy Logic Model for Prediction of Cement Compressive Strength.” Cement and Concrete Research 34 (8): 1429–1433. doi:https://doi.org/10.1016/j.cemconres.2004.01.020.
- Alaneme, G. U., G. C. Ezeokpube, and E. M. Mbadike. 2020. “Failure Analysis of a Partially Collapsed Building Using Analytical Hierarchical Process.” J Fail. Anal. And Preven. doi:https://doi.org/10.1007/s11668-020-01040-3.
- Alaneme, G. U., K. C. Onyelowe, M. E. Onyia, D. Bui Van, E. M. Mbadike, C. N. Ezugwu, M. U. Dimonyeka, et al. 2020. “Modeling Volume Change Properties of Hydrated-Lime Activated Rice Husk Ash (HARHA) Modified Soft Soil for Construction Purposes by Artificial Neural Network (ANN).” Umudike Journal of Engineering and Technology 6 (1): 88–110.
- Aprianti, E. 2017. “A Huge Number of Artificial Waste Material Can Be Supplementary Cementitious Material (SCM) for Concrete production—A Review.” Journal of Cleaner Production 142: 4178–4194.
- Aryafar, A., R. Mikaeil, F. Doulati Ardejani, S. Shaffiee-Haghshenas, and A. Jafarpour. 2018. “Application of Non-linear Regression and Soft Computing Techniques for Modeling Process of Pollutant Adsorption from Industrial Wastewaters.” Journal of Mining and Environment. https://doi.org/10.22044/jme.2018.6511.1469
- ASTM C 618. 2008. Specification for coal fly ash and raw or calcined natural pozzolanas for use as mineral admixtures in Ordinary Portland Cement Concrete. Annual book of ASTM standards, West Conshecken, USA.
- Attah, I. C., R. K. Etim, and J. E. Sani. 2019. “Response of Oyster Shell Ash Blended Cement Concrete Iniv.” Environ Res 11 (4): 62–74 4.
- Baykasoglu, A., T. Dereli, and S. Tanis. 2004. “Prediction of Cement Strength Using Soft Computing Techniques.” Cement and Concrete Research 34 (11): 2083–2090.
- BS EN 12390–3 Part 3; 2002. - “Testing Hardened Concrete. Compressive Strength of Test Specimen.” British Standards Institute, London, United Kingdom.
- Chimmaobi O, E. M. Mbadike, and G. U. Alaneme GU. 2020. Experimental investigation of cassava peel ash in the production of concrete and mortar. Umudike J Eng Technol 6(2): 10–21.
- Das, S. K., and N. Sivakugan. 2010. “Discussion of “Intelligent Computing for modeling Axial Capacity of Pile foundations”Appears in Canadian Geotechnical Journal.” Canadian Geotechnical Journal 47 (8): 928–930.
- Demir, F. 2005. “A New Way of prediction Elastic Modulus of normal and high Strength Concrete—fuzzy Logic.” Cement and Concrete Research 35 (8): 1531–1538.https://doi.org/10.1016/j.cemconres.2005.01.001
- Elinwa, A. U., S. P. Ejeh, and I. O. Akpabio. 2005. “Using Metakaolin to Improve Sawdust Ash Concrete.” Journal of Cement and Concrete Composites 20: 10–12.
- Elinwa, A. U., and Y. A. Mahmood. 2002. “Ash from Timber Waste as Cement Replacement Material.” Cem Concr Compos 124 (2): 219–222. doi:https://doi.org/10.1016/S0958-9465(01)00039-7.
- Ettu, L. O., M. S. W. Mbajiorgu, F. C. Njoku, J. I. Arimanwa, and A. P. C. Amanze. 2013. “Prospect of Nigerian Agricultural by-Products Ashes for Blended Cement Making.” International Journal of Civil Engineering Research and Application (IJCERA) 1 (4): 1–9.
- Hyndman, R. J., and A. B. Koehler. 2006. “Another Look at Measures of Forecast Accuracy.” International Journal of Forecasting 22 (4): 679 688. CiteSeerX 10.1.1.154.9771. doihttps://doi.org/10.1016/j.ijforecast.2006.03.001.
- Kim, S., and K. Heeyoung. 2016. “A New Metric of Absolute Percentage Error for Intermittent Demand Forecasts.” International Journal of Forecasting 32 (3): 669 679. doi:https://doi.org/10.1016/j.ijforecast.2015.12.003.
- Klir, G. J., and B. Yuan. 2001. Fuzzy Sets and Fuzzy Logic: Theory and Applications. Englewood Cliffs, N. J., U.S.A.: Prentice Hall, .
- Madadi, A., M. Tasdighi, and H. Eskandari-Naddaf. 2019. “Structural Response of Ferrocement Panels Incorporating Lightweight Expanded Clay and Perlite Aggregates: Experimental.” Theoretical and Statistical Analysis.” Engineering Structures 188 (2019): 382–393. doi:https://doi.org/10.1016/j.engstruct.2019.03.038.
- Mamdani, E. H. 1975. “Fuzzy Logic Control of Aggregate Production Planning.” S. Assilian. International Journal of Man– Machine StudieS 1975 (7): 1–13.
- Mazer, W. M., and D. L. Geimba. 2011. “Numerical Model Based on Fuzzy Logic for Predicting Penetration of Chloride Ions into the Reinforced Concrete Structures - First Estimates, In.” In XII DBMC 12th Int. Conf. Durab. Build. Mater. Compon, edited by V. P. De Freitas, H. Corvacho, and M. Lacasse. Edições, Porto: FEUP.
- Mbadike, E. M. 2010. “Effects of Palm Bunch Ash in the Production of Clay Bricks.” Journal of Engineering Science and Technology 5 (1): 120–131
- Naderpour, H., A. H. Rafiean, and P. Fakharian. 2018. “Compressive Strength Prediction of Environmentally Friendly Concrete Using Artificial Neural Networks.” Journal of Building Engineering 16 (16): 213–219. doi:https://doi.org/10.1016/j.jobe.2018.01.007.
- Nasrollahzadeh, Y., and M. M. Basiri. 2014. “Prediction of Shear Strength of FRP Reinforced Concrete Beams Using Fuzzy Inference System.” Expert Systems with Applications 41 (2014): 1006–1020. http://dx.doi.org/10.1016/j.eswa.2013.07.045.
- Neville, A. M., and J. J. Brooks. 2002. Concrete Technology, 8–15, 18–34, 363–384. 2nd Edition ed. Delhi, India: Person Education .
- Onuamah, P. N. 2015. “Optimized Compressive Strength Modeling of Mixed Aggregate in Solid Sandcrete Production.” International Journal of Computational Engineering Research 5 (2): 39–52. February.
- Onyelowe, K. C., and A. O. Ubachukwu. 2015. “Palm Bunch Ash Stabilization of Olokoro Umuahia Lateritic Soil Using Palm Bunch Ash as Admixture.” Umudike Journal of Engineering Technology (UJET) 1 (2): 67–77.
- Prasad, B. K. R., H. Eskandari, and B. V. Venkatarama Reddy. 2009. “Prediction of Compressive Strength of SCC and HPC with High Volume Fly Ash Using ANN.” Construction and Building Materials 23 (1): 117–128. doi:https://doi.org/10.1016/j.conbuildmat.2008.01.014.
- Rencher, A. C., and W. F. Christensen. 2012. “Chapter 10, Multivariate regression—Section 10.1, Introduction.” In Methods of Multivariate Analysis, Wiley Series in Probability and Statistics, 3rd ed ed., 709. New York: Wiley. ISBN 9781118391679.
- Reza, K. R., Sayyed, M. H., Noorollah, M. 2018. A Fuzzy Inference System in Constructional Engineering Projects to Evaluate the Design Codes for RC Buildings. Civil Engineering Journal 4(9) September, 2018: 2155–2172.
- Ritter, A., and R. Muñoz-Carpena. 2013. “Performance Evaluation of Hydrological Models: Statistical Significance for Reducing Subjectivity in Goodness-of-fit Assessments.” Journal of Hydrology 480 (1): 33–45. doi:https://doi.org/10.1016/j.jhydrol.2012.12.004.
- Snellings, R., G. Mertens, and J. Elsen. 2012. “Supplementary Cementitious Materials.” Reviews in Mineralogy and Geochemistry 74 (1): 211–278. doi:https://doi.org/10.2138/rmg.2012.74.6.
- Topcu, I. B., and M. Sarıdemir. 2008. “Prediction of Mechanical Properties of Recycled Aggregate Concretes Containing Silica Fume Using Artificial Neural Networks and Fuzzy Logic.” Computational Materials Science 42 (1): 74–82. doi:https://doi.org/10.1016/j.commatsci.2007.06.011.
- Werner, O. R. 1994. “Use of Natural Pozzolans in Concrete.” ACI Materials Journal, Report of ACI Committee 232 91 (4): 410–426.
- Yilmaz, I., and G. Yuksek. 2009. “Prediction of the Strength and Elasticity Modulus of Gypsum Using Multiple Regression, ANN, and ANFIS Models.” International Journal of Rock Mechanics and Mining Sciences 46 (4): 803–810. doi:https://doi.org/10.1016/j.ijrmms.2008.09.002.
- Zadeh, L. 1992. Fuzzy Logic for the Management of Uncertainty, Eds. J. Kacprzyk. New York: Wiley.