
 ?Mathematical formulae have been encoded as MathML and are displayed in this HTML version using MathJax in order to improve their display. Uncheck the box to turn MathJax off. This feature requires Javascript. Click on a formula to zoom.
ABSTRACT
Globalisation and competition in the market have made industry practitioners to focus towards minimising resource consumption and even government is making strict regulations towards sustainable development. In this regard, usage of latest technologies such as Additive Manufacturing (AM) will have a positive benefit towards sustainability. AM processes are becoming sustainable from viewpoint of less material consumption, lesser operational cost, minimum handling and so on. So, it is important to analyse the potential drivers of sustainable AM process for its smooth adoption. In this regard, the purpose of the article is to present a study on prioritising drivers of Sustainable Additive Manufacturing (SAM) using Best Worst Method (BWM). Forty drivers are being analysed from eight perspectives. Data have been collected from experts and BWM has been used for analysing the drivers. The drivers are analysed in respective categories and then global score for each driver has been computed to find the overall weightage and rating of each driver. Key drivers are identified as eco design, green innovation and energy conservation. The practical and managerial implications are being highlighted.
1. Introduction
Additive manufacturing (AM) is the process of fabricating a part or a component by adding material in a layer-by-layer manner. AM is also called as layered manufacturing. AM has the ability to fabricate complex structures with lesser time and good material properties (Rejeski, Zhao, and Huang Citation2018). In the recent days, AM processes are expected to be sustainable (Chen et al. Citation2015; Laverne et al. (Citation2019). Sustainable AM (SAM) has advantages from economy point of view, consumes less material which leads to reduction in operational cost (Ullah et al. Citation2013; Weller, Kleer, and Piller Citation2015). It also reduces energy consumption and emissions resulting in sustainable benefits (Yang and Li Citation2018). AM reduces greenhouse emissions by 27–58% (Kreiger and Pearce Citation2013). It brings customised parts which are less likely to dispose by consumers. It brings freedom in design, so that customised complex parts can be made easily within shortest possible time (Ford and Despeisse Citation2016). There are several business benefits in implementing SAM such as, it increases sales by meeting social and environmental expectations better than competitors, it reduces waste thereby increasing productivity and it enhances reputation of the firm, employee morale and better community relations. It consumes approximately 90% lesser material as compared to conventional manufacturing (Mehrpouya et al. Citation2019). Assessing sustainability of technologies is very essential nowadays to identify and select best sustainable technology among all available technologies which have potential to reduce environmental impact and is economically feasible and provide benefits to society (Jiang et al. Citation2019). In order to facilitate effective implementation of SAM, drivers need to be analysed. In this regard, this study aimed at analysing the drivers of SAM using multi criteria decision-making (MCDM) based best worst method (BWM) method. It has several advantages over other MCDM methods like, small group pairwise comparison, and more consistent (Ahmadi, Kusi-Sarpong, and Rezaei Citation2017).
The research questions addressed in the present study are:
What are the various drivers influencing SAM?
How to formulate the approach of analysing SAM drivers as multiple criteria decision-making problem?
How to arrive at the priority order of SAM drivers using Best Worst Method (BWM)?
In this viewpoint, this article analyses the drivers of SAM from eight perspectives namely, Materials, Management and stake holders, Customer/ Supplier/ Competitor¸ Collaboration and trends, Technology, Standards and regulations, Design and Process. BWM is used in the present analysis. Based on the study, key drivers are found and the practical inferences are presented.
2. Literature review
SCOPUS database was chosen to collect relevant articles in the field of AM with sustainable domains. Several articles have been collected from SCOPUS database and important articles have been shortlisted based on abstract reading. The shortlisted articles have been reviewed thoroughly. The review is presented in the subsequent two subsections:
2.1 Review on studies of drivers of green/sustainable manufacturing
Bey, Hauschild, and McAloone (Citation2013) did a systematic detailed international survey with reference to product development and manufacturing firms. The study recognised vital drivers for deploying product life cycle-based environmental strategies and also indicated the barriers and obstacles to be dealt with. With reference to the study, various suggestions for manufacturing firms as well for policy makers to deal with effective deployment of strategic environmental goals in manufacturing firms. The vital barriers include lack of information on environmental impact, lack of expert knowledge, and lack of allocated resources. Also, the vital drivers both for inducement and sustenance deployment include legislative demands, customer demands and expected competitive advantage. Garg, Luthra, and Haleem (Citation2014) made an attempt to recognise and assess drivers in deploying Sustainable Manufacturing (SM) in Indian scenario. Nine drivers for effective deployment were identified from literature review. Decision Making Trial and Evaluation Laboratory (DEMATEL) was applied to assess and group the drivers into cause and effect categories. Among the drivers, five belong to cause group and four belong to effect group. From the findings, ‘societal pressure & public concern’ was found the most critical driver, whereas ‘corporate image & benefits’ was found least critical driver. It was mentioned that the developed model would help the practitioners in setting priorities of these drivers towards effective deployment of SM in Indian firms. Also, it was indicated that the implications would enable researchers to effectively understand issues pertaining to SM. Mittal and Sangwan (Citation2014) mentioned that green manufacturing implementation in industries would facilitate overcoming environmental issues like climate change and global warming. They mentioned that green manufacturing deployment was bounded with many challenges. The study ends with ranking the motivating factors using fuzzy TOPSIS based on environmental, economical and social perspectives. Green manufacturing implementation could be done with collaborative effort of government and industries in a strategic manner. There exists a need to recognise the scope of various drivers enabling green manufacturing implementation in industries. The examination of green manufacturing drivers and their prioritisation was done based on triple bottom line dimensions.
Nordin, Ashari, and Hassan (Citation2014) aimed to examine the drivers and barriers of SM deployment in Malaysian scenario. Data collection was done through questionnaire being self-administered. They found that increment in overall implementation cost as vital barrier for deploying SM practices; whereas environmental regulation and top management commitment were the key drivers. Based on the study, the prioritised barriers and drivers could help industries for enhancing manufacturing practices with minimal negative impact to environment. Also, it was mentioned that key focus to be assigned to motivating and hindering factors to improve successful deployment. Ghazilla et al. (Citation2015) mentioned that the drivers and barriers of deploying green manufacturing practices in SMEs were different from that of large enterprises as SMEs lack data, resources, experience to implement green initiatives. It was mentioned that as SMEs contribute a significant role in nation’s economic growth, it is vital to recognise the drivers and barriers which motivate and hinder the deployment of green manufacturing practices in SMEs. The study reported basic findings of the drivers and barriers relevant to SMEs in deploying green practices in Malaysian context. Delphi-based survey approach was applied to explore, recognise and validate the drivers and barriers of green manufacturing from expert opinion. It was indicated that the study would expedite the deployment of green manufacturing practices in Malaysian SMEs. It was mentioned that during further stages, detailed views from relevant stakeholders would be obtained from green manufacturing practices deployment. Govindan, Diabat, and Shankar (Citation2015) examined the need for recognising 12 mutual drivers of green manufacturing through literature review, industrial managers and expert opinion views. They administered the questionnaire among 120 leading firms in southern India and obtained pairwise comparison among those drivers. They further analysed the pairwise comparison data using fuzzy Multi Criteria Decision Making (MCDM) method. The results generated were further analysed using two stage approach: applying various defuzzification methods and assigning different weights to the top prioritised drivers. From the results, compliance with regulations was found to be the most essential driver, stakeholders and customers form the second and third essential drivers of green manufacturing. The results were in coincidence with literature observation. It was also mentioned that the study could analyse the barriers that hinder the adoption of green practices in SMEs as well in house hold firms.
Shankar, Kumar, and Kannan (Citation2016) analysed the drivers of advanced SM through a framework that was being proposed and further validated using a case study. The goal was to investigate the need for inclusion of sustainable strategies into advanced manufacturing system. They collected widely referred drivers from literature, validated through expert opinion, and further analysed using MCDM tool, AHP. Based on the study, quality ranked first followed by financial benefit; market capabilities were found to be the least driver of advanced SM. Manufacturing professions can synthesise the top rank driver and further adopt to deploy advanced SM. Aboelmaged (Citation2018) examined the impact of technological, organisational and environmental drivers on SM practices and further the influence of them on competitive capabilities. The model was validated using partial least square structural equation modelling approach in line with data gathered from Egyptian SMEs. The key results imply that environmental pressure from stake holders, management support and employees engagement influence positively SM practices. The research was divided into two major streams: SM research stream pertaining to sustainable and green manufacturing and the second stream was connected with vital sustainability issues indirectly connected with SM. The model was empirically validated based on data from 238 owners and managers belonging to various Egyptian SMEs. It was mentioned that from a managerial viewpoint, the research provides policy makers and managers a reference framework to enhance SM practices in the viewpoint of SMEs. Moktadir et al. (Citation2018) attempted to deploy SM practices as a segment of green supply chain initiatives about leather industries in Bangladesh. The main focus of the study was to evaluate, prioritise and rank the drivers of SM practices. Grey theory and matrix approach were applied to analyse the drivers. The results depicted that knowledge of circular economy was vital to deploy SM practices in leather industries in Bangladesh. The study assisted managers to appropriately formulate strategies for optimum resource utilisation as well for waste reduction in the perspective of circular economy. Sustainable manufacturing was integrated with industry 4.0 technologies such as AM to enhance the performance of manufacturing firm (Machado, Winroth, and Ribeiro da Silva Citation2020). Sustainable manufacturing strategies were recognised and prioritised by Ocampo et al. (Citation2020) for smooth adoption of SM practices in manufacturing sector.
Based on the literature it is found that many researches have been conducted on drivers analysis in terms of sustainable manufacturing. Various drivers identified are legislative demands, customer demands, expected competitive advantage (Bey, Hauschild, and McAloone Citation2013), societal pressure & public concern (Garg, Luthra, and Haleem Citation2014), environmental regulation and top management commitment (Nordin, Ashari, and Hassan Citation2014), and compliance with regulations (Govindan, Diabat, and Shankar Citation2015).
2.2 Review on studies of drivers of Additive Manufacturing/ sustainable AM
Agrawal and Vinodh (Citation2019) developed a structural model in line with TISM approach to analyse the factors influencing SAM. They considered 20 factors based on literature analysis, gathered expert opinion and further developed the structural model. They indicated various benefits of AM from sustainability perspective namely: lesser material consumption, scope for redesign, generation of light weight structures. With reference to the developed model, the dominant factors were identified which could help the practitioners for evolving long-term plan for improving sustainability of AM technologies, further MICMAC approach was done and ten factors were found to be dependent and ten factors belong to driving group respectively. Niaki, Torabi, and Nonino (Citation2019) mentioned the reasons for adoption of AM in various industrial sector which depicted potential advantages in terms of sustainability orientation. The study aimed to recognise and prioritise the determinants of its implementation as well to clarify the need of sustainability benefits. The study deployed a two round survey to enable empirical results into present viewpoint of AM deployment from practitioners viewpoint. Based on the analysis of first round survey, it indicated economic benefits were the primary reason whereas societal and environmental benefits were least drivers. An analysis of second round survey indicated the capability of AM for manufacture of complex parts, enabling customisation and inculcating creativity and innovation were the vital drivers for AM adoption.
From the literature study, it can be found that very few studies are available pertaining to additive manufacturing analysis. Hence, there exist a need to analyse drivers of SAM to strengthen the theories of SAM.
2.3 Research gaps
With reference to literature analysis, it has been found that there are reasonable number of studies on analysis of SM drivers and limited studies with regard to AM drivers. In line with the technological changes to move towards SAM with the focus on developing products with minimal environmental impact through the generation of light weight structure, lattice geometries, near net shape parts manufacturing and end used parts fabrication directly, SAM is found to be more significant. In order to facilitate the deployment of SAM, the analysis of drivers is vital. In this context, the present study illustrates an attempt to analyse the drivers of SAM using MCDM approach. In order to facilitate small group pairwise comparison and to derive consistent result, BWM is used as solution methodology for analysis of SAM drivers.
3. Methodology
The goal of this study is to prioritise the drivers of SAM. MCDM is an appropriate method to analyse the drivers and identify the prominent drivers (Ahmadi, Kusi-Sarpong, and Rezaei Citation2017). In this study, Best Worst Method (BWM) is used for prioritisation of SAM drivers. The methodological flowchart for prioritising SAM drivers is presented in .
Figure 1. Methodological steps
3.1 Best Worst Method (BWM)
BWM has been used in this study to analyse the drivers of SAM. The reason for selecting the methodology is that, it has several advantages over other MCDM methods like, small group pairwise comparison is analysed in this method whereas full pairwise comparison matrix in other MCDM method. Secondly, the result associated with it is more consistent compared to other MCDM approaches (Ahmadi, Kusi-Sarpong, and Rezaei Citation2017). Third it involves comparison of best criteria with other criteria and comparison of other criteria with worst criteria, thereby elimination of secondary comparison matrix which are required in other MCDM methods (Shojaei, Haeri, and Mohammadi Citation2018). It is already being used in various areas for analysis. shows the previous studies on BWM.
Table 1. Previous studies on BWM application in Sustainability domain
The steps of BWM (Rezaei et al. Citation2016) are presented below:
Step 1: First step is to identify criteria for decision making from literature review or from survey.
Step 2: Second step is to analyse the criteria and recognise the best criteria and worst criteria. The best criteria signify the most vital and desirable criteria whereas the worst criteria signify the least important and least desirable criteria. This identification of best and worst criteria can be done with the help of experts or decision makers
Step 3: Third step is to benchmark the best criteria with other criteria. A rating of 1 to 9 need to be given for comparison where 1 signifies equal importance and 9 signifies extreme importance with respect to best criteria. This is called as comparison of Best–to-Others (BO)
It is represented as vector = (
)
Where indicates the comparison of identified best criteria B over other criteria j.
Step 4: Fourth step is to benchmark other criteria with worst criteria. A rating of 1 to 9 need to be given for comparison where 1 signifies equal importance and 9 signifies extreme importance with respect to worst criteria. This is called as comparison of Others–to-Worst (OW)
It is represented as vector = (
)T
Where implies the comparison of other criteria j over identified worst criteria W.
Step 5: In this step, optimal weight of each criterion (W1*, W2* … … Wn*) need to be evaluated.
For each pair ratio of WB/Wj and Wj/Ww, the optimum weight of criteria should satisfy the below mentioned condition:
=
and
=
Therefore, to identify the optimum weight of criteria, maximum absolute difference of and
for all criteria j to be minimised. The problem can be represented in mathematical form as:
Subjected to:
Hence Equationequation 1(1)
(1) can be rewritten as:
Subjected to:
By solving Equationequation 2(2)
(2) , the optimum weights of each criteria (W1*, W2* … … Wn*) are obtained and ξ. ξ is used for evaluating consistency ratio. Lower value of ξ signifies higher consistency level.
The consistency ratio of the BWM can be evaluated using Equationequation 3(3)
(3) .
Value of consistency index is taken from (Rezaei Citation2015).
Table 2. Consistency index (CI)
4. Case study
The goal of the present study is to identify the prominent drivers of SAM and to prioritise those drivers. BWM has been used in the present study to analyse the drivers. From SCOPUS database, articles were collected to identify drivers of SAM. Further, the identified drivers were consulted with experts. Based on the consultation with experts, 40 prominent drivers of SAM have been shortlisted. The shortlisted drivers have been grouped into eight different categories namely: Materials, Management and stake holders, Customer/ Supplier/ Competitor¸ Collaboration and trends, Technology, Standards and regulations, Design and Process. The identified drivers are depicted in .
Table 3. Drivers of sustainable additive manufacturing
After identifying the drivers of SAM, next step is to collect data from experts. Four experts have been selected for collecting data. The experts are having high competence in the field of sustainability and AM with more than 10 years of field experience.
Their responses have been collected through email. First the experts were requested to recognise the best driver and worst driver in all categories. Then experts were requested to benchmark best driver to all other drivers to generate vector BO. Similarly, experts were asked to compare other drivers with worst driver to generate vector OW.
All input data collected are presented in Appendix section.
Sample data collection for one category of drivers is presented in and .
Table 4. Best and worst driver specified by expert 1–4 for material category
Table 5. Comparison of Best driver with other drivers (BO) by expert 1–4 for material category
Table 6. Comparison of other driver with worst drivers (OW) by expert 1–4 for material category
After collecting input data from experts, the weights of each driver have been computed using Equationequations 1(1)
(1) and Equation2
(2)
(2) as presented in methodology section. To evaluate the weights of each drivers, average of all expert weights has been taken. shows the weights of sample drivers of material category calculated using BWM. The consistency ratio also has been calculated using Equationequation 3
(3)
(3) (Rezaei et al. Citation2016).
Table 7. Weights of driver along with consistency for material category
Table 8(b). Weights of drivers along with consistency for material category
Table 8(c). Weights of drivers along with consistency for management and stake holders category
Table 8(d). Weights of drivers along with consistency for customer/ supplier/ competitor category
Table 8(e). Weights of drivers along with consistency for collaboration and trends category
Table 8(f). Weights of drivers along with consistency for technology category
Table 8(g). Weights of drivers along with consistency for standards and regulations category
Table 8(h). Weights of drivers along with consistency for design category
Table 8(i). Weights of drivers along with consistency for process category
5. Results and discussions
In the present study, 40 drivers of SAM have been considered from literature review. A MCDM based BWM approach has been systematically applied to analyse the drivers of SAM. First, the drivers have been grouped in eight categories and weights of drivers in individual categories are calculated. Then weights of categories are also calculated by applying the same procedure. Then finally the individual weight of drivers is multiplied with their respective category weight to get the global weight of each driver. The weights and ranking of driver in each category are shown in −8(i).
Table 8(a). Weights of Categories along with consistency
The global weight of each driver and the priority ranking are presented in .
Table 9. Prioritised ranking of drivers of Sustainable Additive Manufacturing
From the analysis, it is found that ‘Technology’ is the most important category among all eight categories. Followed by ‘Design’, ‘Process’, ‘Material’, ‘Collaboration and Trends’, ‘Standards and Regulations’, ‘Customer/ Supplier/ Competitor’, and ‘Management and Stake Holders’. Manufacturing sector generates heavy environmental waste and consumes more resources which is a point of concern for industries, researchers and everyone. Technology is the most important factor associated with waste generation and resource consumption. Proper focus needs to be given to technology domain to reduce environmental impact and making process more sustainable.
In technology category, ‘Green innovation’ driver ranked first followed by ‘Energy conservation’, ‘Technology competence’, ‘Technology adaptability’, ‘Time to develop new product’, and ‘Effective visual control’. In earlier days, innovation happens by considering only technology, but nowadays industries are more prone towards sustainable development and innovation also called as green innovation.
In Design category, ‘Eco design’ ranked first followed by ‘Light weight parts’, ‘Flexibility in producing geometry’ and ‘Ease of producing complex structure’. Industries and practitioners are focusing more on design aspects of product development so as to make eco design parts by reducing unnecessary wastage, and material consumption. With the help of AM technology, complex structure can be made easily.
In Process category, ‘On demand manufacturing’ ranked first followed by ‘Enables mass customisation’, ‘No specialised tooling required’, ‘Time saving’, ‘Cost saving’, and ‘Quality’. AM technology has ability to fabricate part on demand. With AM technology, it became easy to provide replacement parts at remote locations also in less time.
Under Material category, ‘Optimum resources utilisation’ driver ranked first followed by ‘Reusing and recycling materials and packaging’, and ‘Less material wastage’. Optimum utilisation of resources is the key factor of AM technologies. AM has advantage of fabricating the parts in different orientations so as to minimise material consumption.
In Collaboration and Trends category, ‘Economic benefit’ driver ranked first followed by ‘Collaboration between organisations’, ‘Collaborative decision making’, ‘Long-term survival in market’, and ‘Market trends’. The implementation of sustainable practices along with AM technologies in manufacturing sector will lead to enhance system capabilities followed by providing economic benefits with minimal resource consumption.
Under Standards and Regulations, ‘Environmental conservation’ driver ranked first followed by ‘Compliance with regulations’, ‘Emissions & global climate’, ‘Safety & security’, and ‘Operational safety’. Day by day depletion of natural resources is a major issue and is very much important for environmental conservation. It is the main driving force for implementing SAM practices.
Under Customer/ Supplier/ Competitor category, ‘Customers’ expectations’ driver ranked first followed by ‘Competitor pressure towards greening’, ‘Company image’, ‘Public pressure’, ‘Supplier commitment’, and ‘Supply chain pressure’. Nowadays, customers are demanding ecofriendly and sustainable products. They are more concerned about environmental issues, which needs manufacturing firm to implement SM practices in AM technologies.
Under Management and Stake Holders category, ‘Employee commitment towards sustainability’ ranked first followed by ‘Management support’, ‘Proper training and education’, ‘Stake holder participation’, and ‘Incentives’. Full-fledge involvement of employee is very much important in successful implementation of SAM processes.
From , it can be seen that Eco design, Green innovation, Energy conservation, Optimum resource utilisation, and Light weight parts are the top five global drivers among all collected 40 drivers with global weight of 0.0779, 0.0710, 0.0549, 0.0542 and 0.0526 respectively. Eco-design concept is the most important driver as it leads to optimised material and energy consumption (Peng et al. Citation2018).
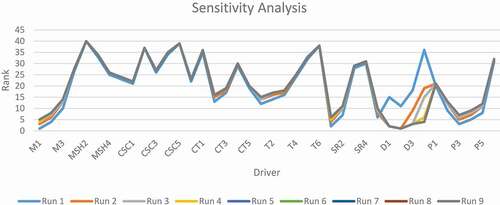
5.1 Sensitivity analysis
Sensitivity analysis is done for checking the biasness of the result and to check the impact of highest weightage driver on other drivers. Sensitivity analysis is done by variation of weights of all driver criteria in amount to variation in highest weightage driver criteria. Appendix shows the variation of driver criteria weights corresponds to change in highest weightage driver criteria i.e, Design with weight 0.1847. By varying the weight of design criteria from 0.1 to 0.9, other driver criteria weights are identified as represented in Appendix . Appendix shows the ranking of drivers based on the modified weights from . It can be observed from and Appendix , that driver ‘Eco design (D2)’ got top rank in sensitivity analysis almost all the time by varying weights of design criteria from 0.1 to 0.9. Similarly, driver ‘Incentives (MSH2)’ ranked last in all time in sensitivity analysis. Hence, it can be concluded from the sensitivity analysis that the findings achieved from BWM are free from any bias and are found to be stable.
Table 10. Benchmarking key results with previous studies
Figure 2. Drivers ranking by varying weights of criteria
5.2 Benchmarking key results with previous studies
The key results from previous studies is presented in .
6. Practical and managerial implications
The study facilitated industry practitioners to understand the significance and benefits of SAM towards the generation of light weight products with design freedom as well with lesser environmental impact. Also, there exist greater challenge to arrive at simplified product assemblies, enhanced product functionality with enhanced resource efficiency towards enhancement in operational efficiency with scope for remanufacturing and recycling. In this context, to successfully implement SAM, its key drivers to be analysed. In this viewpoint, this paper illustrates the analysis of drivers of SAM and the practitioners could focus on the prioritised drivers for enabling performance improvement. The study could facilitate managers for understanding the significance and motivation of SAM adaptation which will contribute towards deployment of SAM. The prioritisation of drivers would enable the deployment of relevant technologies and facilitate the identification of appropriate performance measures. The prioritised drivers would enable comprehensive understanding and assistance to industry practitioners on effective planning of strategies of SAM. The analysis and prioritisation of drivers would enable practicing managers to mitigate challenges in terms of sustainable design, restricted speed of AM, higher technology costs, compliance with standards and regulations. In a nutshell, the study would contribute towards setting a roadmap for researchers and practicing engineers to reinforce knowledge on SAM for feasible adoption in manufacturing domain for operational excellence.
7. Conclusions
AM processes are sustainable as there exist scope for reduced emissions and minimal environmental impacts. With increase in competition, people are more focusing on environmental related issues. They are showing increased concern towards environmental impacts associated with product. Sustainability has become a key concern for the present scenario. AM is one of the key technologies which has ability to meet sustainability requirement. In this context, SAM has good potential. In line with this, analysis of drivers of SAM is vital and hence in the present study, 40 drivers of SAM are being analysed. Data have been collected from four experts. The selected experts have high competence and experience in the field of SAM. BWM is used because it ensures more consistent result as benchmarked with other MCDM approaches (Ahmadi, Kusi-Sarpong, and Rezaei Citation2017). The top three key drivers include Eco design, green innovation, and energy conservation. The prioritisation of drivers of SAM helps the practitioners and industrial experts to develop efficient strategic plan for deploying SAM to minimise environmental impact. The conduct of the study facilitated the systematic analysis of SAM drivers.
8. Limitations and future research
In the present case study, 40 drivers are being included. In further studies, additional drivers could be considered based on managerial and technological advancements in manufacturing. The derived priority order of drivers could be further validated with other MCDM methods in future. Based on the priority order of drivers, appropriate techniques to be focused for deployment of SAM practices. Also, in future more expert opinion will be considered to enhance the accuracy and applicability of the result. In the future, aspects such as achievable component quality as well as the improved component function for SAM could be analysed.
Additional information
Notes on contributors
Rohit Agrawal
Rohit Agrawal is a Research Scholar in The Department of Production Engineering, National Institute of Technology, Tiruchirappalli, Tamil Nadu, India. He did his M.Tech. in Industrial Engineering and Management from the Department of Production Engineering, National Institute of Technology, Tiruchirappalli, Tamilnadu, India. He completed his B.Tech. in Mechanical Engineering from Bhilai Institute of Technology, Durg, India. He has published various articles in reputed journals and international conference proceedings. He has skills and expertise of Multi-Criteria Decision Making, Fuzzy Theory, and Grey Theory. His areas of research are sustainability manufacturing, circular economy, additive manufacturing, Industry 4.0, and sustainable supply chain management.
S Vinodh
S.Vinodh is an Associate Professor in Production Engineering Department of National Institute of Technology, Tiruchirappalli, Tamil Nadu. He completed his Ph.D. from PSG College of Technology, Coimbatore, India. He completed his Master’s degree in Production Engineering from PSG College of Technology, Coimbatore, India and Bachelor’s degree in Mechanical Engineering from Government College of Technology, Coimbatore, India. He was a top ranker in his undergraduate and post graduate studies. He has been awarded National Doctoral Fellowship for pursuing research by AICTE, New Delhi. He has been awarded Outstanding Paper Award by Emerald publishers, UK for the year 2009 and 2018. He is the recipient of Institution of Engineers Young Engineer Award for the year 2013-14. He has published over 100 papers in International Journals. His research interests include Lean Production and Sustainable Manufacturing, Agile Manufacturing, Rapid Manufacturing, Product Development and Industry 4.0.
References
- Aboelmaged, M. 2018. “The Drivers of Sustainable Manufacturing Practices in Egyptian SMEs and Their Impact on Competitive Capabilities: A PLS-SEM Model.” Journal of Cleaner Production 175: 207–221. doi:https://doi.org/10.1016/j.jclepro.2017.12.053.
- Ageron, B., A. Gunasekaran, and A. Spalanzani. 2012. “Sustainable Supply Management: An Empirical Study.” International Journal of Production Economics 140 (1): 168–182. doi:https://doi.org/10.1016/j.ijpe.2011.04.007.
- Agrawal, R., and S. Vinodh. 2019. “Application of Total Interpretive Structural Modelling (TISM) for Analysis of Factors Influencing Sustainable Additive Manufacturing: A Case Study.” Rapid Prototyping Journal 25 (7): 1198–1223. doi:https://doi.org/10.1108/RPJ-06-2018-0152.
- Ahmad, W. N. K. W., J. Rezaei, S. Sadaghiani, and L. A. Tavasszy. 2017. “Evaluation of the External Forces Affecting the Sustainability of Oil and Gas Supply Chain Using Best Worst Method.” Journal of Cleaner Production 153: 242–252. doi:https://doi.org/10.1016/j.jclepro.2017.03.166.
- Ahmadi, H. B., S. Kusi-Sarpong, and J. Rezaei. 2017. “Assessing the Social Sustainability of Supply Chains Using Best Worst Method.” Resources, Conservation and Recycling 126: 99–106. doi:https://doi.org/10.1016/j.resconrec.2017.07.020.
- Attaran, M. 2017. “The Rise of 3-D Printing: The Advantages of Additive Manufacturing over Traditional Manufacturing.” Business Horizons 60 (5): 677–688. doi:https://doi.org/10.1016/j.bushor.2017.05.011.
- Bey, N., M. Z. Hauschild, and T. C. McAloone. 2013. “Drivers and Barriers for Implementation of Environmental Strategies in Manufacturing Companies.” CIRP Annals 62 (1): 43–46. doi:https://doi.org/10.1016/j.cirp.2013.03.001.
- Chen, D., S. Heyer, S. Ibbotson, K. Salonitis, J. G. Steingrímsson, and S. Thiede. 2015. “Direct Digital Manufacturing: Definition, Evolution, and Sustainability Implications.” Journal of Cleaner Production 107: 615–625. doi:https://doi.org/10.1016/j.jclepro.2015.05.009.
- Ford, S., and M. Despeisse. 2016. “Additive Manufacturing and Sustainability: An Exploratory Study of the Advantages and Challenges.” Journal of Cleaner Production 137: 1573–1587. doi:https://doi.org/10.1016/j.jclepro.2016.04.150.
- Garg, D., S. Luthra, and A. Haleem. 2014. “An Evaluation of Drivers in Implementing Sustainable Manufacturing in India: Using DEMATEL Approach.” International Journal of Social, Behavioral, Educational, Economic, Business and Industrial Engineering 8 (12): 3517–3522.
- Ghazilla, R. A. R., N. Sakundarini, S. H. Abdul-Rashid, N. S. Ayub, E. U. Olugu, and S. N. Musa. 2015. “Drivers and Barriers Analysis for Green Manufacturing Practices in Malaysian SMEs: A Preliminary Findings.” Procedia Cirp 26: 658–663. doi:https://doi.org/10.1016/j.procir.2015.02.085.
- Govindan, K., A. Diabat, and K. M. Shankar. 2015. “Analyzing the Drivers of Green Manufacturing with Fuzzy Approach.” Journal of Cleaner Production 96: 182–193. doi:https://doi.org/10.1016/j.jclepro.2014.02.054.
- Jiang, Q., Z. Liu, T. Li, W. Cong, and H. C. Zhang. 2019. “Emergy-based Life-cycle Assessment (Em-lca) for Sustainability Assessment: A Case Study of Laser Additive Manufacturing versus CNC Machining.” The International Journal of Advanced Manufacturing Technology 102 (9–12): 4109–4120. doi:https://doi.org/10.1007/s00170-019-03486-8.
- Khorram Niaki, M., and F. Nonino. 2017. “Impact of Additive Manufacturing on Business Competitiveness: A Multiple Case Study.” Journal of Manufacturing Technology Management 28 (1): 56–74. doi:https://doi.org/10.1108/JMTM-01-2016-0001.
- Kreiger, M., and J. M. Pearce. 2013. “Environmental Life Cycle Analysis of Distributed Three-dimensional Printing and Conventional Manufacturing of Polymer Products.” ACS Sustainable Chemistry & Engineering 1 (12): 1511–1519. doi:https://doi.org/10.1021/sc400093k.
- Laverne, F., R. Marquardt, F. Segonds, I. Koutiri, and N. Perry. 2019. “Improving Resources Consumption of Additive Manufacturing Use during Early Design Stages: A Case Study.” International Journal of Sustainable Engineering 12 (6): 365–375. doi:https://doi.org/10.1080/19397038.2019.1620897.
- Machado, C. G., M. P. Winroth, and E. H. D. Ribeiro da Silva. 2020. “Sustainable Manufacturing in Industry 4.0: An Emerging Research Agenda.” International Journal of Production Research 58 (5): 1462–1484. doi:https://doi.org/10.1080/00207543.2019.1652777.
- Malek, J., and T. N. Desai. 2019. “Prioritization of Sustainable Manufacturing Barriers Using Best Worst Method.” Journal of Cleaner Production 226: 589–600. doi:https://doi.org/10.1016/j.jclepro.2019.04.056.
- Mani, M., K. W. Lyons, and S. K. Gupta. 2014. “Sustainability Characterization for Additive Manufacturing.” Journal of Research of the National Institute of Standards and Technology 119: 419–428. doi:https://doi.org/10.6028/jres.119.016.
- Mehrpouya, M., A. Dehghanghadikolaei, B. Fotovvati, A. Vosooghnia, S. S. Emamian, and A. Gisario. 2019. “The Potential of Additive Manufacturing in the Smart Factory Industrial 4.0: A Review.” Applied Sciences 9 (18): 3865. doi:https://doi.org/10.3390/app9183865.
- Mittal, V. K., and K. S. Sangwan. 2014. “Prioritizing Drivers for Green Manufacturing: Environmental, Social and Economic Perspectives.” Procedia CIRP 15: 135–140. doi:https://doi.org/10.1016/j.procir.2014.06.038.
- Moktadir, M. A., T. Rahman, M. H. Rahman, S. M. Ali, and S. K. Paul. 2018. “Drivers to Sustainable Manufacturing Practices and Circular Economy: A Perspective of Leather Industries in Bangladesh.” Journal of Cleaner Production 174: 1366–1380. doi:https://doi.org/10.1016/j.jclepro.2017.11.063.
- Niaki, M. K., S. A. Torabi, and F. Nonino. 2019. “Why Manufacturers Adopt Additive Manufacturing Technologies: The Role of Sustainability.” Journal of Cleaner Production 222: 381–392. doi:https://doi.org/10.1016/j.jclepro.2019.03.019.
- Nordin, N., H. Ashari, and M. G. Hassan 2014. “Drivers and Barriers in Sustainable Manufacturing Implementation in Malaysian Manufacturing Firms.” In 2014 IEEE International Conference on Industrial Engineering and Engineering Management. 687–691, Selangor, Malaysia, IEEE. (DOI: https://doi.org/10.1109/IEEM.2014.7058726)
- Ocampo, L. A., E. E. Clark, A. S. Chiu, and R. R. Tan. 2020. “Modelling a Decision-making Network for Sustainable Manufacturing Strategy.” Progress in Industrial Ecology, an International Journal 14 (1): 58–88. doi:https://doi.org/10.1504/PIE.2020.105197.
- Peng, T., K. Kellens, R. Tang, C. Chen, and G. Chen. 2018. “Sustainability of Additive Manufacturing: An Overview on Its Energy Demand and Environmental Impact.” Additive Manufacturing 21: 694–704. doi:https://doi.org/10.1016/j.addma.2018.04.022.
- Rahimifard, S., G. Coates, T. Staikos, C. Edwards, and M. Abu-Bakar. 2009. “Barriers, Drivers and Challenges for Sustainable Product Recovery and Recycling.” International Journal of Sustainable Engineering 2 (2): 80–90. doi:https://doi.org/10.1080/19397030903019766.
- Raymond, L. 2005. “Operations Management and Advanced Manufacturing Technologies in SMEs: A Contingency Approach.” Journal of Manufacturing Technology Management 16 (8): 936–955. doi:https://doi.org/10.1108/17410380510627898.
- Rejeski, D., F. Zhao, and Y. Huang. 2018. “Research Needs and Recommendations on Environmental Implications of Additive Manufacturing.” Additive Manufacturing 19: 21–28. doi:https://doi.org/10.1016/j.addma.2017.10.019.
- Rezaei, J. 2015. “Best-worst Multi-criteria Decision-making Method.” Omega 53: 49–57. doi:https://doi.org/10.1016/j.omega.2014.11.009.
- Rezaei, J., T. Nispeling, J. Sarkis, and L. Tavasszy. 2016. “A Supplier Selection Life Cycle Approach Integrating Traditional and Environmental Criteria Using the Best Worst Method.” Journal of Cleaner Production 135: 577–588. doi:https://doi.org/10.1016/j.jclepro.2016.06.125.
- Searcy, C., O. Morali, S. Karapetrovic, K. Wichuk, D. McCartney, S. McLeod, and D. Fraser. 2012. “Challenges in Implementing a Functional ISO 14001 Environmental Management System.” International Journal of Quality & Reliability Management 29 (7): 779–796. doi:https://doi.org/10.1108/02656711211258526.
- Shankar, K. M., P. U. Kumar, and D. Kannan. 2016. “Analyzing the Drivers of Advanced Sustainable Manufacturing System Using AHP Approach.” Sustainability 8 (8): 824. doi:https://doi.org/10.3390/su8080824.
- Shojaei, P., S. A. S. Haeri, and S. Mohammadi. 2018. “Airports Evaluation and Ranking Model Using Taguchi Loss Function, Best-worst Method and VIKOR Technique.” Journal of Air Transport Management 68: 4–13. doi:https://doi.org/10.1016/j.jairtraman.2017.05.006.
- Siemieniuch, C. E., M. A. Sinclair, and M. D. Henshaw. 2015. “Global Drivers, Sustainable Manufacturing and Systems Ergonomics.” Applied Ergonomics 51: 104–119. doi:https://doi.org/10.1016/j.apergo.2015.04.018.
- Ullah, A. S., H. Hashimoto, A. Kubo, and J. I. Tamaki. 2013. “Sustainability Analysis of Rapid Prototyping: Material/resource and Process Perspectives.” International Journal of Sustainable Manufacturing 3 (1): 20–36. doi:https://doi.org/10.1504/IJSM.2013.058640.
- Vinodh, S. 2011. “Assessment of Sustainability Using Multi-grade Fuzzy Approach.” Clean Technologies and Environmental Policy 13 (3): 509–515. doi:https://doi.org/10.1007/s10098-010-0333-1.
- Vinodh, S., K. Ramesh, and C. S. Arun. 2016. “Application of Interpretive Structural Modelling for Analysing the Factors Influencing Integrated Lean Sustainable System.” Clean Technologies and Environmental Policy 18 (2): 413–428. doi:https://doi.org/10.1007/s10098-015-1025-7.
- Wang, S. H., S.-P. Chang, P. Williams, B. Koo, and Y.-R. Qu. 2015. “Using Balanced Scorecard for Sustainable Design-centered Manufacturing.” Procedia Manufacturing 1: 181–192. doi:https://doi.org/10.1016/j.promfg.2015.09.084.
- Weller, C., R. Kleer, and F. T. Piller. 2015. “Economic Implications of 3D Printing: Market Structure Models in Light of Additive Manufacturing Revisited.” International Journal of Production Economics 164: 43–56. doi:https://doi.org/10.1016/j.ijpe.2015.02.020.
- Yang, Y., and L. Li. 2018. “Total Volatile Organic Compound Emission Evaluation and Control for Stereolithography Additive Manufacturing Process.” Journal of Cleaner Production 170: 1268–1278. doi:https://doi.org/10.1016/j.jclepro.2017.09.193.
- Zhao, H., S. Guo, and H. Zhao. 2018. “Comprehensive Benefit Evaluation of Eco-industrial Parks by Employing the Best-worst Method Based on Circular Economy and Sustainability.” Environment, Development and Sustainability 20 (3): 1229–1253. doi:https://doi.org/10.1007/s10668-017-9936-6.
Appendix
Table A1 (a). Best and worst category specified by expert 1–4
Table A1 (b). Comparison of best category with other categories (BO) by expert 1–4
Table A1 (c). Comparison of other categories with worst category (OW) by expert 1–4
Table A2 (a). Best and worst driver specified by expert 1–4 for material category
Table A2 (b). Comparison of best driver with other drivers (BO) by expert 1–4 for material category
Table A2 (c). Comparison of other drivers with worst driver (OW) by expert 1–4 for material category
Table A3 (a). Best and worst driver specified by expert 1–4 for Management and stake holders category
Table A3 (b). Comparison of best driver with other drivers (BO) by expert 1–4 for management and stake holders category
Table A3 (c). Comparison of other drivers with worst driver (OW) by expert 1–4 for management and stake holders category
Table A4 (a). Best and worst driver specified by expert 1–4 for customer/ supplier/ competitor category
Table A4 (b). Comparison of best driver with other drivers (BO) by expert 1–4 for customer/ supplier/ competitor category
Table A4 (c). Comparison of other drivers with worst driver (OW) by expert 1–4 for customer/ supplier/ competitor category
Table A5 (a). Best and worst driver specified by expert 1–4 for collaboration and trends category
Table A5 (b). Comparison of best driver with other drivers (BO) by expert 1–4 for collaboration and trends category
Table A5 (c). Comparison of other drivers with worst driver (OW) by expert 1–4 for collaboration and trends category
Table A6 (a). Best and worst driver specified by expert 1–4 for technology category
Table A6 (b). Comparison of best driver with other drivers (BO) by expert 1–4 for technology category
Table A6 (c). Comparison of other drivers with worst driver (OW) by expert 1–4 for technology category
Table A7 (a). Best and worst driver specified by expert 1–4 for standards and regulations category
Table A7 (b). Comparison of best driver with other drivers (BO) by expert 1–4 for standards and regulations category
Table A7 (c). Comparison of other drivers with worst driver (OW) by expert 1–4 for standards and regulations category
Table A8 (a). Best and worst driver specified by expert 1–4 for design category
Table A8 (b). Comparison of best driver with other drivers (BO) by expert 1–4 for design category
Table A8 (c). Comparison of other drivers with worst driver (OW) by expert 1–4 for design category
Table A9 (a). Best and worst driver specified by expert 1–4 for process category
Table A9 (b). Comparison of bbest driver with other drivers (BO) by expert 1–4 for process category
Table A9 (c). Comparison of other drivers with worst driver (OW) by expert 1–4 for process category
Table A10. Weights of driver criteria for sensitivity analysis
Table A11. Ranking of drivers for sensitivity analysis for different weights