
 ?Mathematical formulae have been encoded as MathML and are displayed in this HTML version using MathJax in order to improve their display. Uncheck the box to turn MathJax off. This feature requires Javascript. Click on a formula to zoom.
ABSTRACT
This paper presents prospective of using solar energy resources to produce hydrogen for feeding hydrogen vehicles at a refuelling station in South Africa. Solar energy sources from Vredendal, located in the Western Cape Province of South Africa, were used for the study. Assessment was performed for a refuelling station having capacity to meet the hydrogen needs of 25, 50 and 100 number of vehicles per day. The results showed that the annual daily average solar irradiation on the horizontal surfaces and optimally tilted surfaces were 5.77 kWh/m2 and 5.933 kWh/m2, respectively. The solar power required to meet the hydrogen production demand for each of the three refuelling number of vehicles were determined to be 2.24, 4.24 and 8.95 MW, respectively. The cost of energy from the solar PV system as well as the cost of hydrogen production at the refuelling station for each of the three hydrogen vehicle capacities was calculated as (0.24, 0.239 and 0.237) $/kWh and (16.52, 15.95 and 15.67) $/kg, respectively. The PV system would displace 387, 774 and 1548 tons of coal per annum for each of the capacity, respectively. This will result in the avoidance of 780, 1560 and 3120 tons/yr of CO2, respectively.
Introduction
The South African road transport sector depends heavily on imported crude oil from other countries. It was reported that about 60% of fossil fuel domestic requirements in the country are met by imported crude oil, with petrol and diesel the major liquid fuels that are used in South Africa (Asapia Citation2020). Currently, about 38% of the total greenhouse gas emission in the country come from the transportation sector as depicted in (Department-of-Energy Citation2015). This represents one-third of the total emissions in the country. Substituting fossil fuels with hydrogen especially when produced from renewable energy resources could help cut down on the use of fossil fuel in the transport sector which could lead to savings of revenue as well as the environment.
Figure 1. GHG emission by sector in South Africa
Indigenous research in recent years revealed that South Africa has abundant renewable energy resources that could support hydrogen production (Ayodele et al. Citation2011, Citation2012, Citation2014; Ayodele and Munda Citation2019). Hydrogen is an energy carrier that could substitute fossil fuels in vehicles. This is because hydrogen has a lightweight which readily supports onboard transportation and it is environmentally friendly with high efficiency (Menanteau et al. Citation2011). It is the most abundantly available element in the universe and can be produced from varieties of sources (Sharma and Ghoshal Citation2015; Maleki, Khajeh, and Rosen Citation2017). Moreover, it has physical and chemical properties that comparably match that of fossil fuel (Balat Citation2008) making it useful in spark-ignition engines without much modification to the engine (Dutta Citation2014). In addition, the specific energy mass of hydrogen is higher compared to other fuels, for example, 1 kg of hydrogen is equivalent to 2.63 kg of gasoline in energy content (Sharma and Ghoshal Citation2015). Hence, the use of hydrogen as an alternative will play a major role in the transportation sector in South Africa.
There is growing interest in hydrogen fuel cell technologies in South Africa in recent years as demonstrated in the activities of the Department of Science and Technology (DST) through its Hydrogen South Africa (HySA) Program. In 2016, the DST/HySA in partnership with Impala refining services and the University of the Western Cape unveiled a hydrogen fuel cell forklift and refuelling station in Gauteng (Mjwara Citation2019). The government is also looking at the possibility of partnering with Plug Power Incorporation, a company that develops hydrogen fuel cell systems and substitute with the conventional batteries in equipment and vehicles powered by electricity (Mjwara Citation2019). Hydrogen Fuel Cell Vehicle (HFCV) requires that the tank be filled with hydrogen which is then supplied to the fuel cell to power the engine. This requires hydrogen refuelling stations along the major roads just like the petrol/diesel refuelling stations. As of now, there are about 800 hydrogen refuelling stations around the world that are economically viable and it is expected that by the year 2025, the number would have increased to about 2180 stations (Fraser Citation2020). The main challenge of hydrogen refuelling stations is that electrical energy is required to obtain pure hydrogen either by electrolysis or through the steam reforming process. Although steam reforming technique uses less energy, a major drawback is the production of pollutants. On the other hand, hydrogen production via water electrolysis does not create any pollution but requires a considerable amount of electricity to decompose water into oxygen and hydrogen gas. As demand for HFCV increases, more refuelling stations would be needed and this could affect electricity distribution grids. One of the ways to arrest this challenge is the use of renewable energy resources to meet the energy demands of hydrogen production for dispensing at the refuelling stations.
Solar energy has been considered one of the sustainable ways of generating electricity for hydrogen production and can be conducted in two ways: (i) through water electrolysis using solar Photovoltaic (PV-electrolysis) and (ii) through direct solar water splitting (i.e. Photo-electrochemical) (Haider, Sajid, and Iqbal Citation2020). The photo-electrochemical method uses light to directly split water into hydrogen and oxygen, it offers great potential for cost-effectiveness for electrolytic hydrogen production (Halabi Citation2011). However, the method has a low efficiency of about 0.5% (Holladay et al. Citation2009). On the other hand, the PV water electrolysis method requires that the electric current from PV be passed between two electrodes immersed in water thereby splitting the water into hydrogen and oxygen (Nikolaidis and Poullikkas Citation2017). This method is a matured technology with a high conversion efficiency of about 30% (Jia et al. Citation2016). Given these advantages, several authors have explored the use of the PV-electrolysis technique for hydrogen production in many parts of the world: Touili et al. (Touili et al. Citation2018) have conducted the techno-economic analysis of hydrogen production from solar energy for 76 sites in Morocco using PV-water electrolysis. The authors concluded that the daily annual hydrogen production varies between 6489 and 8308 tons/km2. It was also revealed that the cost of electricity and hydrogen production in the country were in the range of 0.077–0.099 $/kWh and 5.79–10.64 $/kg, respectively. In a different study, Haider et al. have used machine learning methods to forecast hydrogen production potential for the Islamabad region of Pakistan. The hydrogen production was through solar PV electrolysis of water. The authors concluded that the daily hydrogen production forecasting was about 93.3 × 10³ kg/km2 (Haider, Sajid, and Iqbal Citation2020). Sui et al. (Sui et al. Citation2020) proposed a novel concept of producing hydrogen using the hybrid of thermochemical and electrochemical techniques. The hybrid method utilised solar energy for hydrogen production. A portion of the solar wavelength suitable for PV conversion was used to derive water electrolysis for hydrogen production. The rest of the sunlight was assigned to thermal collectors and utilised for thermochemical hydrogen production. The result revealed that the arrangement had a solar-to-hydrogen efficiency of 56%. A decision support system has been utilised for the selection of locations with high hydrogen production based on the use of solar and wind energy sources by Dagdougui (Dagdougui, Ouammi, and Sacile Citation2011). In the study, four modules were considered: the evaluation of the wind and solar potentials, the analysis of the hydrogen potential, the development of a regional decision support module and modelling of a hybrid onsite hydrogen production system. The overall approach was applied to a specific case study in Liguria region, in the North of Italy. The viability of hydrogen production from the UK renewable energy resources was presented by Southall and Khare (Southall and A. Citation2016). In their work, the cost of hydrogen production using hybrid of wind turbine and solar PV system was determined. The authors also examined the willingness to pay for cleaner energy by the UK car owners.
Various authors have also considered hydrogen as a means of energy storage which could enhance the flexibility of integrating renewable energy resources into the national grid as well as a means of supporting mobile application such as fuel cell vehicles. For example, Albadi et al. (Albadi et al. Citation2020) have presented a review on energy storage options for the main interconnected system in Oman. One of the suggested options was hydrogen production from the renewable energy resources of Oman to enhance the integration of intermittent renewable energy resources into the national grid. The authors were of the opinion that hydrogen as energy storage could provide the needed flexibility for the national grid by storing the excess energy in the form of hydrogen during excess renewable energy resources and could also be used in mobile applications such as hydrogen fuel cell vehicles. Bhatia and Riddell (Bhatia and Riddell Citation2016) performed sensitivity analysis on the trade-off between vehicle range and CO2 emissions on various powertrains use in a small crossover sport utility vehicle. The study compared gasoline vehicles, gasoline-electric hybrid vehicles, diesel vehicles, fuel cell and battery electric vehicles (BEVs) in terms of vehicle performance, emissions and energy usage. The authors revealed that the hydrogen fuel cell vehicle was found preferable to BEVs under conditions of high CO2 emissions per kW-hr and a high vehicle range requirement. Yousef et al. (Yousef, Al-Badi, and Polycarpou Citation2017) presented a design of a power management tool capable of managing power flow from different renewable energy sources. In the design, the authors used PV and wind as the primary power sources for the system, and a fuel cell with electrolyser and batteries were used as a reserve. The authors showed that the excess power was used either to produce hydrogen through an electrolyser for the fuel cell or to store it in a battery. The simulation was carried out in MATLAB/Simulink environment. In another study, Al-Badi (Al-Badi Citation2012) conducted a techno-economic feasibility study of using a hybrid energy system with hydrogen fuel cell for application in an eco-house located Sultan Qaboos University, Muscat, Oman. It was found that the total annual electrical energy production was 42,255 kW and the cost of energy for this hybrid system was 0.582 $/kW. During daylight time, when the solar radiation was high, the photovoltaics (PV) panels supplied most of the load requirements. Moreover, during the evening time, the fuel cell mainly serves the house with the help of the batteries. The proposed system was capable of providing the required energy to the eco-house during the whole year using only solar irradiance as the primary source.
While many studies have been conducted on hydrogen production from different renewable energy sources around the world as presented in the aforementioned literature, little has been done in South Africa especially on the use of solar energy. Generally, hydrogen production from renewable energies is site-specific and therefore needs to be evaluated at every potential site. Moreover, there is a paucity of literature on hydrogen refuelling stations in Africa. It is generally believed that the energy demand in the process of hydrogen production is huge and could impact negatively on the already weak grid in many African countries. The objective of this study is therefore to (i) estimate the solar energy resources of South Africa for the purpose of hydrogen production, (ii) estimate the amount of harvestable hydrogen that could be produced from the solar energy resources of South Africa through the water electrolysis technique, (iii) determine the economic viability of solar-powered hydrogen refuelling station in South Africa, (iv) determine the amount of coal, carbon IV oxide as well as carbon-monoxide the hydrogen refuelling station will displace, (v) conduct sensitivity analysis to determine the effects of some variables on the cost of hydrogen production for South Africa. The objectives were achieved through a set of mathematical model and simulated in a Matlab environment.
2 Solar energy resources of South Africa
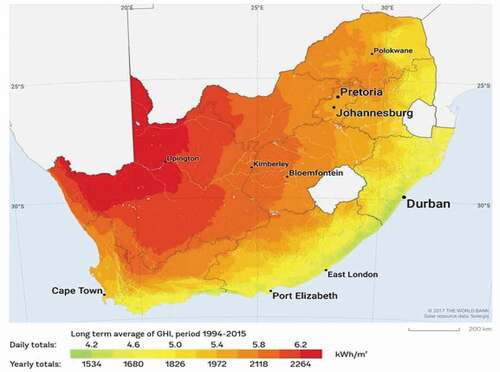
South Africa is one of the countries that experience a considerably high level of sunshine hours in the world with more than 2500 hours per year (Edkins, Marquard, and Winkler Citation2010). The average daily solar irradiation level in the country ranges between 4.5 and 6.5 kWh/m2 per day (Department-of-Mineral-and-Energy Citation2004) as depicted in . This is relatively higher compared to the solar irradiation experienced in many parts of the US and Europe with an average global solar irradiation of 3.6 and 2.5 kWh/m2 per day, respectively (Department-of-Energy Citation2018). This abundance of solar resources could be an advantage in the production of hydrogen at the refuelling stations to support the transportation sector in the country. This could give relief to the national grid as the capacity need for hydrogen refuelling stations increases in the country.
Figure 2. South Africa global solar irradiation
2.1 Data collection
The data used for the technical and economic analysis of the solar-PV-powered refuelling station was that of Vredendal located in the Western Cape Province of South Africa on latitude 31.67° S and longitude 18.50° E. The town is located at an altitude of 61 m above sea level with a population of about 14,806 (Saws Citation2020). The data consisted of daily average solar irradiation observed over a period of 1 year and was collected from South Africa Weather Services (SAWS) (Saws Citation2020). SAWS is a meteorological service controlled by the Department of Environmental Affairs and Tourism and is part of the members of the World Meteorological Organization. The data of the town was adopted for the study because it does not contain any missing data and was readily available for public use.
3. Modelling of PV system for hydrogen refuelling station
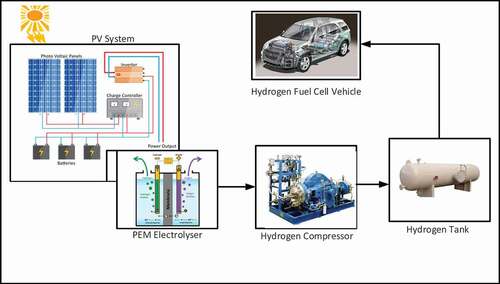
This section presents the energy requirement for hydrogen production as well as the mathematical models required for sizing a stand-alone PV system to meet the energy requirement of hydrogen production. The PV system comprises the PV modules, the storage battery, the battery charge controller and the inverter as depicted in .
Figure 3. Illustration of components making up PV powered hydrogen refuelling station
The economic analysis to determine the unit cost of energy from the PV system as well as the cost of hydrogen were estimated. The environmental assessments of using a PV system to power the refuelling station rather than using the national grid were also explored. Therefore, this paper proposes the use of vast solar energy resources available in South Africa to support hydrogen production for fuel cell vehicles. The government of South Africa is interested in the development of a hydrogen economy in the country. The main aim of the paper is to determine the available solar resources in the country and also to estimate the extent to which the resources can support hydrogen production in South Africa via the water electrolysis technique.
3.1 Refuelling station energy requirement for hydrogen production
In recent years, HFCVs are an evolving technology with a lot of potential. Commonly, HFCVs need about 5 kg of hydrogen to fill up their tank (Mclarty et al. Citation2020) and this is equivalent to 50 litres of standard petrol. This quantity of hydrogen would allow HFCVs to drive 300 miles (Edmunds Citation2020). Hydrogen refuelling stations are now being built across the world with the capacity ranging from 25 to 150 cars per day. Currently, the world’s largest hydrogen refuelling station operates in Hamburg Germany. It has a capacity for 150 cars corresponding to 750 kg of hydrogen per day(Mclarty et al. Citation2020).
In this paper, hydrogen is produced via water electrolysis using electricity from solar PV instead of the grid. The hydrogen refuelling system consists of the electrolyser, the compressor and the hydrogen tank for storing the compressed hydrogen. The technical parameter of the HySTAT hydrogen refuelling system (consisting of an electrolyser and compressor as a single unit) is used to model the solar power requirement for a hydrogen refuelling station for South Africa. The system is manufactured by HYDROGENICS, an advanced hydrogen solution (Hydrogenics Citation2020). HySTAT refuelling system requires 65 kWh of electrical energy for every 1 kg of hydrogen produced (this includes AC power consumption of both the electrolyser as well as the compressor) (Hydrogenics Citation2020; Mclarty et al. Citation2020). The system operates at 50 Hz and the hydrogen is stored at 450 bar. The technical specifications of the HySTAT hydrogen refuelling system are provided in .
Table 1. Technical parameter for HySTAT refuelling system [28]
In this paper, a solar power system is designed for three hydrogen stations with different refuelling capacity. The refuelling station will have the capacity to handle 25, 50 and 100 vehicles per day.
The electrical energy requirement by a refuelling station for hydrogen production per day can be estimated as:
Where is the electrical energy in Wh required by the refuelling station per day,
is the hydrogen required (kg) to fill up a vehicle (5 kg in this case),
is the electrical energy required to produce 1 kg of hydrogen and
is the number of vehicles to be serviced by the refuelling station per day.
3.2 Optimum tilt angle of solar panel
The solar irradiance reaching the surface of the panel is influenced by the angle of tilt of the panel (Ayodele and Ogunjuyigbe Citation2015; T.r, A.s.o, and Oladeji Citation2018). Therefore, to obtain the maximum possible electricity generation from a solar panel, the panel should be tilted to the optimum tilt angle with respect to the horizontal. The optimum tilt angle () can be determined as a rule of thumb as follows (Sino-Votaic Citation2020):
where is the latitude of the location in which the solar panel is deployed.
Generally, there are four distinct seasons in South Africa; the winter which spans over 3 months (June, July and August), the summer which consists of 5 months (November to March inclusive), the spring which spread over 2 months (September and October) and the autumn consisting of April and May only.
Therefore, the average global solar irradiation of the site on an optimally tilted surface (Wh/m2 per day) can be calculated as (Ayodele and Ognjuyigbe Citation2015a):
where is the optimum tilt angle as determined using (2) and
is the average observed global solar radiation in Wh/m2 per day on the site.
3.3. Determination of PV panels required for hydrogen production
The area needed by the PV panels in m2 based on estimated hydrogen load demand can be determined using:
where is total energy demand (Wh) to produce hydrogen for a refuelling station per day,
is the PV efficiency,
is the battery efficiency,
is the inverter efficiency,
is the temperature correction factor
Therefore, the daily amount of solar power in W required by the hydrogen refuelling station can be estimated as:
where is the solar radiation at standard test condition (1000 W/m2).
The number of modules that must be put together to generate the required amount of solar power needed by the hydrogen load can be estimated as:
where is the peak power of the selected PV module (W). The datasheets for the selected PV modules are provided in .
Table 2. Data sheet for the Selected PV Module
3.4 Modelling of battery requirement for backup
In order to cater for the intermittent nature of solar irradiance, storage technology is required. In this case, the battery is deployed as storage technology. The total storage capacity of the battery system in Ampere-hour (Ah) needed to cater for the daily hydrogen load demands of the refuelling station can be determined using:
where is the number of cloudy days the battery can cater for,
is a maximum permissible depth of discharge of the battery,
is the efficiency of the battery as specified by the manufacturer,
is the inverter efficiency and
is the system DC voltage which is usually in 12, 24, 48 V.
Therefore, the number of batteries required by the hydrogen refuelling station to cater for the intermittent nature of solar irradiation can be determined using:
where is the storage capacity of a single battery in (Ah) as specified by the manufacturer. The number of battery in a string can be determined as:
where is the rated voltage of a single battery.
The parameters used for the sizing of the battery are as depicted in
Table 3. Parameters used for the sizing of battery storage [38]
3.5 Modelling of charge controller and inverter of PV system
A battery charger is the interface controller between the solar modules and the batteries. It performs coordinated charging of a battery by limiting the rate at which current flows into or drawn from a battery. In this way, overcharging and undercharging of battery is prevented thereby improving the lifespan of the battery.
The size of the charge controller appropriate for the solar PV system can be modelled as follows:
The HySTAT hydrogen refuelling system consists of an electrolyser as well as a compressor that operate on an AC system at 50 Hz frequency (Mclarty et al. Citation2020), therefore an inverter is required. A solar PV inverter converts the variable direct current (DC) from the solar PV panels into alternating current (AC) which can be fed into commercial AC loads such as HySTAT or the utility grid. PV inverter is expected to be a pure sine wave inverter and should be able to handle the maximum AC load at any point in time. The wave-form of such an inverter is pure sinusoidal with a phase angle between voltage and current of 36.9°. Hence, the power factor () for the inverter is taken as 0.8.
Therefore, the required inverter power (rated in VA) can be calculated taken into consideration the factor of safety of 1.2 as follows (Olaofe and Folly Citation2012):
where (Wh) is the maximum energy required for hydrogen production per day,
is the power factor and t is the number of hours per day (24).
3.6. Economic assessment of PV systems for refuelling stations
In any project including solar PV, the cost analysis is important to give an idea of the viability of such a project. It is also useful from the investment point of view to determine if the project is worth financing. The economic assessment of the PV powered refuelling station is made in terms of life cycle cost as well as the unit cost of energy.
3.6.1 Life cycle cost of the PV system
The Life Cycle Cost (LCC) is one of the important financial indicators that determine the feasibility of a project. It is the estimation of total spending on an asset/equipment over its entire useful life. It covers all the costs from the time an asset is purchased to the time it is decommissioned, taking into consideration the interest and the inflation rates. These costs include: the capital cost of each of the component that makes up the PV system, installation cost, operating and maintenance cost (Nafeh Citation2009).
For a PV project, the LCC can be estimated as (Ayodele et al. Citation2014):
where is the capital cost of each of the component that makes up the PV project with a life cycle equal to the life cycle of the project. i.e. the capital cost of PV panel (
), the capital cost of an inverter (
) and the capital cost of charge controller (
). In this case, the life cycle of the project is taken as 20 years.
and
are the net present worth of the battery and that of the operation and maintenance. The battery cost, as well as the operation and maintenance cost, are evaluated in terms of net present worth value. This is because batteries must be replaced at a certain time over the lifetime of the project. Also, operation and maintenance are continuous over the lifetime of the project. Therefore, they are subjected to interest and inflation rates.
The capital cost of the PV, charge controller and inverter (,
and
) can be calculated as follows:
where ,
,
are the specific cost of the selected PV panel, charge controller and inverter
The installation cost is done once at the beginning of the project. Therefore, the installation cost can be estimated as:
where is the specific cost of installation.
In this paper, the replacement time of a deep cycle battery suitable for the PV project is taken as 5 years. The implication of this is that three different sets of batteries are required before the lifetime of the PV project expires. A lithium-ion battery is selected for the project because it has a deep depth of discharge of about 90% and can last for about 5 years, although it is fairly expensive compared to many solar batteries in the market (Chargex-Lithium-Ion-Batteries Citation2020). Hence, the present worth of battery () for the three groups over the lifetime of the project can be determined as follows:
where is the initial capital cost of the battery,
is the number of group of battery that is needed to be bought before the expiration of the lifetime of a project (in this case,
),
is the lifetime of each group of battery (i.e
and
years, respectively),
is the inflation rate,
is the interest rate.
The initial capital cost of the battery can be calculated as:
The present worth of operation and maintenance cost () can be determined using:
where is the initial operation and maintenance cost which is taken as 1% of the PV cost
3.6.2 Cost of electricity from solar PV
To determine the unit cost of energy from the PV system installed for powering the refuelling station, the life cycle cost should be annualised over the lifetime of the PV project. Therefore, the annualised Life Cycle Cost (ALCC) can be evaluated as follows:
The cost of PV electricity in $/kWh for hydrogen production can therefore be calculated as:
The specific costs of the components that make up the PV system as determined by the market survey are depicted in while the economic indices as applied to South Africa are presented in
Table 4. Specific Unit cost of a component of the PV system obtained through market survey
Table 5. Economic Indices as applied to South African System
3.6.3 Cost of electrolysis system for the hydrogen refuelling station
In order to determine the unit cost of hydrogen from the refuelling station, the cost of the electrolysis system that makes up the refuelling station must be determined. The life cycle cost of electrolysis system consists of the capital cost of the electrolyser and compressor as a single unit (HySTAT), the cost of stacks, the cost of power conditioning system, the cost of high-pressure tank as well as the cost of installation, planning and design of the entire electrolysis system. It also involves the cost of operation and maintenance of the electrolyser system over the entire lifetime of the electrolysis system
Therefore, the LCC for electrolysis system can be determined using:
where is the capital cost of electrolyser,
is the capital cost of the stack,
is the capital cost of the power condition unit (electronic),
is the cost of installation, planning and design,
is the cost of a high-pressure tank for hydrogen storage and
is the cost of operation and maintenance over the entire life of the electrolysis system.
The capital costs of electrolyser, stack, power conditioning unit and installation can be determined as follows:
Where is the specific cost of the electrolyser and
is the size of the electrolyser in kW. In this paper, 600 kW electrolyser was selected and it has a specific cost of 1076 $/kW (900€/kW) (Van-Leeuwen and Zauner Citation2018).
and
are the fractional cost component and are given as 50%, 10% and 30%, respectively (Van-Leeuwen and Zauner Citation2018).
The high-pressure tank is required to store the hydrogen produced at the refuelling station and it must be able to handle the daily hydrogen capacity of the refuelling station.
The cost of a high-pressure tank can be determined using:
where is the hydrogen required (kg) to fill up a vehicle,
is the number of vehicles to be serviced by the refuelling station per day and
is the specific cost per 1 kg of hydrogen production and is taken as 598$/kg (500 €/kg) (Van-Leeuwen and Zauner Citation2018).
The operation and maintenance cost of the electrolyser system can be determined as follows:
is the initial operation and maintenance cost and is taken as 5% of the capital cost (Ayodele and Ognjuyigbe Citation2015b).
3.6.4 Unit cost of hydrogen
The unit cost of hydrogen can be determined by annualising the life cycle cost of the electrolysis system and can be determined using:
The total hydrogen refuelling station annualised cost can therefore be written as:
Therefore, the cost of hydrogen can be calculated as follows:
where is the annualised cost of electrolysis system,
is the annualised cost of a solar PV system,
is the quantity of hydrogen (kg) to fill up a tank of HFC vehicle per day and
is the number of vehicle per day.
3.7. Environmental assessment of using PV over grid for hydrogen production
In this paper, it is assumed that the electricity generated from the PV displaces electrical energy that would have been used if the HySTAT is operated using the electricity from the national grid. About 93% of electricity generation in South Africa are from coal (Ayodele et al. Citation2012). Therefore, the annual amount of coal per year that would be avoided due to the use of a PV system for electricity generation instead of the grid can be estimated as:
Where is the amount of coal displaced per year in kg,
is the electricity required from the PV system per day in W,
is the lower heating value of coal in MJ/kg,
is the electricity generation efficiency of a coal-powered power plant and is taken as 38% (Defra Citation2013). It should be noted that the
in South African ranges between 14.8 MJ/kg and 21.5 MJ/kg (Zhou et al. Citation2009). Therefore, a value of 20 MJ/kg is assumed as the LHV of coal. The 3.6 is the value of a conversion from MJ/kg to kWh/kg and the value 365 is the number of days in a year
Therefore, the annual amount of carbon dioxide emission (kg) that would be generated if the displaced coal is used for electricity generation to meet the energy demand of the hydrogen refuelling station can be determined as; (Honghai et al. Citation2020)
where is the carbon content of coal. The coals used in South Africa have carbon content ranging from 40.3% to 57.2% (Zhou et al. Citation2009).
is the ratio of the atomic mass of CO2 to carbon which converts the weight of carbon into the equivalent of CO2.,
,
,
. In this paper, it is assumed that the carbon content of coal is 55%.
3.8. Project break-even point
The breakeven point of the PV project can be evaluated by taking into consideration the cost of the coals that would be avoided due to the PV system and the CO2 avoidance cost.
The cost of coal avoided due to the PV project per year ($) for electricity generation rather than the grid can be determined using:
where is the cost of coal per metric tons in South Africa and is taken as $65/t Coal (Index-Mundi Citation2020).
The annual CO2 avoidance cost ($) can be estimated as follows:
where is the CO2 emission avoided (kg) by substituting hydrogen gas for diesel fuel as determined in (28),
is the average price of carbon dioxide allowance and is given as $29.5/tCO2 (Krohn, Morthorst, and Awerbuch Citation2002).
The break-even point (year) can therefore be determined as:
4. Results and discussion
This section presents the results of global solar irradiation on a tilted surface, sizing of required components that make up the solar PV system to meet the hydrogen generation capacity of the refuelling station, the economic assessment of hydrogen production using the solar-powered system. Also, the environmental assessment of using solar PV for generating electricity for the refuelling station over the use of the grid is presented. Sensitivity analysis was conducted to see the influence of certain parameters on the cost of electricity generated by solar PV and hydrogen production.
4.1 Solar irradiation characteristics
The monthly mean daily average horizontal global solar irradiation of Vredendal, South Africa, was calculated from the data collected from the South Africa Weather Service (SAWS). In order to optimally extract the solar power from the panels, the solar panels were optimally tilted using the model presented in (2) and (3). The results of the monthly mean, as well as the annual mean daily average solar irradiation, are presented in .
Figure 4. Global solar irradiation at Vredendal, South Africa
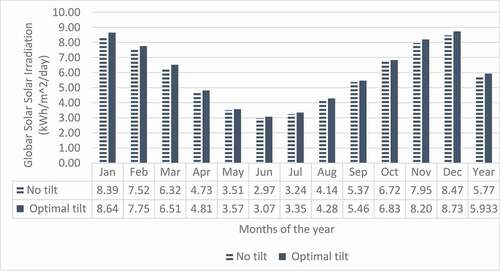
The figure revealed that the daily average global solar irradiation on the horizontal surface varies from 2.97 kWh/m2 in June to 8.47 kWh/m2 in December. Generally, it can be observed that June and July experience low solar irradiation. This is expected as these months depict the peak of the winter period in South Africa with lots of cloud cover. shows that the months in the summer season have an increase of 3.4% in the solar irradiance when panels are optimally tilted compared to when the panels are placed horizontally.
Figure 5. Increase in global solar radiation on a tilted surface
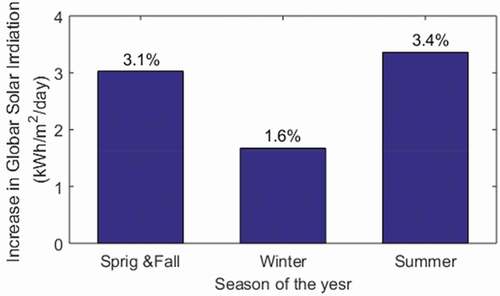
Similarly, the months in the spring and autumn seasons have a solar irradiation increase of 3.1% on a tilted surface while the months in the winter experience an increase of 1.6% on the tilted surface compared to the horizontal surface.
4.2 Solar PV system components sizing for the refuelling station
The components that make up the solar PV system (i.e. the PV panels, the battery bank, inverter, and battery charge controller) were technically sized to meet the energy demand of the different capacity (25, 50 and 100 vehicles) of the hydrogen refuelling station. The sizing was achieved using the annual mean daily average wind speed on a tilted surface (i.e. 5.93 kWh/m2). The results are presented in . The results show that the energy required to meet the energy demands of the refuelling station for hydrogen production is 8.13, 16.25 and 32.5 MWh, respectively, for each of the capacities. This requires the PV areas of 0.0014, 0.027 and 0.054 square kilometres for the 25, 50 and 100 vehicle capacity refuelling station. The PV output peak power required to meet the energy demands is 2.24, 4.48 and 8.95MWp, respectively. Battery banks are required to cater for the intermittency in solar irradiation. The battery banks were calculated to be 0.98, 1.97 and 3.93 M-Ah for each of the capacity of the refuelling stations, respectively. These battery banks will require 3278, 6556 and 13,113 numbers of 300Ah Lithium-ion batteries, respectively. The inverter size that will be required to meet the different capacities of the refuelling station was determined to be 10, 20 and 40 MVA, respectively.
Table 6. Energy requirement per day for hydrogen production and size of solar power system components for hydrogen refuelling station for South Africa
In order to determine the number of solar panels required to meet the peak power of the solar farm, different PVs (designated PV1, PV2 and PV3) with different watt-peak and efficiency are selected. The number of required PV panels for the 3 selected PVs that would supply the peak power of the solar farm to the refuelling station is presented in . The table shows that PV3 (PowerSync 500 W-96 M (Powersync-Energy-Solution Citation2020)) with an efficiency of 19.25% and peak power of 500 Wp will require the least number of PV panels. The area required by the PV is large; therefore, it is recommended that the refuelling station would best be sited close to shopping malls in South Africa. This is because malls in South Africa have large parking space in which the top of the space can be designed for use as a solar farm. In this way, the large area required and the large numbers of PV would be less of a burden.
Table 7. Number of solar panels for the hydrogen refuelling station
4.3 Economic assessment of solar powered hydrogen refuelling station
The economic viability in terms of total annualised life cycle cost (), cost of electricity from the solar PV farm as well as the cost of hydrogen produced at the refuelling station are presented in . The table shows that the calculated ALCC are 0.75, 1.45 and 2.86 million dollars for the 3 capacities of refuelling station considered in this study. The costs of electricity from the solar PV farm were estimated as 0.24, 0.239 and 0.237, respectively, with the cost of hydrogen of 16.52, 15.95 and 15.67. These values indicate that a larger capacity of refuelling station is more favourable in terms of the cost of hydrogen production compared to the smaller capacity although with higher ALCC.
Table 8. Annualised life cycle costs, cost of energy and cost of hydrogen for the refuelling station
Since solar irradiation varies month to month, it is expected that the cost of electricity from the solar PV will also vary which will affect the cost of hydrogen production. The cost of solar PV energy as it varies with the month of the year, as well as the cost of hydrogen production, are furnished in and , respectively. reveals that the cost of electricity from the PV farms varies from 0.2238 to 0.271 $/kWh. The month of June presents the most expensive cost of energy while December the least cost. This is expected since the least solar irradiation occurs in June and the month of December experiences the highest global solar irradiation. This translates into variation in the cost of hydrogen production as depicted in from 15.17 to 18.24 $/kg corresponding to December to June, respectively. Generally, the cost of hydrogen is lesser during the summer months. It is therefore expected that the cost selling price should be reduced in the summers.
Figure 6. Monthly variation in the cost of electricity from the PV system
Figure 7. Monthly variation in the cost of hydrogen energy
4.4 Environmental assessment
The environmental assessments, as well as the breakeven point of the project, were conducted. South Africa generates her electricity mainly from coal. Therefore, the environmental study was conducted based on the amount of coals and CO2 that would be avoided if the national grid were to be used to power the refuelling station. Going forward, the costs of the coal and CO2 displaced by the solar PV system were determined and used to calculate the break-even point of the entire project (i.e. refuelling station). The results are presented in . The table shows that the use of solar PV for powering the refuelling station could displace 387, 774 and 1548 tons of coal per annum. This translates to the avoidance of 780, 1560 and 3120 tons of CO2 per annum. This shows the environmental benefit of using a solar PV system over the use of a grid. The cost that would be saved by not using coal and the cost that would be avoided by not polluting the environment were calculated and the results are also furnished in . The breakeven point was determined from the cost of the coal and CO2 avoidance cost. The results in the table reveal that the breakeven points for the different capacity of the refuelling station are 10.23, 9.87 and 9.7 years indicating that large-scale refuelling stations have slightly lesser years to break even.
Table 9. Coal displaced, CO2 avoided and the break-even point of the refuelling station
4.5 Sensitivity analysis
Sensitivity analysis helps to understand how some values of the independent variable influence a particular dependent variable under certain assumptions. In this way, the effect of some variables can be studied on the overall performance of a given model. In this study, sensitivity analysis was conducted to understand how solar irradiance and the specific cost of PVs affect the cost of energy from PV as well as the cost of hydrogen production. Percentage change was used in all the analysis. This allows it to fit into any value thereby generalising the sensitivity assessment.
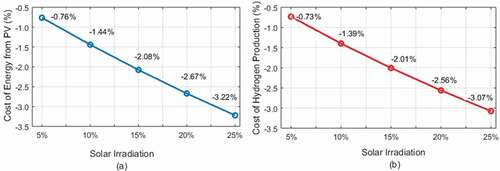
With the effect of climate change, solar irradiation is changing in every region of the world. It is therefore intuitive to believe that solar irradiation could change and this may impact the cost of energy from PV as well as the cost of hydrogen production. In this paper, the effects of change of 5% up to 25% (at a step of 5%) in the values of solar irradiation on the cost of energy as well as hydrogen were studied. The results are presented in . In the figure, a 5% increase in the value of solar irradiation would cause a decrease of 0.76% and 0.73%, respectively, in the cost of energy and hydrogen production. This seems insignificant, however, as the solar irradiation value increases, the percentage decrease in the cost of energy and hydrogen also increases.
Figure 8. Effect of increase in solar irradiation on the cost of (a) energy from the PV system, (b) hydrogen production
In another scenario, it was thought that there is a possibility of a decrease in the specific cost of solar panel in terms of $/Wp. Solar technology is improving and the players in the field are getting more experienced and matured with time. Therefore, the specific cost per watt is expected to decrease over time. In this paper, the percentage change in the cost of energy from the PV system and the hydrogen production were studied based on a certain percentage decrease in the specific cost of a solar panel. The results are presented in .
Figure 9. Impact of decrease in specific PV panel cost on the (a) cost of energy from PV system, (b) cost of hydrogen
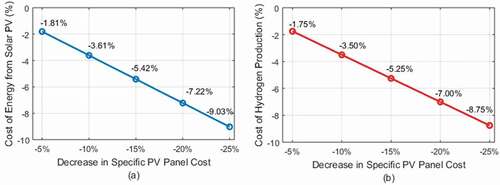
) and 9(b) generally reveal that the effect of change in the specific cost of a solar panel has more impact on the cost of energy as well as the cost of hydrogen production compared to the effect of solar irradiation. A 5% decrease in the specific cost of PV panel will reduce the cost of energy and hydrogen production by 1.81% and 1,75%, respectively. However, a decrease in the specific cost of PV panel by 25% will cause a 9.03% and 8.75% decrease in the cost of energy and hydrogen, respectively.
The impact of the specific cost of solar PV panels on the break-even point was also explored and the result is presented in . The figure shows that a decrease in the specific cost could have a significant impact on the break-even point of the project. A 5% to 25% decrease in the specific cost of the PV solar panels would cause a decrease of 1.6% to 8.7% in the break-even point. The significance of this is that as technology improves, the use of renewable energy such as solar energy for hydrogen production would be more promising and attractive.
Figure 10. The influence of specific PV cost of the break-even point of the refuelling station
The efficiency of a PV as a renewable energy source is generally lower compared to many other renewable energy generators. This can be attributed to the many internal losses in a photovoltaic panel which reduce its overall output efficiency. These losses include the reflection losses, insufficient or over the excitement of photons, recombination of the free charge carriers, high resistive components, etc. However, efforts are on top gear to reduce these losses through improved materials and better technology. The possible impact of solar panel efficiency on the required PV areas was explored and the result is presented in .
Figure 11. Effect of PV efficiency on the required PV area
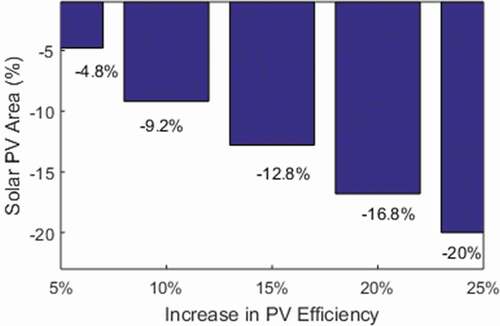
The figure shows that an increase in PV efficiency will generally reduce the PV area required. An increase in the efficiency of PV panels by 5% up to 25% will reduce the required PV area by 4.8% up to 20%, respectively. This shows that there is a linear inverse relationship between the efficiency and the PV area. Hence, as the efficiency improves, the issue of solar PV area would be of less concern.
Conclusion
The technical, economic as well as environmental assessment of solar-powered hydrogen refuelling station have been conducted for the South Africa transport sector. The global solar irradiation data of Vredendal, South Africa was used for the study. The following conclusions are made from the study:
The annual daily average global solar irradiation on the horizontal surfaces and optimally tilted surface were determined to be 5.77 kWh/m2 and 5.933 kWh/m2, respectively.
The highest and the lowest global solar irradiation are experienced in December and June, respectively, with a monthly daily average of 2.97 kWh/m2 and 8.47 kWh/m2, respectively.
The solar power required to meet the hydrogen production demand for the 25, 50 and 100 vehicle capacities was determined to be 2.24, 4.24 and 8.95 MW, respectively.
The PV area required for the solar farm was calculated to be 0.014, 0.027 and 0.054 km2.
These will require storage a bank capacity of 0.98, 1.97 and 3.93 M-Ah, respectively.
The cost of energy from the solar PV system and Hydrogen production for the 25, 50 and 100 capacity refuelling stations were calculated as (0.24, 0.239 and 0.237) $/kWh and (16.52, 15.95 and 15.67) $/kg, respectively.
The PV system would displace 387, 774 and 1548 tons of coal per annum, respectively.
This will result in avoidance of 780, 1560 and 3120 tons/yr of CO2
The break-even points for each of the refuelling capacities were estimated as 10.23, 9.87 and 9.7 years, respectively.
The authors are of the opinion that the refuelling stations are best sited close to the malls in South Africa. This is because malls in South Africa have a large area, a car park. These car parks can simultaneously be used as solar farms. In this way, the space for the solar farms would be less of a serious issue. In the future, the wind resources of South Africa would be explored for possible support for hydrogen refuelling station in the country. Also, a comparison between the on-site hydrogen refuelling stations and a single centralised off-site hydrogen refuelling station would be performed for South Africa and would be assessed in terms of technical, economic and transportation criteria
Disclosure statement
The authors declare that there is no competing interest regarding the publication of this manuscript
The data that support the findings of this study are available from the corresponding author upon reasonable request.
Correction Statement
This article has been republished with minor changes. These changes do not impact the academic content of the article.
Additional information
Notes on contributors
T.R Ayodele
T.R. Ayodele received his B.Eng in Electrical and Electronic Engineering from the Federal University of Technology, Akure (FUTA), Nigeria in 2000 and M.Eng in Electrical Power and Machine Engineering from the University of Benin, Nigeria in 2004. He obtained his Doctoral degree (Doctoris Technologiae) in 2012 from the Tshwane University of Technology, Pretoria, South Africa. He is a member of Power, Energy, Machine and Drive (PEMD) Research group at the Electrical and Electronic Engineering Department, University of Ibadan, Nigeria. He is currently a visiting researcher at the Department of Electrical Engineering, University of South Africa, Science Campus, Florida, Johannesburg. His research interests are in the renewable energy resources assessment, grid integration of renewable energy, Energy conversion and energy management.
A.A Yusuff
AA Yusuff received his B.Tech(Hons.) in Electronic and Electrical Engineering from Ladoke Akintola University of Technology, Ogbomoso (LAUTECH), Nigeria in 1997 and M.Sc in Electrical Engineering from University of Lagos, Akoka, Nigeria in 2002. He obtained his Doctoral degree (Doctoris Technologiae) in 2012 from the Tshwane University of Technology, Pretoria, South Africa. He is a member of Power, Energy, Network and Optimisation (PENO) Research group at the Electrical Engineering Department, University of South Africa. His research interests are in adaptive electric power transmission network; application of computational intelligence schemes for operation, control, and protection of advanced power grid; and integration of intermittent and renewable energy sources to power grid.
T.C Mosetlhe
T.C Mosetlhe received his Bachelors and Masters degrees from the Tshwane University of Technology in 2015 and 2017 respectively. He is currently enrolled for dual doctoral degree with Tshwane University of Technology and Université Paris-Saclay. He is currently a member of Power, Energy, Network and Optmisation (PENO) research group in the department of Electrical Engineering, University of South Africa. His research interests are in the modelling electrical power and water networks, micro-grid optimisation and fault analysis.
M. Ntombela
M. Ntombela received his BSc and MSc in Electrical Engineering from the University of Cape Town, Rondebosch, South Africa in 2003 and 2007 respectively. He obtained his MEng in Engineering Management from the University of Pretoria, Hatfield, South Africa in 2011. He is currently enrolled for a PhD in Engineering Education at the University of Cape Town looking at idealisation and modelling in engineering. He is currently a member of the Power, Energy, Network and Optimisation (PENO) research group at the Electrical Engineering Department, University of South Africa. His research interests are in renewable energy, microgrids, power system stability, and engineering education.
References
- Al-Badi, A. H. 2012. “Pre-feasibility Study of Stand-alone Hybrid Energy Systems for Applications in Eco-houses.” International Journal of Sustainable Engineering 6 (1): 48–54. doi:https://doi.org/10.1080/19397038.2012.677491.
- Albadi, M., A. Al-Badi, R. Ghorbani, A. Al-Hinai, and R. Al-Abri. 2020. “Enhancing Electricity Supply Mix in Oman with Energy Storage Systems: A Case Study.” International Journal of Sustainable Engineering 1–10. doi:https://doi.org/10.1080/19397038.2020.1773570.
- Asapia. 2020. South African Fuel Industry. South African Petroleum Industry Association, 1-3. Accessed 20th November 2020. https://www.sapia.org.za/Overview/South-African-fuel-industry
- Ayodele, T. R., A. A. Jimoh, J. L. Munda, and J. T. Agee 2011. Capacity Factor Estimation and Appropriate Wind Turbine Matching for Napier and Prince Albert in the Western Cape of South Africa. The 3rd International Renewable Energy Congress, Hammamet, Tunisia, 1–6.
- Ayodele, T. R., A. A. Jimoh, J. L. Munda, and J. T. Agee. 2012. “Wind Distribution and Capacity Factor Estimation for Wind Turbines in the Coastal Region of South Africa.” Energy Conversion and Management 64: 614–625. doi:https://doi.org/10.1016/j.enconman.2012.06.007.
- Ayodele, T. R., A. A. Jimoh, J. L. Munda, and J. T. Agee. 2014. “Viability and Economic Analysis of Wind Energy Resource for Power Generation in Johannesburg, South Africa.” International Journal of Sustainable Energy 33 (2): 284–303. doi:https://doi.org/10.1080/14786451.2012.762777.
- Ayodele, T. R., and A. S. O. Ognjuyigbe. 2015a. “Increasing Household Solar Energy Penetration through Load Partitioning Based on Quality of Life: The Case Study of Nigeria.” Sustainable Cities and Society 18: 21–31. doi:https://doi.org/10.1016/j.scs.2015.05.005.
- Ayodele, T. R., and A. S. O. Ognjuyigbe. 2015b. “Wind Energy Resource, Wind Energy Conversion System Modelling and Integration: A Survey.” International Journal of Sustainable Energy 34 (10): 657–671. doi:https://doi.org/10.1080/14786451.2013.855778.
- Ayodele, T. R., and A. S. O. Ogunjuyigbe. 2015. “Prediction of Monthly Average Global Solar Radiation Based on Statistical Distribution of Clearness Index.” Energy 90: 1733–1742. doi:https://doi.org/10.1016/j.energy.2015.06.137.
- Ayodele T. R, A. S. O. Ogunjuyigbe, and S. Oladeji. 2018. “Determination of Optimal Tilt Angles in Some Selected Cities of Nigeria for Maximum Extractable Solar Energy.” International Journal of Renewable Energy Technology 9 (4): 453–482. doi:https://doi.org/10.1504/IJRET.2018.095800.
- Ayodele, T. R., and J. L. Munda. 2019. “The Potential Role of Green Hydrogen Production in the South Africa Energy Mix.” Journal of Renewable and Sustainable Energy 11 (4): 1–22. doi:https://doi.org/10.1063/1.5089958.
- Balat, M. 2008. “Potential Importance of Hydrogen as a Future Solution to Environmental and Transportation Problems.” International Journal of Hydrog Energy 33: 4013–4029. doi:https://doi.org/10.1016/j.ijhydene.2008.05.047.
- Bhatia, K. K., and W. T. Riddell. 2016. “Identifying and Modeling Key Trade-offs between Hydrogen Fuel Cell and Electric Vehicles.” International Journal of Sustainable Engineering 9 (3): 1–8. doi:https://doi.org/10.1080/19397038.2015.1128494.
- Chargex-Lithium-Ion-Batteries. 2020. 12v 300ah Lithium Ion Battery. 1-5. Accessed 12th December, 2020 https://www.lithiumion-batteries.com/products/12-volt-lithium-batteries/12v-300ah-lithium-ion-battery-2.php.
- Dagdougui, H., A. Ouammi, and R. Sacile. 2011. “A Regional Decision Support System for Onsite Renewable Hydrogen Production from Solar and Wind Energy Sources.” International Journal of Hydrogen Energy 36 (22): 14324–14334. doi:https://doi.org/10.1016/j.ijhydene.2011.08.050.
- Defra. 2013. Incineration of Municipal Solid Waste. United kingdom (UK): Defra.
- Department-of-Energy. 2015. South Africa Energy Balances. 1-2. accessed 27th Oct 218. http://www.energy.gov.za/files/media/Energy_Balances.html.
- Department-of-Energy. 2018. Renewable Energy;solar Power. 1-2. accessed Nov 5th. http://www.energy.gov.za/files/esources/renewables/r_solar.html
- Department-of-Mineral-and-Energy. 2004. “White Paper on the Renewable Energy Policy of the Republic of South Africa.” Government Gazette 466 (26169): 1–60.
- Dursun, B., and C. Gokcol. 2012. “Economic Analysis of a Wind-battery Hybrid System: An Application for a House in Gebze, Turkey, with Moderate Wind Energy Potential.” Turk J Elec Eng & Comp Sci 20 (3): 319–333.
- Dutta, S. 2014. “A Review on Production, Storage of Hydrogen and Its Utilization as an Energy Resource.” Journal of Industrial and Engineering Chemistry 20 (4): 1148–1156. doi:https://doi.org/10.1016/j.jiec.2013.07.037.
- Edkins, M., A. Marquard, and H. Winkler 2010. Assessing the effectiveness of national solar and wind energy policies in South Africa: Final report. Energy Resource Center, University of Cape Town, 1–9.
- Edmunds. 2020. What You Need to Know about Hydrogen Fuel-cell Cars. 1-2. Access 25th Nove 2020. https://www.edmunds.com/fuel-economy/8-things-you-need-to-know-about-hydrogen-fuel-cell-cars.html.
- Energysage. 2020. Average Cost of Solar Panels Based on System Size. 1-2. access 25th November 2020. https://news.energysage.com/.
- Fraser, I. 2020. Hydrogen Filling Stations Set for South Africa. 1-2. accessed 18th November 2020. https://www.miningweekly.com/article/hydrogen-filling-stations-set-for-s-africa-2019-09-20.
- Haider, S. A., M. Sajid, and S. Iqbal. 2020. “Forecasting Hydrogen Production Potential in Islamabad from Solar Energy Using Water Electrolysis.” International Journal of Hydrogen Energy 1–12. In Press. doi: https://doi.org/10.1016/j.ijhydene.2020.10.059.
- Halabi, M. H. 2011. Sorption enhanced catalytic reforming of methane for pure hydrogen production: Experimental and modeling. PhD Thesis, Technische Universiteit Eindhoven, DOI: https://doi.org/10.6100/IR709035, 39, 1-213.
- Holladay, J. D., J. Hu, D. L. King, and Y. Wang. 2009. “An Overview of Hydrogen Production Technologies.” Catalysis Today 139: 244–260. doi:https://doi.org/10.1016/j.cattod.2008.08.039.
- Honghai, Y., W. Zhi, C. Li, and W. Jianan 2020. Co2 Emission Calculation and Emission Characteristics Analysis of Typical 600mw Coal-fired Thermal Power Unit. E3S Web of Conferences, 165: 1–4. DOI: https://doi.org/10.1051/e3sconf/202016501029
- Hydrogenics. 2020. Hydrogen Refuelling Stations. 1-6. Accessed 25th Nov 2020. www.hydrogenics.com.
- Index-Mundi. 2020. Coal, South African Export Price Monthly Price - Us Dollars per Metric Ton. 1-2. Accessed 6th Dec 2020. https://www.indexmundi.com/commodities/?commodity=coal-south-african&months=60.
- Jia, J., L. Seitz, J. Benck, Y. Huo, Y. Chen, J. W. Desmond-Ng, T. Bilir, J. S. Harris, and T. Jaramillo. 2016. “Solar Water Splitting by Photovoltaic Electrolysis with a Solar to Hydrogen Efficiency over 30%.” Nature Communications 7: 13237. doi:https://doi.org/10.1038/ncomms13237.
- Krohn, S., P. Morthorst, and S. Awerbuch. 2002. “The Economics of Wind Energy.” European Wind Energy Association 1–156.
- Maleki, A., M. G. Khajeh, and M. A. Rosen. 2017. “Two Heurostics Approaches for the Optimization of Grid-connected Hybrid Solar-hydrogen Systems to Supply Residential Thermal and Electrical Loads.” Sustainable Cities and Society 34: 278–292. doi:https://doi.org/10.1016/j.scs.2017.06.023.
- Mclarty, H., J. Vrba, A. Mcnally, N. Hili, L. Bloor, and F. Reid 2020. Hydrogen for Trasport. Solutions for Energy Storage, 1-7. access 25th Nov 2020. http://www.esru.strath.ac.uk/EandE/Web_sites/16-17/Hydrogen/index.html.
- Menanteau, P., M. M. Queme´Re, A. Leduigou, and S. Lebastard. 2011. “An Economic Analysis of the Production of Hydrogen from Wind-generated Electricity for Usei N Transport Applications.” Energy Policy 39: 2957–2965. doi:https://doi.org/10.1016/j.enpol.2011.03.005.
- Mjwara. 2019. “South Africa Builds on Hydrogen Fuel Cell Program.” MRS Bulletin (Joining of Dissimilar Lightweight Materials) 44 (8): 605.
- Nafeh, A. E. 2009. “Design and Economic Analysis of a Stand-alone Pv System to Electrify a Remote Area Household in Egypt.” The Open Renewable Energy Journal 2: 33–37. doi:https://doi.org/10.2174/1876387100902010033.
- Narale, P. D., N. S. Rathore, and S. Kothari. 2013. “Study of Solar Pv Water Pumping System for Irrigation of Horticulture Crops.” International Journal of Engineering Science Invention 2 (3): 54–60.
- Nikolaidis, P., and A. Poullikkas. 2017. “A Comparative Overview of Hydrogen Production Processes.” Renewable and Sustainable Energy Reviews 67: 597–611. doi:https://doi.org/10.1016/j.rser.2016.09.044.
- Olaofe, Z. O., and K. A. Folly. 2012. Potentials of a 5kw Wind Energy System with Integrated Storage Bank for Home Energy Management. International Conference on Power and Energy Systems (AfricaPES 2012), Botswana: IASTED, 102–109.
- Powersync-Energy-Solution. 2020. 500w 96 Cell Monocrystalline Solar Panel. 1-2. access 23rd November 2020. https://powersyncenergy.com/wp-content/uploads/2018/10/500-Watt-Monocrystalline-Module-Data-Sheet.pdf.
- Saws. 2020. South African Weather Services. Accessed 6th Nov 2020 https://www.weathersa.co.za/.
- Sharma, S., and S. Ghoshal. 2015. “Hydrogen the Future Transportation Fuel: From Production to Applications.” Renewable and Sustainable Energy Reviews 43: 1151–1158. doi:https://doi.org/10.1016/j.rser.2014.11.093.
- Sino-Votaic. 2020. Solar Panel Angle: How to Calculate Solar Panel Tilt Angle?. 1-2. Access 24th Nov 2020. https://sinovoltaics.com/learning-center/system-design/solar-panel-angle-tilt-calculation/.
- Solardesign-Tool. 2020. Hyundai His-s350ti (350w) Solar Panel. 1-2. access 24th November 2020. http://www.solardesigntool.com/components/module-panel-solar/Hyundai/3620/HiS-S350TI/specification-data-sheet.html.
- South-African_Reserve_Bank. 2019. Sa Reserve Bank Keeps Interest Rates Unchanged. Acessed 8th November 2020. https://www.iol.co.za/business-report/economy/sa-reserve-bank-keeps-interest-rates-unchanged-18852714.
- Southall, G. D., and K. A. 2016. “The Feasibility of Distributed Hydrogen Production from Renewable Energy Sources.” Sustainable Cities and Society 26: 134–149. doi:https://doi.org/10.1016/j.scs.2016.05.009.
- Sui, J., Z. Chen, C. Wang, Y. Wang, J. Liu, and W. Li. 2020. “Efficient Hydrogen Production from Solar Energy and Fossil Fuel via Water Electrolysis and Methane Steam Reforming Hybridization.” Applied Energy 115409 276: 1–11.
- Suntech. 2014. Monocrystalline Solar Module”iec-stp-vem-no1.01-rev 2014”. accessed 13th Nov 2014. www.suntech-power.com.
- Touili, S., A. M. Merrouni, A. Azouzoute, Y. El Hassouani, and A. Amrani. 2018. “A Technical and Economical Assessment of Hydrogen Production Potential from Solar Energy in Morocco.” International Journal of Hydrogen Energy 43 (51): 22777–22796. doi:https://doi.org/10.1016/j.ijhydene.2018.10.136.
- Van-Leeuwen, C., and A. Zauner 2018. Report on the costs involved with ptg technologies and their potentials across the eu. STORE&GO, 1–51.
- Yousef, H., A. H. Al-Badi, and A. Polycarpou. 2017. “Power Management for Hybrid Distributed Generation Systems.” International Journal of Sustainable Engineering 11 (1): 65–74. doi:https://doi.org/10.1080/19397038.2017.1387825.
- Zhou, P. P., F. D. Yamba, P. Lloyd, L. Nyahuma, C. Mzezewa, F. Kiponda, J. Keir, J. Asamoah, and S. H. 2009. “Determination of Regional Emission Factors for the Power Plant Sector I N Southern Africa.” Journal of Energy in Southern Africa 20 (4). doi:https://doi.org/10.17159/2413-3051/2009/v20i4a3307.