
 ?Mathematical formulae have been encoded as MathML and are displayed in this HTML version using MathJax in order to improve their display. Uncheck the box to turn MathJax off. This feature requires Javascript. Click on a formula to zoom.
ABSTRACT
In the Greater Houston Area, mobile sources contribute to the highest share of NOx emissions and the second-highest share of VOC emissions. The Houston METRO system that operates public buses is a key element of Houston’s infrastructures that could reduce the emissions of criteria air pollutants (CAPs) and greenhouse gases (GHGs), thus improving the regional air quality. We used life-cycle assessment (LCA) and life-cycle cost analysis (LCCA) to evaluate the environmental sustainability of electric buses and compared it to diesel buses. The LCA simulations demonstrate that life-cycle emissions of GHGs, VOCs, NOx, and black carbon associated with electric buses are lower than conventional diesel and diesel hybrid buses. These lower emissions are mainly attributed to the fact that natural gas currently makes up about 50% of the fuel used to generate electricity in Texas. However, other emissions such as PM10, PM2.5, SOx, N2O, and primary organic carbon are higher and would lead to the higher environmental cost of electric buses than diesel buses. The environmental cost analysis estimates that the annual cost savings of electric buses in 2040 would significantly support the long-term goal of environmental sustainability in the Greater Houston area.
1. Introduction
Urban mass transit systems are a valuable infrastructure component that alleviates road traffic congestion and reduces environmental impacts from passenger transportation. The Greater Houston area comprising 9 counties has a population of about 7 million in 2020 and is served by the Metropolitan Transit Authority of Harris County (stylised as METRO). Public transportation systems reduce greenhouse gas emissions (GHGs) and criteria air pollutants (CAPs) in urban centres and form an integral part of environmental strategies to combat climate change. However, a comprehensive energy and environmental life-cycle assessment (LCA) study is vital to quantify these improvements and identify any potential systemic modifications that could lower the environmental impacts of transportation infrastructure. As per the 2014 National Emission Inventory of the United States Environmental Protection Agency (USEPA), mobile sources (on- and off-road vehicles) contributed to the highest share (67%) of nitrogen oxide (NOx) emissions and the second-highest share (23%) of volatile organic (VOC) emissions in the Houston-Galveston-Brazoria (HGB) Area (TCEQ Citationn.d.). This region has historically been affected by severe summer ozone episodes that impact public health and welfare. Currently, the HGB Area is classified as a marginal nonattainment region according to the 2015 ozone standard of 0.07 ppm, as of 3 August 2018 (TCEQ Citationn.d.).
Vehicles using diesel and gasoline fossil fuels are the second largest contributor of GHG emissions in the USA, contributing to 27% of the total GHGs. Not only the GHG emissions but vehicles also significantly emit other air pollutants from their tailpipes, such as VOCs, CO, NOx, PM10, PM2.5, etc. To reduce and control air pollution in metropolitan areas, many cities worldwide have promoted or planned to replace conventional public transportation diesel buses with electric or fuel cell buses. However, the long-term replacement is complex, and it is needed to comprehensively evaluate the environmental impacts of alternative transport modes, indirect effects, and even supply chains, in addition to tailpipe emissions. The Houston METRO bus system is a critical element of Houston’s infrastructures that can lower CAPs and GHGs and improve regional air quality. However, any expansion of the METRO system, which includes upfront infrastructures and supply chain processes, needs to be considered when evaluating the environmental impacts.
Life-cycle assessment (LCA) is a valuable tool that can provide decision-makers with information needed to evaluate transportation systems’ direct and indirect impacts. Chester et al. (Citation2013) conducted near-term and long-term life-cycle impact assessments for the new bus rapid transit and light rail lines in Los Angeles. Their study considered the reduced automobile travel as a case scenario and estimated reductions in energy and emissions of GHGs and CAPs. They also conducted assessments for potential smog and respiratory impacts. Their results indicate that both infrastructure construction and energy production stages significantly increase the environmental footprint of transit systems in energy and GHG emissions by 48–100%. The most likely scenarios for reducing impacts from transit systems were identified as adopting emerging technologies and renewable sources for electricity production. The minimum migration ratios of passengers from existing transport modes to new mass transit systems to achieve environmental equivalence were 20–30% of total capacity. Although the study indicates a significant GHG emission reduction from the transit system, PM2.5 emissions can increase, thereby increasing the stress on achieving air quality compliance. The same research group also issued a report that would guide researchers and decision-makers by identifying sources, inventorying impacts, and interpreting the LCA results for transportation projects (Chester et al. Citation2014). The report identified the primary effects of the reductions in fuel consumption and auto-ownership, and the secondary effects of ridership time increased densification, and ancillary modes of transport such as biking. Following the report, Correa, Muñoz, and Rodriguez (Citation2019) compared energy demands and environmental impacts of diesel, diesel hybrid, hydrogen, and electric urban buses in Argentina, Chile, and Brazil. They found that electric buses are markedly superior in the tank-to-wheel step and that the focus should be on the production of clean energy within the electricity mix. In a recent case study of public electric buses in Macau, it was shown that electric buses in Macau hardly reduced the GHG emissions with the current electricity mix. The emissions could be improved using more natural gas and solar power in the future (Song et al. Citation2018).
Life-cycle cost analysis (LCCA) estimates the total purchasing, operating, maintenance, and salvage costs of an alternative over the life span. The environmental impacts and life-cycle cost of electric buses have widely been investigated, including technology exploration (Chester et al. Citation2013; Zheng et al. Citation2014; Rothgang et al. Citation2015; Xu et al. Citation2015; Mahmoud et al. Citation2016; Lajunen Citation2018; Chang et al., Citation2019a; Clairand et al. Citation2019; Correa, Muñoz, and Rodriguez Citation2019; Nordelöf, Romare, and Tivander Citation2019), case studies in both developed and developing counties (Chester, Horvath, and Madanat Citation2010; Nurhadi, Borén, and Ny Citation2014; Ke, Chung, and Chen Citation2016; Dong et al. Citation2018; Li, Castellanos, and Maassen Citation2018; Song et al. Citation2018; Chang et al., Citation2019b; Sheth and Sarkar Citation2019; Xylia et al. Citation2019), and its cost analysis and replacement strategies (Ke, Chung, and Chen Citation2016; Bi, De Kleine, and Keoleian Citation2017; Tong et al. Citation2017; Lajunen Citation2018; Li, Castellanos, and Maassen Citation2018; Borén Citation2019; Islam and Lownes Citation2019; Sheth and Sarkar Citation2019). Bi et al. (Citation2015) firstly studied the life-cycle GHG emissions of plug-in electric buses versus wireless-charged electric buses in the Ann Arbor–Ypsilanti metro area in Michigan, USA, and then integrated LCCA with the previous LCA for both types of electric buses later (Bi, De Kleine, and Keoleian Citation2017). They found that wireless-charged buses have the lowest cost of US$0.99/km among the four bus systems of conventional diesel, diesel hybrid, plug-in electric, and wireless-charged electric bus systems.
Some researchers have conducted LCA and LCCA that compare the competing fuel technologies of diesel, biodiesel, natural gas, electricity, hydrogen, and fuel cell applied to public bus systems (Sánchez et al. Citation2013; Lajunen and Lipman Citation2016; Sengupta and Cohan Citation2017; Breetz and Salon Citation2018; Chang et al., Citation2019a; Correa, Muñoz, and Rodriguez Citation2019; Nordelöf, Romare, and Tivander Citation2019). However, there are still some gaps within the existing studies on quantifying GHG and other air pollutant emissions in some American megacities. The Greater Houston area is the fourth-biggest metropolitan region in the USA. Houston METRO tested Proterra’s 40ʹ electric buses equipped with a plug-in lithium-titanate battery for three months starting from December 2016 (METRO, Citationn.d.). Currently, there is no electric bus operated by Houston METRO. There is also a lack of quality data on the comprehensive energy and environmental impacts of the METRO system.
Additionally, comparative studies for relative emissions and environmental impacts between passenger automobiles and METRO routes in Houston are non-existent. Our research addresses these gaps. It is essential to study and quantify the reductions in the life-cycle emissions of GHGs and other air pollutants from electric busses in comparison to diesel buses. Additionally, evaluating the life-cycle cost, and environmental cost of electric buses for a Megacity like Houston can help policymakers. We developed environmental LCA and LCCA for the buses operated by Houston METRO and provided quantitative estimates for GHG and CAP emissions when considering the fleet modification to electric vehicles. The results would serve as a guiding framework to evaluate the METRO system’s expansion and estimate METRO system’s contribution in realising the environmental objectives of the HGB Area.
2. Data and simulation methods
This study evaluates the environmental impacts and life-cycle cost resulting from replacing conventional diesel buses with electric buses in the Houston METRO system. The geographic scope of this study is limited to 9 counties comprising the Greater Houston metropolitan statistical area. The environmental scope incorporates air pollutants emitted from bus tailpipes and other significant pollutants to air and water associated with diesel production, electricity generation, bus fabrication, and maintenance. Three typical buses applicable to Houston METRO are conventional diesel, diesel hybrid, and plug-in electric buses.
2.1 System boundary and functional units
The system boundary for the diesel bus and electric bus covers the three major components: manufacture of vehicles, fuel use (including diesel production, electricity generation, and charging infrastructure), and vehicle maintenance. The integrated life-cycle environmental and cost analysis is applied to both diesel and electric bus systems. The functional units for environmental impacts are various life-cycle emissions per km, e.g. CO2 in kg/km, NOx in g/km, PM10, and PM2.5 in mg/km. The life-cycle costs of conventional diesel buses, diesel hybrid buses, and electric buses are calculated for 24 years, i.e. two life-cycles of vehicles or three life-cycles of electric bus batteries, in US dollars.
2.2 Life-cycle inventories
The initial life-cycle inventories of low-sulphur diesel and electric transit bus operations were built from the GREET® 2019.net model, which covers fuel cycle simulations from well to wheel and includes vehicle materials and vehicle components. Since the first version of GREET was released in 1996, it has widely been used to conduct LCA of various vehicles, including passenger cars, trucks and buses all over the world (Lewis, Kelly, and Keoleian Citation2012; Ding et al. Citation2013; Peterson and Michalek Citation2013; Choi and Song Citation2014; Huo et al. Citation2015; Noori, Gardner, and Tatari Citation2015; Tamayao et al. Citation2015; Hanbury and Vasquez Citation2018; Wu et al. Citation2018; Benajes et al. Citation2020). Specifically, it was also used to evaluate different bus systems, including conventional buses, plug-in electric buses, and fuel-cell buses (Cooney, Hawkins, and Marriott Citation2013; Lajunen and Lipman Citation2016; Tong et al. Citation2017; Banoo et al. Citation2020; Mao, Li, and Zhang Citation2020). Before conducting LCA, a specific model of the electric bus needs to be determined. In our study, the electric bus was defined as BYD K9 40ʹ electric transit bus.
In the GREET 2019 model, municipal buses are modelled as a transit bus, typically 40–45 feet long. When low sulphur diesel is used for a conventional transit bus, the fuel efficiency is 1.8684 km/litre, and the efficiency of a diesel hybrid transit bus is 2.2505 km/litre. The simulation model for electric transit buses was built from the baseline of conventional diesel buses with the fuel-equivalent conversion from electricity, i.e. miles per gallon diesel equivalent (MPGDE). The total LCA covers the simulations at all the stages of diesel production, electricity generation, battery production, bus fabrication, operation and maintenance, and the recycling of batteries and vehicle components. The electricity energy source is set up as TRE-distributed, which means the electricity mix of Texas at the user’s terminal. According to the LCA research of electric buses conducted for the Ann Arbor and Ypsilanti area in Michigan, reasonable battery weight is selected as 3525 kg, with an equivalent battery capacity of 458 kWh. This is calculated from the daily electricity requirement and state-of-charge range (Bi et al. Citation2015). The battery-to-wheel energy consumption rate of a plug-in electric bus is 1.46 kWh/km per statistical investigation (Bi et al. Citation2015). The input parameters of the electric bus system are presented in . In the table, SOC (state of charge) is the charge level of an electric battery relative to its capacity.
Table 1. Life-cycle input parameters of plug-in electric buses (per bus)
2.3 Method of life-cycle cost analysis
LCCA of electric buses, conventional diesel buses, and diesel hybrid buses used in Houston were conducted by Integrating with LCA. The integration is demonstrated in . The time horizon for the LCCA is 24 years, which is twice the life of a bus and the same as the techno-economic life of chargers. Common cost parameters shared by the three systems are listed in , and specific cost parameters for each system are listed in and classified as capital and operating costs (Bi, De Kleine, and Keoleian Citation2017). The night electricity rate of $0.0773 is used in the cost calculations, and we assume that it is enough to charge electric buses for one time at night. In , a negative inflation rate means the price is deflating.
Table 2. General cost parameters for the life-cycle cost analysis
Table 3. Cost parameters and intermediate calculated values for life-cycle cost analysis
Figure 1. Integration of life-cycle assessment and life-cycle cost analysis of three bus systems in Houston
Capital costs include bus and battery procurement, charger procurement, and charger installation in the bus night-parking areas of Houston METRO. Batteries were assumed to be replaced every 8 years, and buses (excluding the batteries) were assumed to be replaced every 12 years. Operation costs, including energy costs and maintenance costs, were assumed to be paid at the end of each year. Other use-phase costs, including driver wages and vehicle insurance/warranty, were assumed to be the same for the three bus systems, thus not included in the comparison. Annual maintenance costs cover the maintenance of facilities, infrastructure, vehicle propulsion, and powertrain systems. Subsidies provided by the Federal, the state of Texas, and the Houston council for purchasing electric buses were not considered. About 1,200 diesel buses operate in Houston METRO, and 40% of conventional diesel buses have been updated to diesel hybrid buses. Houston METRO can not replace all the diesel buses with electric buses at one time. In our cost analysis, we assumed that 500 electric buses would be purchased in 2020, and the calculations were compared with the same number of conventional and diesel hybrid buses.
For the plug-in electric bus system, use-phase electricity consumption E was calculated by using EquationEquation (1)(1)
(1) . Similarly, diesel consumption was calculated for conventional diesel and diesel hybrid buses by dividing fleet travel distance by specific fuel consumption. The electric and hybrid powertrains have better energy efficiencies compared to conventional diesel powertrains.
Where k is battery-to-wheel energy consumption rate in kWh/km, ηc is charging efficiency of the charger (%), ηb is charge/discharge efficiency of battery (%), and D is fleet travel distance in km.
2.4 Calculations of environmental cost
The environmental cost is calculated based on the Pollution Prevention (P2) program developed by the Pacific Northwest Pollution Prevention Research Center (PPRC) and is available through (USEPA, Citationn.d.a). The cost is estimated through the conversion of various pollutants to financial values. The P2 program originally covered a broad scope of cost savings related to water use, fuel use, soil waste, and air emissions. We investigated the environmental cost associated with air emissions to define the environmental cost impacts of alternative transportation. The calculated rate is an average of Texas state rates from a compilation of sources provided to Abt Associates by USEPA.
3. Results and discussion
3.1 Life-cycle assessment of electric buses, conventional diesel buses, and diesel hybrid buses in Houston
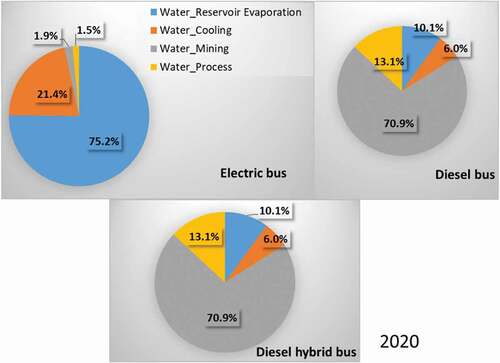
The resource share distribution of electricity in Texas is generated for the years 2020 and 2040 and is available from the United State Energy Information Administration (USEIA Citationn.d.). The predicted trend of resource changes was integrated into the GREET 2019 model. From 2020 to 2040, natural gas in the resource share of electricity generation in Texas would increase from 49.66% to 59.70%, and the coal use will decrease from 19.54% to 12.83%. During the production of fuel, electricity, batteries, and vehicles, water is another important natural resource. In the simulations with the GREET model, the water use can be categorised as water reservoir evaporation, water used for cooling, water used for mining, and water used for material/product processes. The different buses simulated in Houston, electric bus, conventional diesel bus, and diesel hybrid bus take the total water use of 8358.3, 1712.8, and 1422.0 cm3/km, respectively. It means that the water footprint of electric buses is 3.8–4.9 times than those of the other two types of buses because of a high water footprint for electricity generation in Texas. The percentage distribution of categorised water use for the three types of buses is shown in . For the buses simulated for 2020, the water reservoir evaporation takes the major part of the water consumption for electric buses. The water used in mining, specific to crude oil production, is the primary for both types of diesel buses.
Figure 2. Percentage distribution of water use in categories for three types of buses in 2020
In the LCA simulations with the GREET model, the life-cycle emissions are categorised as WTP, WTW, and total life cycle. WTP represents the well-to-pump stage; WTW, namely well-to-wheels, covers both stages of WTP and pump-to-wheels where fuel is consumed to power the vehicle wheels. The total life cycle means that the simulations include all the stages of fuel, vehicles, and necessary facilities and infrastructure, such as crude oil exploration and diesel production, electricity generation, electric battery packs, plug-in chargers used for electric buses, vehicle fabrication, vehicle maintenance, etc. The air pollutant emissions of total LCA between the three types of buses in 2020 are presented in . The electricity consumption and fuel use in the use phase, i.e. vehicle operation, was computed in LCA based on the fleet travel distance, similar to the proposed evaluation method in a previous LCA study for diesel and electric buses (Cooney, Hawkins, and Marriott Citation2013).
Figure 3. Life-cycle emissions of conventional diesel, diesel hybrid, and electric buses of Houston in 2020
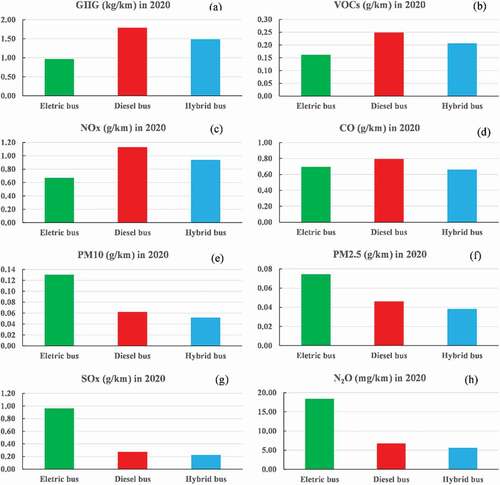
Our simulations show a significant reduction in life-cycle GHG emissions of electric buses in Houston related to both WTW and total life cycle, relative to conventional diesel and diesel hybrid buses. The real-world performance and life-cycle GHG emissions of electric buses were comprehensively discussed in recent literature (; Zhou et al. Citation2016; Dreier et al. Citation2018; Mao, Li, and Zhang Citation2020). Most of the studies demonstrated the benefits of lower GHG emissions led by the transfer from diesel buses to electric buses at different degrees worldwide. However, the bus electrification in Macau, China, could cause higher GHG emissions than the conventional diesel buses, with the current electricity mix primarily relying on the local coal power plant (Song et al. Citation2018). In our study, plug-in battery-electric buses in Houston could low down 35% of GHG emissions compared to the conventional diesel buses in 2020.
Distinct from most previous studies focusing only on the life-cycle GHG emissions, we evaluated other air emissions such as CAP pollutants, N2O, methane, black carbon, and primary organic carbon. As shown in , the life-cycle emissions of VOCs and NOx associated with electric buses are lower than the conventional diesel and diesel hybrid buses. However, other emissions PM10, PM2.5, SOx, and N2O associated with electric buses are higher than the traditional diesel and diesel hybrid buses. Regarding CO emissions, the life-cycle emissions of electric buses are lower than conventional diesel buses and are slightly higher than the diesel hybrid buses. It is well-known that the significant emissions of conventional diesel and diesel hybrid buses are from vehicle operation. For electric buses, although it is zero-emission during bus operation except for TBW (tire & brake wear) emissions, the life-cycle emissions are mostly associated with electricity production. When conventional fossil fuels such as coal and natural gas are dominant in electricity supply, e.g. Texas, it is not easy to reduce all the air pollutant emissions. In 2020, natural gas takes almost 50% of the resource share in the power generation, coal is about 20%, and nuclear power has about 10% in Texas. It looks like that the use of electric buses will transfer conventional bus emissions in the urban areas to the point-source emissions of power plants. If power plants are located in rural areas, bus electrification will dramatically reduce air pollution in cities. For the megacity Houston, most electricity is provided by the biggest US power plant, i.e. the W.A. Parish power plant, which is on the border of Houston. Coal and natural gas are used as power fuels, and either is 50% in the power plant. When considering electricity in Houston only provided by the W.A. Parish power plant, the life-cycle emissions of electric buses would be even worse than the Texas electricity mix scenario. In the future, electric buses would benefit the entire environment if more clean electricity is produced from wind and solar power in Texas.
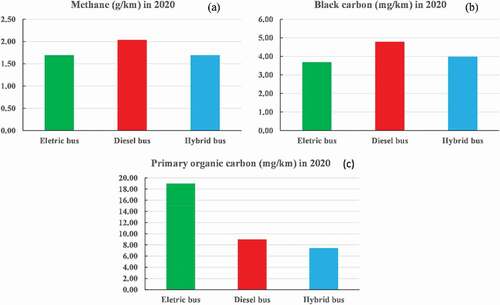
Methane is estimated to have a global warming potential of 28–36 times that of CO2 over 100 years (USEPA, Citationn.d.b). Black carbon forms through the incomplete combustion of fossil fuel, biofuel, and biomass, and it can cause human morbidity and premature mortality. Primary organic carbon refers specifically to the mass of carbon in particulate matter. Black carbon and primary organic carbon are two major organic species in the composition of PM. The life-cycle emissions of methane, black carbon, and primary organic carbon in 2020 are shown in . Similar to the analysis of GHG emissions, electric buses would lead to fewer emissions of methane and black carbon than the conventional diesel buses, almost equal to or slightly lower than the diesel hybrid buses. The emission trend of primary organic carbon is similar to the life-cycle PM10 emissions for the three types of buses since primary organic carbon is mostly present in PM10 (Banoo et al. Citation2020).
Figure 4. Life-cycle emissions of methane, black carbon, and primary organic carbon in 2020
We also aim to evaluate the future environmental impacts of electric buses and support future development plans of public transportation in Houston. Then, LCA simulations for the three types of buses were also conducted for 2040. The categorised distribution of water use for the three types of buses in 2040 is presented in . Similar to the analysis for 2020, water reservoir evaporation will take the primary in the categorised water use for electric buses, and water used in mining will be the most for diesel buses in 2040. Compared to water use in 2020, electric buses will save 13.0% water, and both types of diesel buses will save 3.3% water in 2040.
Figure 5. Percentage distribution of water use in categories for three types of buses in 2040
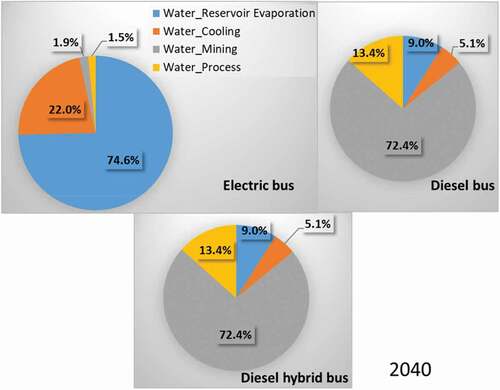
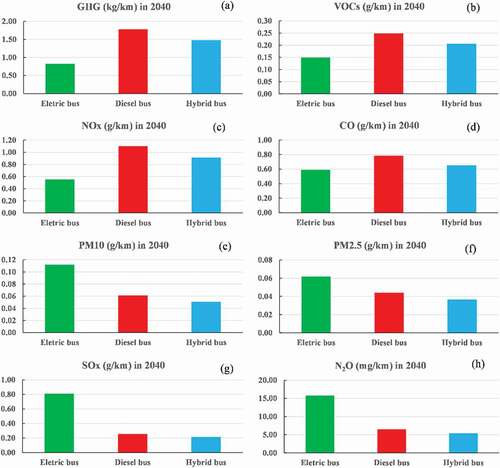
shows various life-cycle emissions of buses in 2040. Compared to the emissions in 2020, all the emissions would keep similar trends except for CO emissions. The life-cycle emissions of GHGs, VOCs, and NOx associated with electric buses would be significantly lower than those of both types of diesel buses in 2040. The life-cycle emissions of PM10, PM2.5, SOx, and N2O associated with electric buses would still be higher than the conventional diesel and diesel hybrid buses. Compared to 2020, electric buses’ life-cycle CO emissions in 2040 would be lower than both diesel buses. These emission reductions would primarily be led by almost 10% more natural gas used in electricity generation in Texas in the 2040s and the decreasing trend of coal use for electricity generation. Furthermore, the life-cycle emissions of GHGs, VOCs, NOx, CO, PM10, PM2.5, SOx, and N2O associated with electric buses would decrease by 7.7%-17.6% with the continuous technology improvement on electric vehicle efficiency and electricity generation in the future.
Figure 6. Life-cycle emissions of conventional diesel, diesel hybrid, and electric buses of Houston in 2040
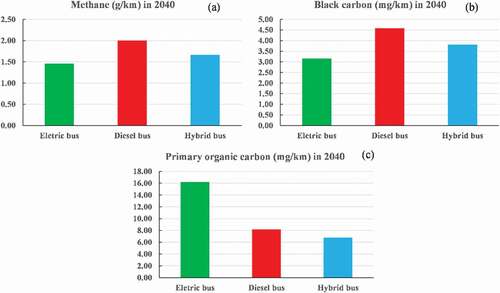
shows the life-cycle emissions of methane, black carbon, and primary organic carbon for the three types of buses in 2040. Compared to the corresponding emissions of electric buses in 2020, the life-cycle emissions of methane, black carbon, and primary organic carbon in 2040 would decrease by 13.4%, 14.5%, and 14.8%, respectively. With the technological improvement of diesel buses in the future, the emissions of methane, black carbon, and primary organic carbon of both diesel buses would decrease by 1.8%, 4.4%, and 8.9% in 2040 because current diesel buses are using more mature technologies than electric buses.
Figure 7. Life-cycle emissions of methane, black carbon, and primary organic carbon in 2040
3.2 Life-cycle cost analysis of electric buses, conventional diesel buses, and diesel hybrid buses used in Houston
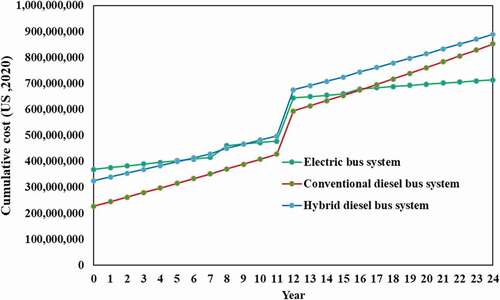
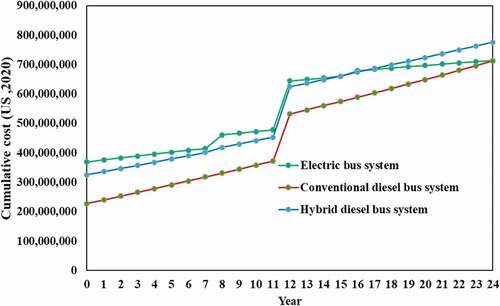
shows the cumulative costs of plug-in electric, conventional diesel, and hybrid bus systems. In 2020 (Year 0, the beginning of the time horizon), the electric bus system has the highest capital cost, and the conventional pure diesel system has the lowest capital cost. We can see that the cost of a bus battery pack is almost half the price of an electric bus without a battery, and the annual inflation rate of lithium-ion batteries is −9%. It is worth noting that at the end of the 24th year, the electric bus system has the lowest costs over the period with an entire life-cycle cost of US$714.2 million, and that the diesel hybrid bus has the highest costs of US$889.9 million, and the second is the conventional diesel bus system at US$852.3 million. The differences in the fuel economy and annual inflation of electricity and diesel result in different fuelling cost increases per year, reflected in the slopes of the curves. In the 8th and 16th years, battery replacements with battery installation costs occur for electric and hybrid buses, and in the 12th year, bus replacement is scheduled for all three types of buses by keeping the same batteries for electric and hybrid buses.
Figure 8. Cumulative costs of plug-in electric, conventional diesel, and diesel hybrid bus systems
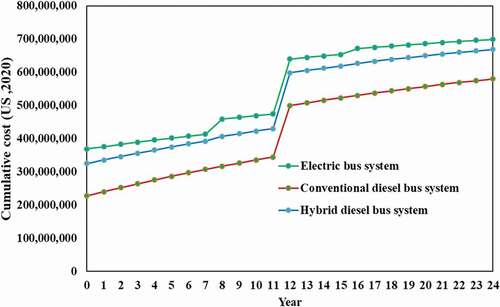
The costs of electricity and diesel take the top priority in the LCCA. The final results are sensitive to the starting prices of diesel and electricity. In the past several decades, the price of electricity has steadily increased at an annual rate of about 2%. However, gas and diesel prices are more influenced by global economic conditions and some severe international events. Under the co-occurrence of the COVID-19 pandemic and the reduction of oil price prompted by the Organization of the Petroleum Exporting Countries (OPEC) in March 2020, gas and diesel prices have been running at a historic low price. Although the diesel price has climbed up since the end of March 2020, the average diesel price is about $0.5541/litre in Houston, and it is about 33% lower than the pre-built model (Bi, De Kleine, and Keoleian Citation2017). When $0.5541/litre is used in the LCCA by keeping other input parameters, the final life-cycle cost of the conventional diesel bus system changes to the lowest. shows the cumulative costs of plug-in electric, conventional diesel, and diesel hybrid bus systems with the starting diesel price of $0.5541/litre. The electric and conventional diesel bus systems have lower final costs than the diesel hybrid bus system similarly.
Figure 9. Cumulative costs of plug-in electric, conventional diesel, and diesel hybrid bus systems with the starting diesel price of $0.5541/litre
In the previous two cost evaluations, electricity and diesel have annual inflation rates of 2% and 5.84%, which also significantly influence the three bus systems’ final costs. Although USEIA provides the annual inflation rates of electricity and diesel based on the statistical data in the past decades, it is still very difficult to predict the annual inflation rate of diesel if the crude oil price drop happens again like March 2020 in the future. To remove the influence of both annual inflation rates, we also calculated the final costs by setting both as zero. We can see that there is no change in the order of the cumulative costs for the three bus systems starting from 2020 (). From the beginning to the end, the conventional diesel bus system has the lowest cost, and the diesel hybrid bus system is the second lower.
Figure 10. Cumulative costs of plug-in electric, conventional diesel, and diesel hybrid bus systems with the starting diesel price of $0.5541/litre without considering the annual inflation of electricity and diesel
3.3 Environmental cost analysis
We estimated the annual net environmental cost realised from emitting regulated air emissions for three different transportation options. The environmental cost is calculated based on the total amount of Clean Air Act Title V air pollutants as described in the P2 program (Waxman Citation1991). This includes NOx, SOx, PM10, and VOCs. The environmental cost can also be calculated based on hazardous air pollutants (HAPs) per P2; however, they are out of the scope of this research. The costs of the three types of buses in 2020 and 2040 are displayed in . They are calculated based on the annual distances per driver of 21,687 km and the assumption of 22 passengers per bus. The premise of transportation population is about 7 million in 2020, as discussed in Section 1, and 9.6 million in 2040.
Figure 11. Annual environmental cost based on clean air act title V air pollutants emissions in (a) 2020 and (b) 2040
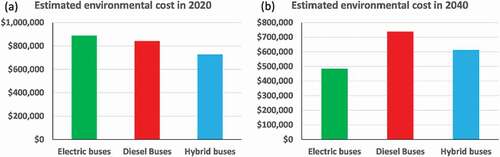
For example, the annual total emission of Clean Air Act Title V air pollutants in 2020 for the electric bus is evaluated as 2.70 g/vehicle-km for the electric bus option based on . The total emission per commuter is calculated as 21,687 km×7 million×2.70 g/vehicle-km/22 (passenger per bus) = 18,631.1 tonnes. Based on the annual emission amounts of 18631.1 tonnes, the environmental cost is calculated as US$889,281.27 for the electric buses, as shown in . Similarly, the environmental costs of conventional diesel buses and diesel hybrid buses are calculated in 2020 and 2040, as displayed in also.
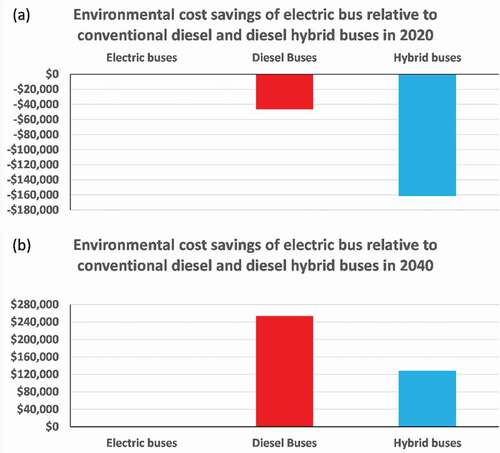
shows the annual environmental cost savings of electric buses in both 2020 and 2040 compared to the conventional diesel and diesel hybrid buses. In 2020, Houston’s electric bus would produce more CAPs than the conventional diesel and diesel hybrid buses, thus hurting the annual environmental cost savings. Surprisingly, the yearly environmental cost savings of electric buses in 2040 would reach $253,610.1454 and $128,451.79, respectively. The savings would be attributed to the fact that the life-cycle CAP emissions of electric buses would decrease from 2.7 g/km in 2020 to 1.47 g/km in 2040 and that the life-cycle CAP emissions of conventional diesel and diesel hybrid buses would only decrease by 12.5% in 2040. The savings would also provide a piece of evidence for the future environmental sustainability of the Greater Houston area contributed from the electrification of a public fleet.
Figure 12. Annual environmental cost savings of electric buses in (a) 2020 and (b) 2040
4. Conclusions
We evaluated life-cycle environmental impact and economic analysis for switching diesel buses to electric buses in the Greater Houston area. The environmental impacts are assessed as comparative life-cycle emissions of conventional diesel bus, diesel hybrid bus, and electric bus. The economic analysis was conducted as life-cycle cost for three bus types by integrating with LCA of fuel and vehicles. The life-cycle emissions of GHGs, VOCs, NOx, and black carbon associated with electric buses are lower than conventional diesel and diesel hybrid buses in 2020. The lower GHG emissions are mainly attributed to the primary use of natural gas. Other emissions such as PM10, PM2.5, SOx, N2O, and primary organic carbon are higher, thus causing the higher environmental cost of electric buses than diesel buses. These emissions are primarily determined by the resource share of electricity generation in Texas, where natural gas, coal, and nuclear power take about 50%, 20%, and 10%, respectively, with other renewable energies. All the life-cycle emissions would be improved in 2040 since more natural gas and less coal will be used in the electricity generation in Texas in the future.
With the application assumption of electric buses starting from 2020, our base-case study demonstrated that the life-cycle cost of electric buses would be the lowest at the end of 24 years. In the starting year, the capital cost of electric buses, including batteries and charging station installation, is the highest. The cumulative costs of the three types of buses are mainly determined by the costs of diesel and electricity consumption during vehicle operation. However, the life-cycle costs of buses are very sensitive to the prices of diesel and electricity in the future. Different annual inflation rates applied to electricity and diesel in the 24 years would cause significantly different trends in the estimate of life-cycle costs. The oil price drop or fluctuation induced by some worldwide events, such as the COVID-19 pandemic and the reduction of oil price prompted by OPEC, would put uncertainties onto LCCA to some degree. The comparative environmental cost analysis in 2020 and 2040 shows that electric buses would reach positive environmental cost savings in 2040, mainly due to the significant reduction in the life-cycle CAP emissions of electric buses in 2040.
Acknowledgments
This work was primarily funded through a grant from the Transportation Consortium of South Central States (Tran-SET), a USDOT funded University Transportation Center, Award # 19PPPVU01. Partial support was also received from NSF CREST Center for Energy & Environmental Sustainability at Prairie View A&M University, NSF Award # 1914692.
Disclosure statement
No potential conflict of interest was reported by the author(s).
Additional information
Funding
Notes on contributors
Hongbo Du
Hongbo Du is a Research Scientist in the Center for Energy & Environmental Sustainability, Prairie View A&M University. His research interests are energy & environmental sustainability, life cycle and cost analysis, carbon capture, and wastewater treatment with membrane processes.
Raghava Rao Kommalapati
Raghava Rao Kommalapati is the Director of the Center for Energy & Environmental Sustainability, Prairie View A&M University. He is also a professor in the Department of Civil & Environmental Engineering, Prairie View A&M University. His research interests are air quality measurement & modeling, energy & environmental sustainability, carbon capture, and wastewater treatment.
References
- Banoo, R., S. K. Sharma, R. Gadi, S. Gupta, and T. K. Mandal. 2020. “Seasonal Variation of Carbonaceous Species of PM10 over Urban Sites of National Capital Region of India.” Aerosol Science and Engineering 4 (2): 111–123. doi:https://doi.org/10.1007/s41810-020-00058-2.
- Benajes, J., A. García, J. Monsalve-Serrano, and S. Martínez-Boggio. 2020. “Emissions Reduction from Passenger Cars with RCCI Plug-in Hybrid Electric Vehicle Technology.” Applied Thermal Engineering 164: 114430. doi:https://doi.org/10.1016/j.applthermaleng.2019.114430.
- Bi, Z., L. Song, R. De Kleine, C. C. Mi, and G. A. Keoleian. 2015. “Plug-in Vs. Wireless Charging: Life Cycle Energy and Greenhouse Gas Emissions for an Electric Bus System.” Applied Energy 146: 11–19. doi:https://doi.org/10.1016/j.apenergy.2015.02.031.
- Bi, Z. C., R. De Kleine, and G. A. Keoleian. 2017. “Integrated Life Cycle Assessment and Life Cycle Cost Model for Comparing Plug-in versus Wireless Charging for an Electric Bus System.” Journal of Industrial Ecology 21 (2): 344–355. doi:https://doi.org/10.1111/jiec.12419.
- Borén, S. 2019. “Electric Buses’ Sustainability Effects, Noise, Energy Use, and Costs.” International Journal of Sustainable Transportation 14 (12): 956–971. doi:https://doi.org/10.1080/15568318.2019.1666324.
- Breetz, H. L., and D. Salon. 2018. “Do Electric Vehicles Need Subsidies? Ownership Costs for Conventional, Hybrid, and Electric Vehicles in 14 US Cities.” Energy Policy 120: 238–249. doi:https://doi.org/10.1016/j.enpol.2018.05.038.
- Chang, C. C., Y. T. Liao, and Y. W. Chang. 2019a. “Life Cycle Assessment of Alternative Energy Types - Including Hydrogen - for Public City Buses in Taiwan.” International Journal of Hydrogen Energy 44 (33): 18472–18482. doi:https://doi.org/10.1016/j.ijhydene.2019.05.073.
- Chang, -C.-C., Y.-T. Liao, and Y.-W. Chang. 2019b. “Life Cycle Assessment of Carbon Footprint in Public transportation-A Case Study of Bus Route NO. 2 In Tainan City, Taiwan.” Procedia Manufacturing 30: 388–395. doi:https://doi.org/10.1016/j.promfg.2019.02.054.
- Chester, M., J. Matute, P. Bunje, W. Eisenstein, S. Pincetl, Z. Elizabeth, and C. Cepeda. 2014 January 12-16. “Life‐cycle Assessment for Transportation Decision‐making.” Transportation Research Board 93rd Annual Meeting, Washington DC, USA. Accessed on June 1st, 2020 https://trid.trb.org/view/1287745
- Chester, M., S. Pincetl, Z. Elizabeth, W. Eisenstein, and J. Matute. 2013. “Infrastructure and Automobile Shifts: Positioning Transit to Reduce Life-cycle Environmental Impacts for Urban Sustainability Goals.” Environmental Research Letters 8 (1): Article 015041. doi:https://doi.org/10.1088/1748-9326/8/1/015041.
- Chester, M. V., A. Horvath, and S. Madanat. 2010. “Comparison of Life-cycle Energy and Emissions Footprints of Passenger Transportation in Metropolitan Regions.” Atmospheric Environment 44 (8): 1071–1079. doi:https://doi.org/10.1016/j.atmosenv.2009.12.012.
- Choi, W., and H. H. Song. 2014. “Well-to-wheel Analysis on Greenhouse Gas Emission and Energy Use with Natural Gas in Korea.” International Journal of Life Cycle Assessment 19 (4): 850–860. doi:https://doi.org/10.1007/s11367-014-0704-7.
- Clairand, J. M., P. Guerra-Teran, X. Serrano-Guerrero, M. Gonzalez-Rodriguez, and G. Escriva-Escriva. 2019. “Electric Vehicles for Public Transportation in Power Systems: A Review of Methodologies.” Energies 12 (16): Article 3114. doi:https://doi.org/10.3390/en12163114.
- Cooney, G., T. R. Hawkins, and J. Marriott. 2013. “Life Cycle Assessment of Diesel and Electric Public Transportation Buses.” Journal of Industrial Ecology 17 (5): 689–699. doi:https://doi.org/10.1111/jiec.12024.
- Correa, G., P. Muñoz, and C. Rodriguez. 2019. “A Comparative Energy and Environmental Analysis of A Diesel, Hybrid, Hydrogen and Electric Urban Bus.” Energy 187: 115906. doi:https://doi.org/10.1016/j.energy.2019.115906.
- Ding, Y. J., W. J. Han, Q. H. Chai, S. H. Yang, and W. Shen. 2013. “Coal-based Synthetic Natural Gas (SNG): A Solution to China’s Energy Security and CO2 Reduction?” Energy Policy 55: 445–453. doi:https://doi.org/10.1016/j.enpol.2012.12.030.
- Dong, D., H. B. Duan, R. C. Mao, Q. B. Song, J. Zuo, J. S. Zhu, G. Wang, M. W. Hu, B. Q. Dong, and G. Liu. 2018. “Towards A Low Carbon Transition of Urban Public Transport in Megacities: A Case Study of Shenzhen, China.” Resources Conservation and Recycling 134: 149–155. doi:https://doi.org/10.1016/j.resconrec.2018.03.011.
- Dreier, D., S. Silveira, D. Khatiwada, K. V. Fonseca, R. Nieweglowski, and R. Schepanski. 2018. “Well-to-Wheel Analysis of Fossil Energy Use and Greenhouse Gas Emissions for Conventional, Hybrid-electric and Plug-in Hybrid-electric City Buses in the BRT System in Curitiba, Brazil.” Transportation Research Part D: Transport and Environment 58: 122–138. doi:https://doi.org/10.1016/j.trd.2017.10.015.
- Hanbury, O., and V. R. Vasquez. 2018. “Life Cycle Analysis of Geothermal Energy for Power and Transportation: A Stochastic Approach.” Renewable Energy 115: 371–381. doi:https://doi.org/10.1016/j.renene.2017.08.053.
- Huo, H., H. Cai, Q. Zhang, F. Liu, and K. He. 2015. “Life-cycle Assessment of Greenhouse Gas and Air Emissions of Electric Vehicles: A Comparison between China and the US”. Atmospheric Environment 108: 107–116. doi:https://doi.org/10.1016/j.atmosenv.2015.02.073.
- Islam, A., and N. Lownes. 2019. “When to Go Electric? A Parallel Bus Fleet Replacement Study.” Transportation Research Part D: Transport and Environment 72: 299–311. doi:https://doi.org/10.1016/j.trd.2019.05.007.
- Ke, B. R., C. Y. Chung, and Y. C. Chen. 2016. “Minimizing the Costs of Constructing an All Plug-in Electric Bus Transportation System”. A Case Study in Penghu.” Applied Energy 177: 649–660. doi:https://doi.org/10.1016/j.apenergy.2016.05.152.
- Lajunen, A. 2018. “Lifecycle Costs and Charging Requirements of Electric Buses with Different Charging Methods.” Journal of Cleaner Production 172: 56–67. doi:https://doi.org/10.1016/j.jclepro.2017.10.066.
- Lajunen, A., and T. Lipman. 2016. “Lifecycle Cost Assessment and Carbon Dioxide Emissions of Diesel, Natural Gas, Hybrid Electric, Fuel Cell Hybrid and Electric Transit Buses.” Energy 106: 329–342. doi:https://doi.org/10.1016/j.energy.2016.03.075.
- Lewis, A. M., J. C. Kelly, and G. A. Keoleian. 2012. “Evaluating the Life Cycle Greenhouse Gas Emissions from a Lightweight Plug-in Hybrid Electric Vehicle in a Regional Context.” 2012 IEEE International Symposium on Sustainable Systems and Technology (ISSST), Accessed on June 20th, 2020.
- Li, X. Y., S. Castellanos, and A. Maassen. 2018. “Emerging Trends and Innovations for Electric Bus Adoption-a Comparative Case Study of Contracting and Financing of 22 Cities in the Americas, Asia-Pacific, and Europe.” Research in Transportation Economics 69: 470–481. doi:https://doi.org/10.1016/j.retrec.2018.06.016.
- Mahmoud, M., R. Garnett, M. Ferguson, and P. Kanaroglou. 2016. “Electric Buses: A Review of Alternative Powertrains”. Renewable & Sustainable Energy Reviews 62: 673–684. doi:https://doi.org/10.1016/j.rser.2016.05.019.
- Mao, F., Z. Li, and K. Zhang. 2020. “Carbon Dioxide Emissions Estimation of Conventional Diesel Buses Electrification: A Well-to-well Analysis in Shenzhen, China.” Journal of Cleaner Production 277: 123048. doi:https://doi.org/10.1016/j.jclepro.2020.123048.
- METRO. n.d. “Electric Bus 63 Fondren.” Accessed on June 28th, 2020, https://www.ridemetro.org/Pages/ElectricBus.aspx
- Noori, M., S. Gardner, and O. Tatari. 2015. “Electric Vehicle Cost, Emissions, and Water Footprint in the United States: Development of a Regional Optimization Model”. Energy 89: 610–625. doi:https://doi.org/10.1016/j.energy.2015.05.152.
- Nordelöf, A., M. Romare, and J. Tivander. 2019. “Life Cycle Assessment of City Buses Powered by Electricity, Hydrogenated Vegetable Oil or Diesel.” Transportation Research Part D: Transport and Environment 75: 211–222. doi:https://doi.org/10.1016/j.trd.2019.08.019.
- Nurhadi, L., S. Borén, and H. Ny. 2014. “Advancing from Efficiency to Sustainability in Swedish Medium-sized Cities: An Approach for Recommending Powertrains and Energy Carriers for Public Bus Transport Systems”. Procedia-Social and Behavioral Sciences 111: 1218–1225. doi:https://doi.org/10.1016/j.sbspro.2014.03.723.
- Peterson, S. B., and J. J. Michalek. 2013. “Cost-effectiveness of Plug-in Hybrid Electric Vehicle Battery Capacity and Charging Infrastructure Investment for Reducing US Gasoline Consumption.” Energy Policy 52: 429–438. doi:https://doi.org/10.1016/j.enpol.2012.09.059.
- Rothgang, S., M. Rogge, J. Becker, and D. U. Sauer. 2015. “Battery Design for Successful Electrification in Public Transport.” Energies 8 (7): 6715–6737. doi:https://doi.org/10.3390/en8076715.
- Sánchez, J. A. G., J. M. L. Martínez, J. L. Martín, M. N. F. Holgado, and H. A. Morales. 2013. “Impact of Spanish Electricity Mix, over the Period 2008–2030, on the Life Cycle Energy Consumption and GHG Emissions of Electric, Hybrid Diesel-electric, Fuel Cell Hybrid and Diesel Bus of the Madrid Transportation System.” Energy Conversion and Management 74: 332–343. doi:https://doi.org/10.1016/j.enconman.2013.05.023.
- Sengupta, S., and D. S. Cohan. 2017. “Fuel Cycle Emissions and Life Cycle Costs of Alternative Fuel Vehicle Policy Options for the City of Houston Municipal Fleet.” Transportation Research Part D: Transport and Environment 54: 160–171. doi:https://doi.org/10.1016/j.trd.2017.04.039.
- Sheth, A., and D. Sarkar. 2019. “Life Cycle Cost Analysis for Electric Vs Diesel Bus Transit in an Indian Scenario.” International Journal of Technology 10 (1): 105–115. doi:https://doi.org/10.14716/ijtech.v10i1.1958.
- Song, Q. B., Z. S. Wang, Y. Wu, J. H. Li, D. F. Yu, H. B. Duan, and W. Y. Yuan. 2018. “Could Urban Electric Public Bus Really Reduce the GHG Emissions: A Case Study in Macau?”. Journal of Cleaner Production 172: 2133–2142. doi:https://doi.org/10.1016/j.jclepro.2017.11.206.
- Tamayao, M.-A. M., J. J. Michalek, C. Hendrickson, and I. M. Azevedo. 2015. “Regional Variability and Uncertainty of Electric Vehicle Life Cycle CO2 Emissions across the United States.” Environmental Science & Technology 49 (14): 8844–8855. doi:https://doi.org/10.1021/acs.est.5b00815.
- TCEQ. n.d. “Texas Emission Sources - A Graphical Representation.” Accessed on July 15th, 2020, https://www.tceq.texas.gov/airquality/areasource/texas-emissions-graphical-representation
- Tong, F., C. Hendrickson, A. Biehler, P. Jaramillo, and S. Seki. 2017. “Life Cycle Ownership Cost and Environmental Externality of Alternative Fuel Options for Transit Buses.” Transportation Research Part D-Transport and Environment 57: 287–302. doi:https://doi.org/10.1016/j.trd.2017.09.023.
- USEIA. n.d. “Total Energy Production and Consumption by State.” Accessed on July 18th, 2020, https://www.eia.gov/beta/states/data
- USEPA. n.d.a. “Pollution Prevention Tools and Calculators.” Accessed on July 28th, 2020, https://www.epa.gov/p2/pollution-prevention-tools-and-calculators
- USEPA. n.d.b. “Understanding Global Warming Potentials.” Accessed on January 18th, 2021, https://www.epa.gov/ghgemissions/understanding-global-warming-potentials#Learn%20why
- Waxman, H. A. 1991. “An Overview of the Clean Air Act Amendments of 1990.” Environmental Law 21: 1721–1816.
- Wu, Z., M. Wang, J. Zheng, X. Sun, M. Zhao, and X. Wang. 2018. “Life Cycle Greenhouse Gas Emission Reduction Potential of Battery Electric Vehicle.” Journal of Cleaner Production 190: 462–470. doi:https://doi.org/10.1016/j.jclepro.2018.04.036.
- Xu, Y. Z., F. E. Gbologah, D. Y. Lee, H. B. Liu, M. O. Rodgers, and R. L. Guensler. 2015. “Assessment of Alternative Fuel and Powertrain Transit Bus Options Using Real-world Operations Data: Life-cycle Fuel and Emissions Modeling”. Applied Energy 154: 143–159. doi:https://doi.org/10.1016/j.apenergy.2015.04.112.
- Xylia, M., S. Leduc, A. B. Laurent, P. Patrizio, Y. van der Meer, F. Kraxner, and S. Silveira. 2019. “Impact of Bus Electrification on Carbon Emissions: The Case of Stockholm”. Journal of Cleaner Production 209: 74–87. doi:https://doi.org/10.1016/j.jclepro.2018.10.085.
- Zheng, Y., Z. Y. Dong, Y. Xu, K. Meng, J. H. Zhao, and J. Qiu. 2014. “Electric Vehicle Battery Charging/swap Stations in Distribution Systems: Comparison Study and Optimal Planning.” Ieee Transactions on Power Systems 29 (1): 221–229. doi:https://doi.org/10.1109/tpwrs.2013.2278852.
- Zhou, B., Y. Wu, B. Zhou, R. Wang, W. Ke, S. Zhang, and J. Hao. 2016. “Real-world Performance of Battery Electric Buses and Their Life-cycle Benefits with respect to Energy Consumption and Carbon Dioxide Emissions.” Energy 96: 603–613. doi:https://doi.org/10.1016/j.energy.2015.12.041.