
 ?Mathematical formulae have been encoded as MathML and are displayed in this HTML version using MathJax in order to improve their display. Uncheck the box to turn MathJax off. This feature requires Javascript. Click on a formula to zoom.
ABSTRACT
Variable nature of solar energy leads to inconsistent performance of photovoltaic systems. Integration of photovoltaic systems with storage and grid mitigates variability issues and helps maximise self-consumption. This work presents a design methodology for a grid-connected photovoltaic system integrated with storage to meet an annual hourly average demand of 135 kWh of an establishment situated in northern India which receives a daily average solar insolation of 5.16 kWh/m2. System design has been carried out to meet the energy demand at minimised annualised cost. The annualised cost of the optimised system has been found to be US$115184.20/year. Analysis shows that the proposed model results in reduction in annualised cost by 32.27% and a net reduction in emissions by 610 MT as compared with the traditional grid power. Furthermore, multi-objective optimisation carried out to explore system design trade-offs between annualised cost, peak to average ratio of grid energy, and emissions, indicates that overall reduction in emissions by 15% could be obtained at 6.5% increased cost. It is also observed that reduction in grid-outages by 25% leads to reduction in AC by as high as 42.4%.
1. INTRODUCTION
Over the past few decades, ever-increasing energy demand has led to a rapid depletion of fossil fuel reserves, which have served as a major source of energy across the globe for over a century. The ubiquitous use of fossil fuels has also led to an alarming rise in the levels of pollution. This trend has led governments worldwide to develop measures that promote the use of renewable sources of energy (Adenle Citation2020). Many countries worldwide have come with policies to promote the adoption of renewable energy, such as subsidies for cleaner energy sources, penalties for emissions, etc.
Among the renewable sources of energy, solar energy has emerged as one of the more attractive options in India. Photovoltaic (PV) systems, which harness solar energy to produce electricity directly, have emerged as a feasible alternative, successfully employed worldwide, to render power, thereby replacing fossil fuels for the purpose (Shaahid et al. Citation2010). PV has demonstrated relatively higher potential to contribute in the renewable energy mix of the urban environment, among the available micro-generation technologies. Globally, nearly half of the installed PV capacity is composed of distributed PV systems. The popularity of PV-based energy systems is due to their declining costs and the development of more efficient PV technologies. India is abundant in renewable sources, including solar and wind energy. The country’s solar power potential is close to 750 GW. A significant part of the Indian landscape receives annual insolation greater than 5 kWh/m2/day. India receives 200 MW/m2 of average solar radiation and 250–325 sunny days each year (Kumar and Singh Citation2018), which makes power generation using solar energy in India an attractive option. To harness this huge potential in India, in 2010, GoI launched Jawaharlal Nehru National Solar Mission (JNNSM). The mission set an ambitious target of deploying 2 GW of off-grid and 20 GW of grid-connected solar power by 2022. In 2015, the cumulative installation target was revised to 100 GW of solar installations by 2021–22. The target includes 40 GW of rooftop and 60 GW of grid-connected solar power projects.
Several studies based on optimisation of PV-based energy systems have been proposed in the literature (Singh and Kaushik Citation2016; Shaahid and Elhadidy Citation2003; Shaahid, Al-Hadhrami, and Rahman Citation2014). PV systems have been popular for both stand-alone and grid-connected set-ups. Stand-alone PV systems are usually employed in remote areas or at locations where grid availability is an issue. Grid-connected PV systems are used to augment the grid supply. The grid connection serves as a back up to the PV system, thus, reducing the capacity requirement of energy storage systems (ESSs) and eliminate the need of diesel generators.
Integration of PV-systems with grid is a complex exercise, primarily due to the intermittent nature of solar energy and variability of the load demand. It involves analysing different variable factors such as climatic factors, technological factors related to PV modules and other components, and economic factors such as system investment costs, electricity prices, etc. Several conventional techniques such as mixed-integer linear programming (MILP) (Aslam et al. Citation2018; Ghaffarzadeh et al. Citation2017), graphical construction method (An and Tuan Citation2018), Monte-Carlo simulation (Singh and Fernandez Citation2018), iterative methods (Geleta and Manshahia Citation2018), probabilistic approach (Reddy and Reddy Citation2004), etc. can be found in the literature for the optimal design of hybrid energy systems. These conventional techniques tend to get trapped in local minima, quite often. To avoid this problem, meta-heuristic algorithms, such as, particle swarm optimisation (Abdoos and Ghazvini Citation2018), genetic algorithm (Isa, Tan, and Yatim Citation2017), grasshopper algorithm (Bukar, Tan, and Lau Citation2019), firefly-inspired optimisation (Kaabeche, Diaf, and Ibtiouen Citation2017), etc. have been proposed in the literature for the design of different types of hybrid systems. HOMER Pro® is another popular tool used for the optimisation of such systems. It is used to carry out simulation, optimisation, and sensitivity analysis to design energy systems (Shezan, Das, and Mahmudul Citation2017; Mathur et al. Citation2019; Abdin and Mérida Citation2019; Shezan, Al-Mamoon, and Ping Citation2018; Shezan and Ping Citation2017). However, software tools have inherent shortcomings, including black box coding and high computational time requirement compared to other techniques.
This work aims to contribute to the existing body of work by proposing an optimal design for grid-connected PV systems through structured methodology and analysis of numerical results, using a case study in India. The system configuration has been optimised based on the lowest annualised cost. A comparative study with the conventional grid-only configuration has also been carried out. Sizing of renewable energy systems (RES), in general, is a complex scenario where often conflicting objectives need to be balanced. Myriad factors, including the profile of energy demand, local climatic conditions and, applicable energy prices affect the performance of the renewable-based power generators, energy storage capacity, etc. In the literature, not many studies are available to deal with optimisation of PV-based systems considering emissions and PAR of grid energy as objective functions (Mayer, Szilágyi, and Gróf Citation2020). Some studies available in the literature only consider the environmental aspects arising out of implementation of PV systems as compared to some baseline such as a conventional energy system (Hafez and Bhattacharya Citation2012; Mason et al. Citation2006). In some studies, authors have applied emission penalties to account for emissions (Adefarati and Bansal Citation2019).
This study uses a multi-objective cuckoo search (MOCS) to optimise the proposed PV-storage design based on lower annualised costs, lower emissions and lower PAR. Casting the problem as a multi-objective optimisation problem with conflicting objectives offers system designers several optimal solutions to select from the Pareto front, based on some subjective criteria.
Most of the studies in the literature on optimisation of PV systems consider a fixed lifetime for ESSs. However, this is not the case in practice, and battery lifetime is highly affected by its usage pattern and ambient conditions, among other parameters. In this work, the battery life is calculated using a micro-cycle zero-crossing approach considering the effect of stress factors, including depth of discharge (DOD) and temperature on the battery lifetime. It is observed that the battery life obtained using this algorithm turns out to be significantly lower as compared to a fixed-life assumption.
Moreover, to the best of the authors’ knowledge, there is hardly any study in the literature, which considers the effect of grid outages on the techno-economic performance of a PV system. In this work, the effect of grid outages on the system’s annualised cost has been investigated. It is observed that the grid outages have a tremendous effect on the annualised cost of the system, owing to considerable variations in required storage.
The selection of CS algorithm (Yang and Deb Citation2010) for optimisation of the proposed system is based on some key advantages this algorithm offers. It has been proven that the algorithm satisfies requirements for global convergence and thus displays guaranteed global convergence properties (Zhang, Wang, and Wu Citation2012). For multimodal optimisation, too, cuckoo search can usually converge to the global optimality as compared to particle swarm optimisation, which may converge to a local optimal (Srivastava et al. Citation2012). CS has been proven to be more effective over benchmark functions than other methods like GA and PSO. Another useful characteristic of cuckoo search is that its global search uses Lévy flights instead of standard random walks. Since Lévy flights have infinite mean and variance, exploration of the search space becomes more efficient than the methods that adopt standard Gaussian process (Xu, Liu, and Lv Citation2016). The performance of CS has been compared with Grey Wolf optimiser (Mirjalili, Mirjalili, and Lewis Citation2014). The hunting behaviour of grey wolves inspires the GWO algorithm. Lesser number of control parameters and ease of implementation have made GWO a quite frequently used optimisation algorithm for various applications. GWO, however, depicts poor exploration and tends to get trapped in local optima. A hybrid algorithm is proposed to overcome this, which integrates GWO with a modified version of CS algorithm, which uses a diminishing Gauss distribution instead of random walk to update the nests. It is observed that the proposed improved hybrid Cuckoo Search-GWO algorithm leads to a lower annualised cost for the proposed design as compared with other algorithms.
The remainder of the work is organised as follows: Section 2 discusses the design of the proposed grid-connected PV system along with the functioning of the various components. Section 3 presents mathematical modelling of the proposed system. Energy management strategy of the proposed system is presented in section 4. Section 5 presents the details of the optimisation algorithms. Section 6 discusses the details of the case study under consideration. Section 7 discusses the results obtained using the proposed algorithms. Section 8 concludes the work along with recommendations for future direction.
2. SYSTEM DESIGN
The proposed energy system consists of combination of PV modules and ESS (B). Supply from the grid (G) is also available to meet the energy demand. depicts the schematic of the proposed PV/B/G configuration. The energy output of the sources is considered as constant in each time slot which are of 1-hour duration each. The subsequent subsections present a description of the system components.
2.1 PV module
PV module is a combination of several solar cells connected in parallel and series combinations. The output power of a PV module is majorly dependent on the incident solar radiation, ambient temperature and solar cell properties. The power output of a PV cell at any instant is expressed as shown in EquationEq. (1(1)
(1) ) (Singh and Kaushik Citation2016).
Usually, PV modules are kept at an inclined position for collecting higher quantum of solar radiation. The hourly global solar radiation on an inclined surface is obtained using the isotropic method (CitationLiu and Jordan). It consists of three solar radiation components i.e. beam, isotropic diffuse and isotropic ground reflection. The total hourly solar radiation on a tilted surface is given as follows (Talebizadeh, Mehrabian, and Abdolzadeh Citation2011):
where, ω1 and ω2 are related to the start hour and the end hour, respectively.
2.2 Energy storage system
Solar energy is intermittent; thus, requiring storage of electrical energy for future use, when it is not available in sufficient amount to meet the demand. Battery banks are used for the storage of electrical energy. These are charged when excess power is available and are used to supply power in case of power demand being unmet by PV. State of charge (SOC), at any given time, represents the available capacity of a battery bank.
2.2.1 Battery usage model
The battery lifetime is estimated by first simulating the system design over a period of one year. Based on the SOC profile obtained for the battery bank, using the overall battery usage model (Narayan et al. Citation2018), lifetime of the battery is calculated. Accordingly, the cost of replacement of the batteries has been calculated. The battery lifetime is estimated using the average DOD and average temperature during the battery operation, using the coarse average approach. In this approach, the average values of DOD and temperature are obtained as shown in EquationEqs. (6)(6)
(6) and Equation(7
(7)
(7) ), respectively.
Using the average DOD, the battery life is estimated using EquationEq. (8)(8)
(8) (Narayan et al. Citation2017):
2.3 Solar inverter
Solar inverters are used to convert DC power to AC power. These inverters also perform the function of DC/DC converters and DC/AC conversion along-with the function of MPPT controllers and charge controllers. Solar inverter receives DC power from PV modules/ESS and converts it to AC power to serve AC loads and to feed power to the grid. If the energy is to be fed to the ESS, the device operates through DC/DC converters and charge controllers to transfer DC power. summarises the technical and economic data for various components of the proposed design.
Figure 1. Proposed system design
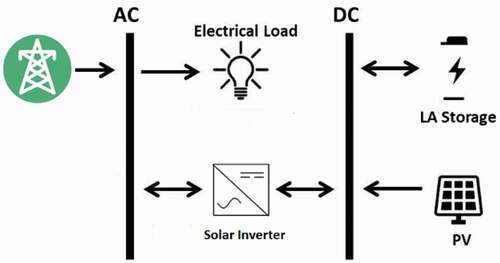
Table 1. Technical and economic specifications
3. MATHEMATICAL MODELLING OF THE PROPOSED SYSTEM
The mathematical models for components of the proposed system are presented in this section. Further, the energy management strategy of the system is discussed.
3.1 Photovoltaic system
The power output of a PV array at any instant is expressed as shown in EquationEq. (9)(9)
(9) .
The total cost of PV system is the sum of initial cost and the maintenance cost over the lifetime, is given as follows:
3.2 Modelling of the ESS
In this study, lead-acid battery banks have been chosen for energy storage. The battery storage is subject to the following constraints:
Battery Charging /Discharging is expressed in EquationEqs. (14)(14)
(14) and (Equation15
(15)
(15) ), respectively.
SOC of battery bank based on charging /discharging is given as:
For, the storage charging efficiency ( and discharging (
efficiencies have been taken as 0.9. The battery charging/discharging rates affects the battery lifetime. Lower rates lead to higher battery lifetime. In this study, the battery charging rate have been kept at 0.15 C. The total cost of ESS is given as follows:
3.3 Modelling of the grid
In the grid-connected mode, utility is considered as a backup for the system in case of energy deficit, when the energy demand is not met by PV and ESS, combined. Whereas, if the energy produced is higher than the load, surplus is sold back to the grid. While calculating the net total expenditure on grid-power, a net-metering approach is adopted as per the existing local norms. The monthly local fixed cost for the grid connection is given by: . The variable cost for buying electricity from the grid,
, while, revenues from selling of electricity to the grid,
. The net cost of purchase/sell of electricity from/to the grid is given as follows:
4. PROBLEM FORMULATION
The work proposes a methodology for an optimal design of a grid-connected photovoltaic storage system (PV/B/G) considering battery degradation, which can meet the energy requirement at the minimised annualised cost, primarily. Further, multi-objective optimisation has been carried out to obtain optimum solutions to simultaneously optimise: lower annualised cost, lower PAR and lower GHG emissions. The following assumptions are made during this study: (i) The variations in PV output/ battery output/load/grid power are considered on an hourly basis, (ii) the total area availability of open spaces for PV installations is considered to be 6000 m2, (iii) effect of wind speed on PV cell temperature is ignored, (iv) lifetime of PV modules is considered to be 25 years, for inverters it is considered to be 10 years.
4.1 Energy management strategy
As shown in , the proposed system design consists of multiple elements, outputs of which are time-varying in nature, similar to the load, which also varies with time. As such, to control the dispatch of power reliably, a rule-based strategy is required. The power generated from the PV is first utilised to fulfil the load requirements. Any additional power is used to charge the battery bank, subject to the condition that SOC does not exceed maximum SOC of the battery. If the load not being met by PV output, the remaining demand is fulfilled through the battery bank; even then, if some power remains unmet, grid supply is used to meet the load requirements. The operational strategy is detailed out in the following steps:
Scenario I: Any excess power generated by the photovoltaic modules, is firstly, utilised for battery charging, if the battery
. The battery is charged subject to the maximum SOC of the battery.
For, and
Remaining power, if any, is sold to the grid and is computed as follows:
(ii)Scenario II: If the energy from the PV source is lower than the load requirement, battery is discharged to supply the load, given as follows:
For, >
(t) and
(iii)Scenario III: If the power delivered by the battery and PV source together is less than the load, power from the grid is purchased to fulfil the demand.
For, , we get:
(iv)Scenario IV: In case the grid power isn’t available due to outage, the deficit energy is taken as loss of power (LPS), which is calculated as given in EquationEq. (24)(24)
(24) .
4.2 Single-objective optimisation
The objective for the single-objective optimisation is to determine the optimal values for PV, ESS and Inverter sizing, along with quantum of energy bought/sold to the grid for the proposed energy system design at a minimised annualised cost, with a desired level of reliability; measured using Loss of power supply probability (LPSP). Number of PV panels (Npv) and number of battery banks (Nb) have been considered as the design variables. The mathematical formulation of the objective function is given as follows:
subject to the following constraints:
Annualised cost of any component, x, is given as:
4.3 Multi-objective Optimisation
Multi-objective optimizationis aimed to arrive atthe best solution among different objectives, usually conflicting ones. In case of conflicting objectives, it may not be possible to find a unique solution that simultaneously optimise all the functions, instead a set of solutions, known as Pareto front, is obtained. The obtained Pareto front represents the best trade-off between all the objectives of the problem at hand. A multi-objective minimisation optimisation problem for k objectives can be formulated as:
min. {f1(y), f2(y), …, fk(y)}
s.t. yY
where k ≥ 2, set Y is the feasible set of decision vectors. A solution x1∈X is called Pareto optimal if there does not exist another solution that dominates it.
For the proposed design three objectives to be minimised simultaneously are: Annualised cost of the system, PAR and GHG Emissions, given as follows:
Objective-I: Minimise
Objective-II: Minimise
Objective-III: Minimise
5. OPTIMISATION
The proposed design has been optimised using CS and, GWO and hybrid Cuckoo Search-GWO algorithm (HCSGWO) to minimise the total annualised cost of the proposed energy system. The performance of the proposed algorithm is compared with the performance of the classical CS and GWO algorithms. For, multi-objective optimisation, Multi-Objective CS (MOCS) has been used. Following sub-sections provide an overview of CS, GWO and, MOCS and HCSGWO algorithms.
5.1 Cuckoo search optimisation
Cuckoo search is a meta-heuristic algorithm that draws inspiration from the breeding behaviour of cuckoos (Yang and Deb Citation2010). A cuckoo lays an egg (candidate solution) and drops it into other bird’s nest. Cuckoos adopt myriad strategies of the host birds’ infants to ensure the survival of their offspring. Cuckoo search algorithm combines this behaviour of cuckoos along with Lévy flights to generate new candidate solutions for replacement of lower quality solutions in the population. Lévy flights represents a random walk model, characterised by initial smaller random step sizes followed by larger ones (Zhang, Wang, and Wu Citation2012). The quality of any candidate solution is considered as proportional to the corresponding objective function value. At the end of each generation, a fraction, pa∈[0,1] of the population which essentially are the solutions having the lowest fitness values, are replaced with new solutions, randomly generated.
For multi-objective optimisation, with Q different objectives, the rules of original CS are modified as follows (Yang and Deb Citation2013): A cuckoo lays Q eggs at once, and puts them in a nest, randomly selected. Egg ‘q’ represents the solution corresponding to the qth objective. Every nest is abandoned according to a probability, pa, while a new nest with ‘Q’ eggs is built based on similarities of the eggs. q solutions for nests j are evaluated, if the solutions of nest j dominate those of nest i, the latter are replaced by another solution set of nest j. To mimic the fact that the probability of discovery of similar eggs of the host is less. Hence, new solutions are generated in proportionate to their difference.
where, represents samples, t indicates the iteration, and α ≻ 0 is the step size. Lévy (λ) is computed as:
To provide the difference between solution quality, ‘α’, is generated based on the expression shown below:
5.2 Grey Wolf Optimizer
GWO, another nature-inspired meta-heuristic algorithm, is inspired from leadership hierarchy characteristics of the grey wolves, known to be great predators (Mirjalili, Mirjalili, and Lewis Citation2014). Grey wolves are divided in to two broad classes. The first class is represented by the leading wolves named as: Alpha, Beta and Delta. The second class of wolves, omega, submit to all the other dominant wolves. The hunting process is carried out in three broad steps. At first, the wolves track the prey, second step entails the encircling of the prey with the assistance of leaders, in the end, the prey is attacked to complete the hunting process. The fittest solution is designated as alpha (α), second as beta (β) and third best solutions as delta (δ), respectively. The remaining possible solutions are assumed as omega (ω). The optimisation process begins with generation of a random population of grey wolves (candidate solutions). Over successive iterations, alpha, beta, and delta wolves estimate the probable position of the prey. The best three solutions obtained at iteration, are saved. The position of the search agents is updated towards the best search agent, thus, the updated position vector of the ω wolf is given as:
The encircling of the optimum (prey) is represented by the following equations:
where, Z = 1,2,3.
where, and
are uniformly distributed random vectors, whose components lie in the range (0–1), α linearly decreases from 2 to 0, with each iteration.
5.3 Hybrid cuckoo search-GWO Algorithm
It is observed from EquationEq. (37)(37)
(37) that in the classical GWO approach, the search agents are updated using the positions of individuals with high fitness values. This results in poor capability for global-search, and a tendency to be trapped into local optimum. Lévy flight is a random walk model, where the step lengths follow Lévy distribution. It is characterised by small random steps initially, which are replaced by large step sizes later on. This ensures that the search does not get trapped in local optimum. Based on this, CS algorithm is integrated with GWO, in order to improve the performance of GWO.
However, the reliability on random walk, results in difficulty to achieve faster convergence. To achieve faster convergence, while generating new solutions, a diminishing Gauss distribution is used (Zheng and Zhou Citation2012):
To further improve the performance of the algorithm, during initial generations, the value of α is kept high enough to increase the diversity of solution vectors. However, during the final generations, for fine-tuning of solutions, values of α is kept low (Valian, Mohanna, and Tavakoli Citation2011):
Figure 2. Monthly average GHI for the site under consideration
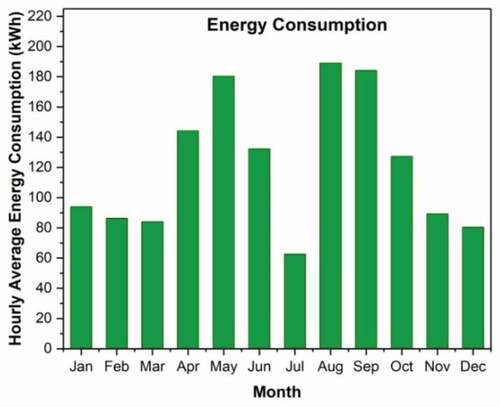
Figure 3. Month-wise average hourly energy consumption
6. CASE STUDY
The proposed system is designed to meet the load demand of an educational institute located in Gautam Buddh Nagar district, in Northern India. depicts the month-wise daily average of load requirement at the site under study. The annual average hourly load is approximately 135 kWh. The annual mean value for GHI at the site is 5.16 kWh/m2/day. depicts month-wise average GHI values for the location (Solar Radiation Database Citation2019).The proposed system design consists of multiple elements including PV arrays, storage systems, etc. The outputs of these elements are time-varying in nature, similar to the load, which also varies with time. For each hourly duration, the total power output of PV set up is monitored. Power generated from the PV is first utilised to fulfil the load requirements; any additional power is used to charge the battery bank. In a scenario where PV output is unable to meet the load, the remaining demand is fulfilled through battery. If some load demand is still not met, grid supply is used to meet the load requirements. Any excess power from the PV is sold back to the grid.
7. RESULTS AND DISCUSSION
The optimal configuration obtained for the proposed grid-connected PV system (PV/B/G), using various bio-inspired algorithms for the single-objective case is presented in . The optimal results indicate that the annualised cost of the system along with the total number and cost of PV modules, ESS, inverters and number of units of energy bought/sold from/to the grid. It is observed from that, as compared to CS and GWO, the annualised cost of the energy system as obtained using the proposed HCSGWO is lower by 1.7% and 1.4%, respectively. presents a comparative performance of PV/B/Grid and Grid-only configurations. The battery life obtained is approximately 4.12 years. On accounts of annualised cost and GHG emissions, PV-B-Grid shows better performance. The annualised cost for the proposed systems is lower by as compared to the conventional grid-only system by 32.27%. GHG emissions due to the proposed system are lower by 71.9% as compared to the GHG emanations from the use of electricity sourced through the grid-only model. However, the peak to average ratio (PAR) for the proposed configuration is higher as compared to the Grid-only configuration. shows the results for energy throughput through various sources. For PV/B/G configuration, PV is the dominant producer of electricity with a percentage of 78.9% of the total generated power.
Figure 4. Variation in various energy sources for June 01
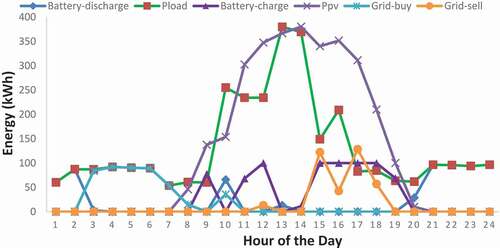
Figure 5. Variation in annualised cost of the system with batterycharging/discharging rates
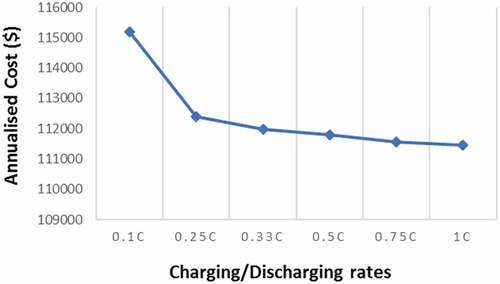
Table 2. Optimal configuration of proposed PV/B/grid obtained using HCSGWO algorithm for the single-objective case
Table 3. Comparison of minimised annualised cost obtained using different algorithms for the single-objective case
Table 4. Performance comparison of various configurations for the single-objective case
Table 5. Technical results for the proposed model
depicts the variation in load, PV output, battery charging/discharging and energy sold to the grid and energy bought from the grid for a single day. It is observed that early in the morning the battery and the grid power is used to fulfil the load while during the day hours load is met by the PV power mostly, towards the evening the battery is charged by the excess PV power. shows the variation in Annualised cost of the system with battery charging/discharging rates. It is observes that the annualised cost of the system reduces with increased battery charging/discharging rates. Initially from 0.1 to 0.25 C the reduction in annualised cost is 2.69%; however, the reduction in annualised cost is less pronounced for any further increase in the charging/discharging rates. This could be explained by the fact that higher discharging rates allows the batteryto meet higher load demand within the same duration. Similarly, a higher charging rate allows for faster charging of the battery which could lead to better utilisation of the PV power. The multi-objective optimisation provides a frontier of all the Pareto-optimal design solutions, which assists in examining the trade-off between the various objectives in our study. The different sets of decision variables of all Pareto-optimal solutions are shown in . It can be observed from the table that huge environmental benefits, as high as 15% can be obtained by an increase in annualised cost of the system by approximately 6.5%, however, the PAR also increases by around 11%. Also, by investing around 37.2% more in annualised cost, would lead to a reduction in emissions by around 27.2% but along with an increase in PAR by around 37%.
Table 6. Pareto front for tri-objective MO optimisation obtained using MOCS
It is observed that for Pareto front-1, has a power of 535 kWfor PV panels. This solution corresponds to COE of 0.179 $/kWh, an LPSP of 0.0199, and a RF of 75.37%. This solution displays highest COE among all the other solutions. For pareto front-18, COE of 0.139 $/kWh, an LPSP of 0.0142, and a RF of 83.65%. The RF for this solution is highest among all the other solutions.As evident, multi-objective optimisation approach offersthe designer a set of widely varying solutions to make a selection.
7.1 Sensitivity analysis
Several factors, that are subject to uncertainty, impact the design of optimal configuration of energy systems. Thus, it is important to assess the robustness of the model against the variations in these parameters. Factors such as electricity grid prices, energy consumption, etc. can have a significant effect on the annualised cost of the systems. depicts the variation in annualised cost with increase in grid prices and load. The effect of increase in grid prices of electricity on the annualised cost for both the systems is assessed. A variation in grid prices at the rate of 1%, 3%, 5%, 7% and 10%, respectively, has been considered to account for increase in the price of electricity made available by the utility grid. The results show that with the increase in grid prices, the annualised cost of both the systems increases, but the increase is more pronounced in the case of grid-only systems. An increase in grid energy prices by 1% leads to increase in the annualised cost for the PV/B/G system by only approximately 0.6%, while for the grid-only system, the annualised cost rises by an increase in the grid prices by a factor of 0.9%. Similarly, an increase in grid energy prices by 10% leads to increase in the annualised cost for the PV/B/G system by approximately 3.8%, while for the grid-only system, the annualised cost rises by a factor of 9.9%. Thus, indicating that the effect of any change in grid prices, would not lead to any significant increase in the annualised cost for the PV/B/G system.
Increase in energy demand because of capacity addition or increased energy usage has also been taken into consideration for the site under consideration. The effect of increase in load at the rate of 1, 3, 5, 7 and 10 percentage points, respectively, has been evaluated. It is observed that the annualised cost for the proposed system increases by 5.33% for an increase in load by 5%, while for an increase in load by 10%, the increase in annualised cost is 12.11%, while for the grid- only system, the increase is 5% and 9.99%, respectively. Also, it is observed that increase in load leads to significantly larger PV capacities, while the change in the storage size isn’t that pronounced.
Figure 6. Variation in annualised cost with Grid price
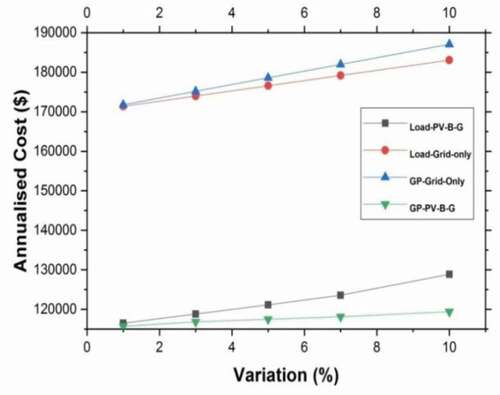
Figure 7. Variation in annualised cost with variation in instances of grid outages
7.2 Effect of grid reliability
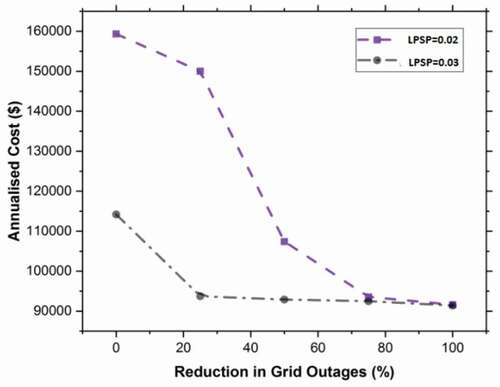
Many a times, grid power may be unavailable which might happen due to several reasons such as system failure, excessive demand etc. In India, a lot of locations do not have a reliable supply of grid-power leading to frequent grid-outages. In the case of site under-study, 532 instances of hourly grid outages were recorded on an annual basis. The effect of variation in grid outages on annualised cost has been investigated. depicts the variation in annualised cost with various levels of grid unavailability levels: 0%, 25%, 50%, 75% and 100% for reliability levels at LPSP-2% and 3%. It is observed that grid outages have a significant effect on annualised cost of the system. For the case of LPSP (3%), reduction in grid outages by 25%, leads to a reduction in annualised cost by 6.22%. This effect is more pronounced for the case of LPSP (2%), where a similar reduction in outages leads to a reduction in annualised cost by 17.92%. If the grid outages are reduced to zero, the reduction in annualised costs is 20% and 42.4% for LPSP (3%) and LPSP (2%), respectively.
The study provides an insight into medium-scale deployment of a grid-connected PV-storage system in India. The proposed methodology and the results obtained provide important information for better management of energy demand. Some of the managerial outcomes of the study are elaborated as follows:
It is observed that the operating conditions (temperature and battery DOD) have a great effect on battery degradation which in turn has a significant effect on battery life and affects the reliability of load being met adequately. Hence, the battery needs to be stored and operated at lower ambient temperatures and lower DOD for extended life of battery.
The proposed methodology helps in calculating the battery life and hence a battery replacement schedule can be prepared and planning for replacement of battery storage can be done in advance. Battery replacement needs to be carried out at regular intervals as obtained through system optimisation process in order to ensure the overall reliability of the system.
Given that the grid is not reliable, as discussed in the presented case study, based on the intermittency of the grid, decision to increase/decrease battery sizing needs to be undertaken. With increased grid-outages, the size of the battery needs to be increased to meet the load demand in an efficient manner.
For known periods of peak demand, battery can be used to fulfil the load rather than grid, which would help in reducing the fixed demand charges for grid power.
8. CONCLUSION
This research adds to the knowledge about the potential of PV-storage systems and contributes to the cost-effective and efficient design of PV based energy systems. In this work, an approach for optimal sizing and scheduling of a grid-connected PV system integrated with storage has been proposed. The reliability of the system is considered using LPSP as one of the design parameters. The performance of the proposed energy system has been compared with the grid-only configuration. For the single-objective case of minimising annualised cost, it is concluded that the proposed design shows better performance based on both annualised cost and emissions. However, the conventional grid-only system shows better performance on the PAR aspect. Analysis of the results of the study indicate that the proposed system will result in a more environment friendly alternative in comparison with the conventional energy sources even in terms of reliability and cost effectiveness. Multi-objective optimisation leads to a more subtle understanding of the proposed set-up design, reflecting the middle ground of compromises between conflicting objectives effectively. It is observed that significant environmental benefits can be obtained at very small additional investments. It is also observed that reliability of the grid has a huge impact on the system sizing and performance. Results show that reduction in grid-outages leads to a sharp reduction in annualised cost and storage capacity. Use of energy storage integrated with PV system helps to overcome the reliability issues associated with intermittent grid power. The study doesn’t take PV degradation under consideration, which could be explored for future work. As a future extension of this work, methods to achieve improved battery performance and lifetime could also be explored.
Nomenclature
Table
Disclosure statement
No potential conflict of interest was reported by the author(s).
Additional information
Notes on contributors
Vinay Anand Tikkiwal
Vinay A. Tikkiwal is an Assistant Professor in the Department of Electronics and Communication Engineering, Jaypee Institute of Information Technology, Noida, India. He obtained his Bachelor of Engineering in Electronics and Communication from M.B.M. Engineering College, Faculty of Engineering, JNVU, Jodhpur, India and Master of Science in Electronics from the School of Electrical and Electronic Engineering, NTU, Singapore. His areas of interests include machine learning, energy and micro-electronics.
Sajai Vir Singh
Sajai Vir Singh received his BE degree in Electronics and Telecommunication from NIT Silchar, Assam (India), ME degree from MNIT Jaipur, Rajasthan (India) and PhD from Uttarakhand Technical University. Currently, he is working as an Associate Professor at the Department of Electronics and Communication Engineering of Jaypee Institute of Information Technology, Noida (India). His research areas include neural networks, current mode signal processing and circuits. He has published more than 70 papers in various international journals/conferences. He has served as a reviewer of number of technical international journals like IEEE Transaction on Circuit and System, Micro Electronics Journal, etc.
Hari Om Gupta
Hari Om Gupta obtained his B.E. in Electrical Engineering from the Government Engineering College, Jabalpur. He received his M.E. in Systems Engineering and Operations Research and PhD from Indian Institute of Technology, Roorkee in 1975 and 1980, respectively. Before joining JIIT as the Director, he was working as a Professor in the Department of Electrical Engineering and Dean Faculty Affairs, at Indian Institute of Technology, Roorkee, India. His research interests are in the area of computer-aided design, reliability engineering, power network optimisation and DBMS. He has published over 300 research papers and 35 technical reports. He is a senior member of IEEE, fellow of IE (India), life member of NIQR, ISTE and System Society of India.
References
- Abdin, Z., and W. Mérida. 2019. “Hybrid Energy Systems for Off-grid Power Supply and Hydrogen Production Based on Renewable Energy: A Technoeconomic Analysis.” Energy Conversion and Management 196: 1068–1079. doi:https://doi.org/10.1016/j.enconman.2019.06.068.
- Abdoos, M., and M. Ghazvini. 2018. “Multi-objective Particle Swarm Optimization of Component Size and Long-term Operation of Hybrid Energy Systems under Multiple Uncertainties.” Journal of Renewable and Sustainable Energy 10 (1): 015902. doi:https://doi.org/10.1063/1.4998344.
- Adefarati, T., and R. C. Bansal. 2019. “Reliability, Economic and Environmental Analysis of a Microgrid System in the Presence of Renewable Energy Resources.” Applied Energy 236: 1089–1114. doi:https://doi.org/10.1016/j.apenergy.2018.12.050.
- Adenle, A. A. 2020. “Assessment of Solar Energy Technologies in Africa-opportunities and Challenges in Meeting the 2030 Agenda and Sustainable Development Goals.” Energy Policy 137: 111180. doi:https://doi.org/10.1016/j.enpol.2019.111180.
- An, L., and T. Tuan. 2018. “Dynamic Programming for Optimal Energy Management of Hybrid Wind–pv–diesel–battery.” Energies 11 (11): 3039. doi:https://doi.org/10.3390/en11113039.
- Aslam, S., N. Javaid, M. Asif, U. Iqbal, Z. Iqbal, and M. A. Sarwar. “A Mixed Integer Linear Programming Based Optimal Home Energy Management Scheme considering Grid-connected Microgrids.” In 2018 14th IEEE International Wireless Communications & Mobile Computing Conference (IWCMC), Limassol, Cyprus, 2018; 993–998.
- Bukar, A. L., C. W. Tan, and K. Y. Lau. 2019. “Optimal Sizing of an Autonomous Photovoltaic/wind/battery/diesel Generator Microgrid Using Grasshopper Optimization Algorithm.” Solar Energy 188: 685–696. doi:https://doi.org/10.1016/j.solener.2019.06.050.
- Geleta, D. K., and M. S. Manshahia. “Optimization of Hybrid Wind and Solar Renewable Energy System by Iteration Method.” In International Conference on Intelligent Computing & Optimization, Springer, Pattaya, Thailand. 2018; 98–107.
- Ghaffarzadeh, N., M. Zolfaghari, F. J. Ardakani, and A. J. Ardakani. 2017. “Optimal Sizing of Energy Storage System in a Micro Grid Using the Mixed Integer Linear Programming.” International Journal of Renewable Energy Research (IJRER) 7 (4): 2004–2016.
- Hafez, O., and K. Bhattacharya. 2012. “Optimal Planning and Design of a Renewable Energy Based Supply System for Microgrids.” Renewable Energy 45: 7–15. doi:https://doi.org/10.1016/j.renene.2012.01.087.
- Isa, N. M., C. W. Tan, and A. Yatim. 2017. “Energy Management System for Hospital Building Using Genetic Algorithm.” Journal of Telecommunication, Electronic and Computer Engineering (JTEC) 9 (3–7): 111–118.
- Kaabeche, A., S. Diaf, and R. Ibtiouen. 2017. “Firefly-inspired Algorithm for Optimal Sizing of Renewable Hybrid System considering Reliability Criteria.” Solar Energy 155: 727–738. doi:https://doi.org/10.1016/j.solener.2017.06.070.
- Kumar, V. R., and S. K. Singh. 2018. “Solar Photovoltaic Modelling and Simulation: As a Renewable Energy Solution.” Energy Reports 4: 701–712. doi:https://doi.org/10.1016/j.egyr.2018.09.008.
- Liu, B., and R. Jordan. “Daily Insolation on Surfaces Tilted Towards Equator.” ASHRAE J.; (United States).
- Mason, J. E., V. M. Fthenakis, T. Hansen, and H. C. Kim. 2006. “Energy Payback and Life-cycle CO2 Emissions of the BOS in an Optimized 3.5MW PV Installation.” Progress in Photovoltaics: Research and Applications 14 (2): 179–190. doi:https://doi.org/10.1002/pip.652.
- Mathur, T., V. A. Tikkiwal, T. Gupta, S. Gupta, and A. Kumar. “Optimized Grid-connected Hybrid Energy System Configurations for Telecom Applications in Arid Conditions of Thar Desert.” In 2019 IEEE International Conference on Sustainable Energy Technologies (ICSETS), Bhubaneswar, India. 2019; 219–223.
- Mayer, M. J., A. Szilágyi, and G. Gróf. 2020. “Environmental and Economic Multi-objective Optimization of a Household Level Hybrid Renewable Energy System by Genetic Algorithm.” Applied Energy 269: 115058. doi:https://doi.org/10.1016/j.apenergy.2020.115058.
- Mirjalili, S., S. M. Mirjalili, and A. Lewis. 2014. “Grey Wolf Optimizer.” Advances in Engineering Software 69: 46–61. doi:https://doi.org/10.1016/j.advengsoft.2013.12.007.
- Narayan, N., T. Papakosta, V. Vega-Garita, J. Popovic-Gerber, P. Bauer, and M. Zeman. “A Simple Methodology for Estimating Battery Lifetimes in Solar Home System Design.” In 2017 IEEE AFRICON, Cape Town (SA). 2017; 1195–1201.
- Narayan, N., T. Papakosta, V. Vega-Garita, Z. Qin, J. Popovic-Gerber, P. Bauer, and M. Zeman. 2018. “Estimating Battery Lifetimes in Solar Home System Design Using a Practical Modelling Methodology.” Applied Energy 228: 1629–1639. doi:https://doi.org/10.1016/j.apenergy.2018.06.152.
- Reddy, J. B., and D. Reddy. “Probabilistic Performance Assessment of a Roof Top Wind, Solar Photo Voltaic Hybrid Energy System.” In IEEE Annual Symposium Reliability and Maintainability, 2004-RAMS, Newport Beach, CA, USA. 2004; 654–658.
- Shaahid, S. M., L. M. Al-Hadhrami, and M. K. Rahman. 2014. “Review of Economic Assessment of Hybrid Photovoltaic-diesel-battery Power Systems for Residential Loads for Different Provinces of Saudi Arabia.” International Renewable and Sustainable Energy Reviews Journal 31: 174–181. doi:https://doi.org/10.1016/j.rser.2013.11.055. March 2014.
- Shaahid, S. M., I. El-Amin, S. Rehman, A. Al-Shehri, F. Ahmad, J. Bakashwain, and L. M. Al-Hadhrami. 2010. “Techno-Economic Potential of Retrofitting Diesel Power Systems with Hybrid Wind-Photovoltaic-Diesel Systems for Off-Grid Electrification of Remote Villages of Saudi Arabia.” International Journal of Green Energy 7 (6): 632–646. doi:https://doi.org/10.1080/15435075.2010.529408.
- Shaahid, S. M., and M. A. Elhadidy. 2003. “Opportunities for Utilization of Stand-alone Hybrid (Photovoltaic+diesel+battery) Power Systems in Hot Climates.” International Journal of Renewable Energy 28 (11): 1741–1753. doi:https://doi.org/10.1016/S0960-1481(03)00013-2.
- Shezan, S. K. A., A. Al-Mamoon, and H. Ping. 2018. “Performance Investigation of an Advanced Hybrid Renewable Energy System in Indonesia.” Environmental Progress & Sustainable Energy 37 (4): 1424–1432. doi:https://doi.org/10.1002/ep.12790.
- Shezan, S. K. A., N. Das, and H. Mahmudul. 2017. “Techno-economic Analysis of a Smart-grid Hybrid Renewable Energy System for Brisbane of Australia.” Energy Procedia 110: 340–3456. doi:https://doi.org/10.1016/j.egypro.2017.03.150.
- Shezan, S. K. A., and H. W. Ping. 2017. “Techno-Economic and Feasibility Analysis of a Hybrid PV-Wind-Biomass- Diesel Energy System for Sustainable Development at Offshore Areas in Bangladesh.” Current Alternative Energy 1 (1): 20–32. doi:https://doi.org/10.2174/2405463101666160531145048.
- Singh, S., and S. C. Kaushik. 2016. “Optimal Sizing of Grid Integrated Hybrid Pv-biomass Energy System Using Artificial Bee Colony Algorithm.” IET Renewable Power Generation 10 (5): 642–650. doi:https://doi.org/10.1049/iet-rpg.2015.0298.
- Singh, S. S., and E. Fernandez. 2018. “Reliability Assessment of a Remote Hybrid Renewable Energy System Using Monte Carlo Simulation.” International Journal of Renewable Energy Technology 9 (3): 368–381. doi:https://doi.org/10.1504/IJRET.2018.093025.
- Solar Radiation Database, <nsrdb.nrel.gov>, accessed 7 June 2019.
- Srivastava, P. R., M. Chis, S. Deb, and X. Yang. 2012. “An Efficient Optimization Algorithm for Structural Software Testing.” International Journal of Artificial Intelligence 8 (12): 68–77.
- Talebizadeh, P., M. Mehrabian, and M. Abdolzadeh. 2011. “Prediction of the Optimum Slope and Surface Azimuth Angles Using the Genetic Algorithm.” Energy and Buildings 43 (11): 2998–3005. doi:https://doi.org/10.1016/j.enbuild.2011.07.013.
- Valian, E., S. Mohanna, and S. Tavakoli. 2011. “Improved Cuckoo Search Algorithm for Feedforward Neural Network Training.” International Journal of Artificial Intelligence & Applications 2 (3): 36–43. doi:https://doi.org/10.5121/ijaia.2011.2304.
- Xu, H., J. Liu, and Z. Lv. 2016. “Structural Damage Identification Based on Modified Cuckoo Search Algorithm.” Structural Engineering and Mechanics 58 (1): 163–179. doi:https://doi.org/10.12989/sem.2016.58.1.163.
- Yang, X., and S. Deb. 2010. “Engineering Optimisation by Cuckoo Search.” Int. J. Math. Model. Numer. Optim 1 (4): 330–343.
- Yang, X., and S. Deb. 2013. “Multiobjective Cuckoo Search for Design Optimization.” Computers & Operations Research 40 (6): 1616–1624. doi:https://doi.org/10.1016/j.cor.2011.09.026.
- Zhang, Y., L. Wang, and Q. Wu. 2012. “Modified Adaptive Cuckoo Search (MACS) Algorithm and Formal Description for Global Optimization.” International Journal of Computer Applications in Technology 44 (2): 73–79. doi:https://doi.org/10.1504/IJCAT.2012.048675.
- Zheng, H., and Y. Zhou. 2012. “A Novel Cuckoo Search Optimization Algorithm Based on Gauss Distribution.” Journal of Computational Information Systems 8 (10): 4193–4200.