
ABSTRACT
Emergy Accounting (EMA) has gained attention in recent times as an environmental accounting tool. So far, it has been used for analysis at national and regional levels; however, the EMA has not been utilised in a business performance analysis context. When used in a business context, EMA reveals the interface between industrial activity and the environment. EMA analysis can provide opportunities in measuring the social, economic, and environmental performance of the industry in a sustainability context. Unlike other evaluation methods, which are ‘demand-side’ or ‘user-side’ concerned, EMA analysis is a ‘donor-side’ approach. This research work illustrates the selection of suppliers based on the amount of emergy consumption. Emergy indicators, such as Emergy Yield Ratio (EYR), Emergy Sustainability Index (ESI), Environmental Loading Ratio (ELR), Emergy Self-support Ratio (ESR), Renewability percent (%R), Emergy flow Density (ED), and Emergy Investment Ratio (EIR) are estimated. The results show that there is enough room for improving emergy performance in the tannery industry. The result also highlights a significant variance in the input of indigenous renewable and non-renewable resources and imported resources among the investigated tanneries. Based on the outcomes, the study provides insights on the industries’ consumption of renewable and non-renewable resources.
1. Introduction
Evaluating the sustainable performance of the suppliers involved in the supply chain network has been a major concern in the research on supply chain management. In this connection, several matrices and frameworks have been developed to access the economical aspect of the suppliers. However, these frameworks have the limitation that it only measures the economic benefit from the user-side and fails to consider the donor-side contribution. For effective evaluation of the suppliers on the basis of sustainable performance, it is necessary to measure the donor-side contributions which may give a more accurate picture of the overall sustainable performance of the supplier. Also, it represents the environmental performance of the suppliers. All the products used by human society are the result of continuous support of the environment. Natural resources from the environment offer many benefits for human society. However, during the past few decades, because of rapid industrialisation activities, the human community has exploited the environment in an exponential manner (Abel et al. Citation2021). As a result, human society faces certain undesirable events like icebergs’ melting, a soaring rise in temperature, and human-animal conflicts. Considering these events, the Paris Agreement, an international treaty, was signed in 2016 to control the global temperature of 1.5°C (Livingston and Rummukainen Citation2020). To avert the undesirable consequences of a rise in global temperatures, industrial activities must be streamlined to meet sustainability criteria (Barbosa, Castañeda -Ayarza, and Lombardo Ferreira Citation2020). One of the significant industrial actions to be checked and controlled is supplier selection as it directly insists the industries to be sustainable in their manufacturing practices. Evaluating the supply chain network’s performance on the basis of donor-side consumption is gaining significant importance in the last few decades (Das and Rangarajan Citation2020).
In this context, an approach called Emergy accounting (EMA) developed by Odum (Citation1996) has been used as an evaluation strategy for evaluating ecological and human systems from a donor-side perspective. The term ‘emergy’ is defined as the memory of energy previously used in the generation of products and services. In EMA, the various available energy values of social, environmental, and economic sources are converted into the same unit of solar emergy (sej). Since the concept of EMA was introduced, it has been extensively used in various fields (Chen et al. Citation2017), such as agriculture (Moonilall, Homenauth, and Lal Citation2020; Zhao et al. Citation2019a), waste management (Liu et al. Citation2019), petroleum production (Liu, Lin, and Sagisaka Citation2012) and coal mining (Liu, Guo, and Nie Citation2020). Most of the studies using EMA were carried out in a developed country’s context or in the context of China (Chen et al. Citation2006; Su et al. Citation2020; Jing et al. Citation2020). These works have focused mainly on the environmental policy implications for an area. However, these works have not applied the EMA concept for evaluating the sustainable performance of the suppliers in a supply chain network.
To fill this gap, this study aims to apply EMA for sustainable supply chain evaluation from a business perspective. Applying the EMA concept to supply chain management and the industrial sector can promote further research in both fields (Tian and Sarkis Citation2020). Further, it expands the evaluation of supply chain management using the latest environmental measurement and accounting technique. Introducing EMA into the measurement of sustainable performance of supply chain management is an important initiative and a novel approach.
This paper introduces the concept of EMA in sustainable supply chain management. The application of EMA is illustrated with a conceptual supplier selection problem. The introduction of EMA into sustainable supply chain measurement fills the gap of need for a standard performance measure considering both environmental and economic aspect.
The remainder of the paper is structured as follows. In the next section, the tannery industry, the concept of sustainable supply chain and performance measurement is discussed. Then, an overview of the concept of EMA analysis is provided in Section 3. In Section 4, an illustrative example using EMA for supplier selection is supplied. In Section 5, the results obtained are discussed. Section 6 suggests some policy implications. Finally, Section 7 concludes the study.
2. Literature review
This section explains an overview of the tannery industry, the necessity of having a sustainable supply chain, and the importance of performing EMA in supplier selection.
2.1. Tannery industry and supply chain management
In the tannery industry, the raw animal hides/skins are processed, and the animal hides/skins are made suitable for manufacturing leather products (K. Koppiahraj Citation2019). Many industries in developing countries are directly or indirectly linked to the tannery industry. Since the investments required for the functioning of the tannery industry are small, many small-scale industries are involved in tannery operations. The tannery industry also provides employment opportunities for many semi-skilled workers. Though the tannery industry provides large employment opportunities, it pollutes the environment to a large extent. According to (Zhao and Chen Citation2019), every year, around 300 million pieces of animal skins are processed by the global tannery industry resulting in about 300 million tons of wastewater. Most tanneries prefer the chrome tanning process (CTP) in processing the animal skin as the CTP is cost efficient (de Aquim, Hansen, and Gutterres Citation2019). However, the waste generated from chrome tanning has a severe adverse impact on the environment. Besides wastewater generation, the tannery industry also generates a large number of solid wastes. Every year, 600,000 metric tons of chromium-containing solid wastes are generated by the tannery industry (Ocak Citation2018). At the time of supplier selection, most industries were not showing interest in the sustainable industrial performance of the supplier. As sustainable industrial practices are gaining importance, industries engaged in the production or manufacturing have started evaluating the sustainable performance of the raw materials suppliers. Recognising the need for incorporating sustainability, the raw materials suppliers have also started adopting sustainability in industrial operations.
2.2. Sustainable supply chain and performance measurement
Measuring and enhancing supply chain management performance has been gaining significant attention among industries and the research community (Mishra et al. Citation2018). A robust and reliable supply chain network is believed to provide a competitive edge in the volatile business environment (Adenso-Díaz, Mar-Ortiz, and Lozano Citation2018; Dolgui et al., Citation2020). Earlier, the performance of a supply chain network has been analysed by considering whether the required quantity of the goods is delivered in time. In recent times, the performance measurement of the supply chain network is used in various activities, including supplier selection, benchmarking, and project selection. Further, the scope of supply chain performance measurement has been broadened to incorporate the green concept, i.e. green supply chain management. Extending further, our study focuses on the sustainability concept in the supply chain performance measurement, mainly on environmental sustainability.
The first and most important step in analysing sustainable supply chain performance is understanding various supply chain processes and their relationships. For instance, a study by Barratt (Citation2004) argued that despite technological advancement and integration in the supply chain activities, mutual trust and understanding among the different stakeholders involved in the supply chain network is vital for the efficient supply chain management. With proper understanding, the scope of the supply chain network can further be extended towards the green or sustainable concept (Chen and Paulraj Citation2004). The sustainable performance measurement of a supply chain network utilises traditional business metrics such as cost, time, and quality. Depending on the type of measurement technique used, the metrics may vary. As stated in the study of Koppiahraj et al. (Citation2021), measuring the sustainability performance using different assessment techniques will lead to discrepancies in framing a common reference value. For example, when environmental impact assessment (EIA), a sustainable environment measurement tool, is used, it only predicts the possible impact of executing a project.
In evaluating the critical success factors of sustainable supply chain management, (Pandey, Bhatnagar, and Ghosh Citation2021) used an integrated approach of the Analytic Hierarchy Process (AHP) and Interpretive Structural Modelling (ISM). With this integrated approach, the study ranked and revealed the hierarchical relationships among the critical success factors. The study’s outcome indicated commitment from the industrial management for environment-friendly processes and government support as the most critical success factors. Another study by (Nasrollahi et al. Citation2021) regarding sustainable supply chain management applied a structural equation modelling technique to reveal the factors’ structural relationships. By analysing the response of 188 respondents, the study identified energy cost fluctuations and pollution management have strong relationships. (Koberg and Longoni Citation2019) reviewed the progress of global industries in sustainable supply chain management and identified a vast difference in the progress of multinational companies and local companies in adopting sustainable supply chain management practices.
Many sustainability measurement tools EIA, social life cycle assessment (SLCA), a strategic environmental assessment (SEA), and eco-efficiency (EE) analysis, are currently utilised (Shinkhede et al. Citation2021). However, these methods also have limitations. For example, SLCA analysis the advantages and disadvantages involved in product development from a social perspective. SLCA is an extension of the life cycle assessment (LCA) concept. SLCA mainly focuses on how product development affects the environment and society (Hosseinijou, Mansour, and Shirazi Citation2014). For instance, during mining processes, natural resources are consumed in large quantities and have an adverse impact on humans. With SLCA, it is possible to estimate the stage which harms humans. Similarly, SEA focuses on the activities carried out during product development. Eco-efficiency primarily focuses on resource efficiency. Each of these methods is capable of evaluating a specific domain. With each of these techniques, EMA can be integrated as an evaluation tool.
2.3. Research gaps
Based on an earlier literature review, it has been identified that many researchers have studied the concept of sustainable supplier selection. However, it was also noticed that most of the studies concentrated on identifying and ranking the factors to be considered in sustainable supply chain management (Nasrollahi et al. Citation2021; Pandey, Bhatnagar, and Ghosh Citation2021). Also, studies intended to measure the industries’ performance by following several assessment methods. All these assessment methods and earlier studies are approaching sustainable supply chain management from the demand-side or user-side perspective. Nevertheless, a study assessing the sustainable performance of the suppliers from the donor has not been carried out. Taking this into consideration, this study seeks to measure the sustainable performance of animal skin suppliers (tannery) from the donor. For this, EMA has been used in this study. EMA estimates the environmental cost by considering the resources utilised in the process of product development, from the formation of the resource to the current time. For instance, consider mining products, the gold. The extraction of gold requires geological time and several processes. These geological times and processes involved in the production of gold are the collective resources used in gold mining. Hence, when gold is used, all the past resources involved need to be accounted for.
The next section will provide an overview of EMA.
3. Methodology
This section provides detail of EMA and the steps involved in EMA.
3.1. An overview of EMA
Globalisation has resulted in an accelerated pace of industrialisation, which has imposed pressure on the natural ecosystem (Chen et al. Citation2017). As a result, the need to analyse the interaction between the society, economy, and environment has arisen. Realising the need to curb the industries environmental menace, the global environmental monitoring communities have postulated the concept of sustainability. Only after the Brundtland report of 1987 did the concept of sustainability and the need for sustainable development gain attention (Dalampira and Nastis Citation2020). Only then, various evaluation methods like ecological efficiency evaluation, life cycle assessment, and data envelopment analysis have been utilised to measure the industries performance in moving towards sustainability (Ameen and Mourshed Citation2019). Considering this, the industrial community attempts to incorporate the sustainability concept in their economic and environmental activities. Besides considering the competitive edge in a business environment, incorporating sustainability in business activities is gaining attention due to the need to combat increasing global warming and extreme weather phenomenon (Ighalo and Adeniyi Citation2020). However, these measurement and assessment systems have a limitation since they measure performance only from the ‘demand-side’ or ‘user-side’, i.e. carbon emissions and waste generation. Still, a study from the ‘donor-side’ will give a more accurate picture of the industrial sector’s overall sustainable performance. To reveal the interaction between the society, economy, and environment, the concept of EMA has been used for the past few decades. Emergy theory was first proposed by the United States ecologist Odum (Citation1996). The theory emphasises the importance of applying energy system for an open system using thermodynamics and general systems. EMA is referred to as the donor-side method as it accounts for the input from the environment (Brown and Ulgiati Citation1997). EMA can be adopted for several assessments and in particular it is able to identify how resources from the natural system contribute to the economic system. Also, EMA analysis uses a single unit (sej) of measure, which is more related to the environment (Hau and Bakshi Citation2004). EMA has three advantages over other environmental accounting techniques. First, EMA focuses on the donor-side contribution, then, considers the resources acquired during the product development process and finally, uses a single unit of measure (Tian and Sarkis Citation2020).
EMA is a convenient tool as it supports to convert various input flows in a system into a single solar energy unit. In this manner, various systems can be compared directly with each other. Such comparative analysis among the factors or systems may help the industrial practitioners and policymakers in identifying appropriate strategy and measures. EMA measures natural resources like rain, raw materials, water and wind with a single solar unit. Also, it measures labourers involved in the work and the goods and services of the industries.
To convert energy inputs and other flows into a solar equivalent (sej), a Unit Emergy Value (UEV) is used. UEVs are the amount of total environment support required to generate a unit of product flow. In general, UEV units are solar equivalent joules per gram (sej/g). UEVs are called transformity when they are expressed as sej/J. Higher UEV values imply that more emergy is needed to make a unit of a product. UEVs for a wide variety of commodities, resources, and renewable energies are available. UEVs for a resource may be found from earlier research studies, a series of emergy folios (Mark T. Brown Citation2001), and the National Environmental Accounting Database (NEAD). The first one is the NEAD developed in 2012 by the International Society for the Advancement of Emergy Research (ISAER) (https://www.emergysociety.com/). The other one updated in 2017 is NEAD V2.0 (http://www.emergy-nead.com/home). The UEVs in this latest updated version are based on emergy 2016 baseline (Santagata et al. Citation2019; Chen et al. Citation2016; Liu, Guo, and Nie Citation2020). All emergy values refer to a Global Emergy Baseline (GEB). The GEB represents the total annual emergy driving the biosphere. Based on the work of Brown et al. (Citation2016), the GEB was referred to as 12.0E + 24 sej/y. The basic equation used in the calculation of emergy of a product is given as
where emergy of product
; M = mass or energy;
UEV of product
.
The EMA is a three-step process. First, the system or case under study is represented using an emergy system diagram with the system diagrammatic symbols. Then, all the resources maintaining the system (e.g. energy, labour services, and capital flow) are converted into solar emergy equivalents by multiplying the quantity used of each resource with the appropriate UEV. Finally, emergy indicators are calculated to analyse the performance of the system. The emergy indicator (EYR, ELR, %R, ESI, ESR, ED and EIR) analysed in this study are given in ( of Appendix A) along with the description and expressions. The resources used in the study can be classified as indigenous renewable (R) and non-renewable (N) resources and imported renewable and non-renewable resources (F).
Though the EMA provides a better scenario of the resource consumption by the country or region or industries, the problem of uncertainty in the calculation is still debated among the researchers. Most of the studies on EMA are not addressing the uncertainty problem, while few studies are using analytical methods (Yi and Braham Citation2015) and fuzzy-based approaches for addressing the problems (Amaral, Martins, and Gouveia Citation2016). In order to address this uncertainty issue, a sensitivity analysis is performed. Normally, a sensitivity analysis is performed by varying the values of input emergy parameters to analyse the corresponding change in the emergy indicators. Typically, the input parameters considered in the EMA analysis is varied between 10% and 20 % (Spagnolo et al. Citation2020). Sensitivity analysis is performed using the EquationEq. (2)(2) .
where SC is the sensitivity coefficient; I1 and I2 are the corresponding indicators before and after the main parameter change; P1 and P2 are the corresponding parameters before and after change. When SC > 1, it indicates that indicators change more than parameter change; SC < 1, it indicates a small change in indicators than in parameters and SC = 1 means a proportional change.
Most researches carried out using EMA are used for analysing the global, country wise or regional geographical systems. For example, EMA has been considered for global renewable resources (Brown and Ulgiati Citation2016; Geng et al. Citation2017; He et al., Citation2020). Similarly, EMA has been applied in used in variety of processes and systems like coal mining (Liu, Guo, and Nie Citation2020), biogas production (Spagnolo et al. Citation2020), hydropower project (Chen et al., Citation2020), and cement production (Chen et al. Citation2016).
However, only few studies investigate the supply chain performance using EMA. Park, Egilmez, and Kucukvar (Citation2016) analysed the supply chain network involved in agriculture and food production by combining EMA and LCA technique. This study indicate that food production have major impact on the environmental and ecological aspect. Blatt et al. (Citation2020) analysed the supply chain involved in denim jeans and emphasised on reusing the waste jeans as a step to mitigate the wastes. Another study by Alkhuzaim, Zhu, and Sarkis (Citation2021) insisted that EMA will be useful in evaluating the supply chain performance assessment.
When these studies are considered, they are mainly focusing on quantifying the amount of resources consumed during the production. These studies can be helpful for organisational level analysis. However, these studies failed to explain how to link sustainable supply chain with EMA. In this connection, this study EMA is used for sustainable supply chain evaluation. This study focuses on supplier selection based on sustainability.
4. EMA for sustainable supplier selection
In this section, the usage of EMA in sustainable supplier selection is illustrated. Supplier selection is a crucial aspect of the business environment; elements such as cost and time to delivery are commonly considered in supplier selection. Recently, in supplier selection, the sustainable performance of the suppliers is also taken into account. In this regard, this study carried out EMA for selecting suppliers based on sustainability mainly focusing on environmental aspect. The illustration is based on comparative supplier evaluation and selection.
4.1. An illustrative case study
Many evaluation techniques and models are widely used for measuring sustainable supplier selection. This study shows the applicability of EMA in analysing sustainable supplier selection.
In this study, five companies are considered for the supplier selection decision. One is the focal company engaged in leather bag manufacturing. The other four companies are potential suppliers for the focal company’s raw material (processed animal skin) needs. Here, the potential suppliers supply the raw material i.e. leather by processing the raw animal skin. The waste generated during processing stage includes hides and skins having fats, buffing dust, hairs, and sludge from effluents (Rigueto et al. Citation2020). Globally, 6 million tonnes of leather processing waste are generated annually and around 20,000 tonnes of solid waste are produced daily. India annually accounts for 0.3 million tonnes of leather processing waste (Singh Parihar and Kumar Gupta Citation2020). The aim of this study is to assist the focal company in selecting a supplier of raw materials. Each of the four suppliers differs in the basic characteristics like labour capacity, production capacity, and raw materials consumption. The basic characteristics of the suppliers are given in . The location of the selected supplier companies is displayed in .
Figure 1. Locations of the selected companies.
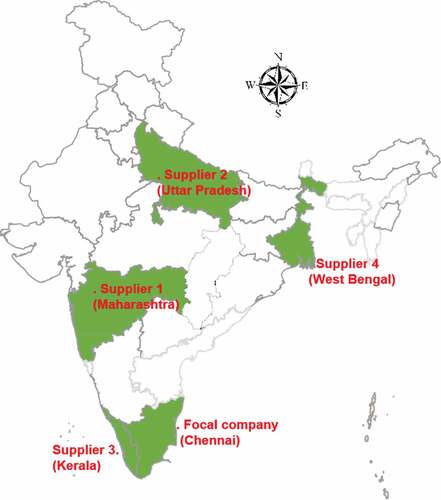
Table 1. Basic characteristic of the suppliers.
Before performing EMA analysis, there is a need to draw a system diagram using the diagrammatic symbols, representing the flow of emergy within the system. The emergy diagram reveals the major components of the system and the interaction among the components. The emergy system diagram for the study is displayed in . It should be noted that in the basic characteristics of the suppliers varies by location, workforce and transportation. These variations influence emergy valuations. Various energy sources from the outside environment drive the system boundary. Each supplier requirement varies depending on the location and characteristics. The legend of the symbols used in the emergy system diagram () is given below the diagram. The legend of the symbols used in the emergy system diagram is given in below the diagram.
Figure 2. Emergy system diagram of a typical supplier.
The emergy flow for each supplier is calculated as shown in Appendix B and is listed in . From , the quantity of renewable resources, non-renewable resources, and imported resources used by each supplier can be understood. Also, the table provides information about the emergy indicators of all suppliers. The focal company may infer better insight about the consumption of resources by each supplier and select the better performing supplier. For example, the amount of renewable and non-renewable resources consumed by each supplier can be inferred. Based on this, each supplier can be compared with others. Overall, with , it is possible to determine which supplier can provide the raw material in an emergy efficient way.
Table 2. Emergy accounting for each supplier. (All data refer to the annual consumption).
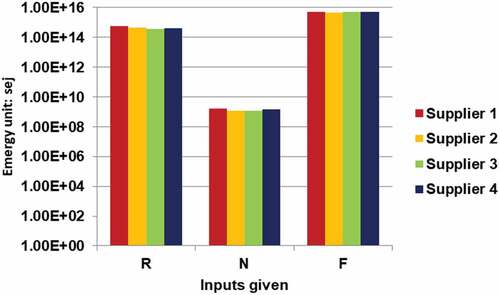
shows the total emergy resources utilised by each supplier. The result shows that Supplier 4 consumes a large amount of emergy in the processing stage. Supplier 2 consumes a smaller amount of emergy in the processing stage. When consumption of non-renewable resources is considered, supplier 1 consumes more and Supplier 3 consumes less. This indicates that Supplier 1 imposes more pressure on the environment and also is less environmentally friendly. Similarly, when the consumption of imported resources is considered, Supplier 4 consumes more and Supplier 2 consumes less. When the overall assessment of the emergy indicators is considered, Supplier 2 would be the best choice for the focal company in this illustrative example.
Figure 3. Total input resources consumed by each supplier.
5. Results and discussion
In this study, an EMA based supply chain evaluation has been introduced to improve the holistic sustainable supply chain measurement. Here, an EMA of four suppliers, having different characteristics, is illustrated. EMA reveals varying renewable, non-renewable and imported consumption of each supplier. The results obtained using EMA will clearly represent the resource consumption of each supplier and thus helps the focal company in selecting a better ‘sustainable partner’.
Using , the emergy indicators for all the four suppliers are calculated and are given in . In this study, six key emergy indicators of the four suppliers are calculated. When the indicator EYR is considered, the value of all the four suppliers is below 5 which is acceptable and appreciable (Zhang et al. Citation2009). The value of EYR for the four respective suppliers is 1.09, 1.11, 1.07, and 1.08. The values of EYR indicate the economic efficiency of the system under study. The higher the value of EYR, the higher the productive efficiency of the system is per emergy invested. The EYR of supplier 2 (1.11) is higher in comparison with other suppliers (supplier 1 (1.09), supplier 3 (1.07), and supplier 4 (1.08)), which insists that the performance of supplier 2 is better than other suppliers. The high value of EYR indicates the ability of the manufacturing firm to utilise the local resources efficiently. The ELR value of supplier 1 is 9.43, whereas the ELR values of supplier 2, supplier 3, and supplier 4 are 10.32, 14.45, and 13.92, respectively. The ELR value shows the pressure created by the economic activities on the environment. The higher the value of ELR, the higher the pressure is on the environment. According to Ulgiati and Brown (Citation2002), an ELR value of more than 10 insists on a serious environmental burden on the environment. Considering this, except for supplier 1, the ELR value of all other suppliers is higher than 10. The ELR value of supplier 1 is also near 10. These high values of ELR indicate that the supplier is highly human-dominated and requires many non-renewable and imported resources for carrying the industrial activities while leaving an adverse environmental impact. The adverse environmental impact puts heavy pressure on the available indigenous resources. This acts as a bottleneck in the industrial progress towards sustainable economic development (Zhong et al. Citation2018; Miao et al. Citation2020). So, all the suppliers considered in this study need to reduce the local ecosystem’s environmental pressure.
Table 3. Calculated emergy indicators.
Then, the ESI values of all the four suppliers under study are less than 1: Supplier 1 (0.12), Supplier 2 (0.11), Supplier 3 (0.07), and Supplier 4 (0.08). ESI values lower than 1 indicate high environmental stress. At the same time, 1 < ESI < 10 indicates that the system is having good economic stability and is progressing well towards sustainability, and ESI > 10 implies the system is undeveloped (Tian and Sarkis Citation2020). When these estimations are considered, the suppliers progress in this study is in a non-progressive stage towards sustainability. In particular, Suppliers 3 and 4 needs to take immediate steps to overcome such a trend as overexploiting indigenous resources. This was supported by the renewability per cent (%R) of Suppliers 3 and 4, which are 6.48% and 6.72% lower than supplier 1 and supplier 2. The R% of Suppliers 1 and 2 are 9.68% and 8.84%, considerably better than Suppliers 3 and 4. R% is considered an aspect for measuring an industry’s sustainable development progress (Danish and Khan Citation2020). The higher the %R, the higher the possibility of the survival possibility of the system and sustainability. Next, the emergy indicator, ESR is significantly important. ESR measures how the environment contributes to the production of the system. The higher the value of ESR, the less the manufacturing system depends on imported resources (Zhao et al. Citation2019b). In our study, the four suppliers’ ESR value is 0.10, 0.09, 0.06, and 0.07. From this, it is evident that Supplier 1 has the highest ESR value and thus, Supplier 1 is more sustainable in practice than other suppliers. The emergy empowers density (ED) is also an important factor to be evaluated regarding sustainability as it determines the possibility of moving towards sustainability. Supplier 4 with the ED of 2.89 × 10¹¹ appears to be the most progressive in sustainability practice. Supplier 4 was followed by Supplier 3, Supplier 2, and Supplier 1 with ED of 2.87 x 10¹¹, 2.01 x 10¹¹, and 1.87 × 10¹¹.
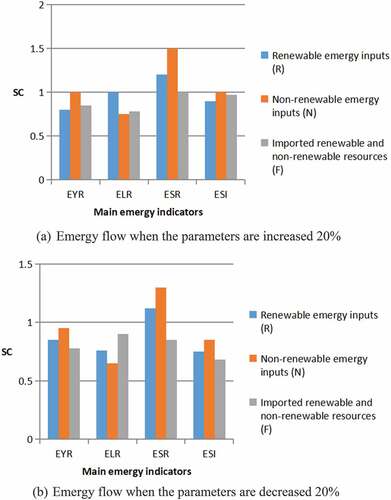
To determine the influence of each input parameters, sensitivity analysis is performed by varying the inputs by 20%. The results obtained in sensitivity analysis are shown in . From the results, it is clear that non-renewable emergy inputs have significant influence in the parameters. When the inputs parameters are increased by 20%, EYR, ELR and ESI increased by 3.75%, 1.25% and 2.05%. Similarly, when the input parameters are decreased by 20%, EYR, ELR and ESI decreased by 2.75%, 2.35% and 1.65%. Hence, by reducing the consumption of non-renewable emergy inputs, the performance of the suppliers can be improved in economic, environmental and sustainable manner.
Figure 4. Sensitivity analysis of the emergy indicators. (a)Emergy flow when the parameters are increased 20%. (b)Emergy flow when the parameters are decreased 20%.
Other than supplier selection, EMA is beneficial in supply chain management for different reasons. One of the important reasons is supplier auditing which allows the buyers to evaluate supplier performance (Yawar and Seuring Citation2018). Supplier audit provides a detailed descriptive assessment of the supplier’s performance. Auditing requires the involvement of both the buyers and suppliers for gathering and analysing information (Rozario and Vasarhelyi Citation2018). Interaction between the buyers and suppliers is very crucial in supplier audit. Through audit, the buyers may suggest alternative materials and techniques to improve environmental performance. The suggestion given through auditing may be used by the supplier in improving environmental performance. For example, in the illustrated case, Supplier 1 consumes a large amount of non-renewable resources when compared to other suppliers. Hence, it could be inferred that Supplier 1 imparts more pressure on the ecosystem than other suppliers. In this connection, Supplier 1 is in a situation to shift towards renewable resources. Here, the focal company can suggest some alternate renewable resources for the supplier to improve environmental performance. Helping the suppliers in improving environmental performance is helpful in sustainable development.
The next use of EMA in supply chain management is supplier quality certification. Certification of a supplier is considered as a mean of measuring and quantifying the supplier’s performance (Blount and Li Citation2020). The certification programme measures the functioning of the suppliers in all the dimensions in meeting the product specifications. Certification programmes such as ISO 9001:2008, QS 9000, ISO 14000, AS 9100, NADCAP/PRI, TS-16949 are commonly used in measuring the industries performance (Noshad and Awasthi Citation2018). The certification program ISO 14000 is a set of international guidelines that measures environmental management system (EMS) followed in the industry. When the environmental performance of the suppliers in this study is considered, it is difficult to get the ISO 14000 certification. So, the suppliers must prefer more environmentally friendly techniques and also choose renewable resources.
Both supplier auditing and supplier certification are critical criteria in supplier quality development. In measuring both these criteria, the EMA will be very useful. The main advantage of EMA is that it measures the contribution of nature to economic systems. Next, in EMA the values and impact of the inputs are presented in a unique way. For example, the amount of renewable, non-renewable and imported resources used by the suppliers is presented separately. This information will help buyers and suppliers to develop a sustainable supply chain.
6. Practical implications
Selecting a sustainable supplier is a complex process for the focal company. In general, any company likes to select the supplier based on cost-effectively timely delivery of the required materials. Particularly, suppliers are selected mainly by concerning cost. In this study, we focus on selecting the suppliers based on environmental and resources perspectives.
India’s tannery sector has been experiencing constant societal pressure as the wastes generated during animal skin processing have an adverse environmental impact (Tak, Tiwari, and Vellanki Citation2020). To change the negative environmental impression in society, the tanneries need to enhance/change their processing techniques to meet vital sustainability criteria. Some techniques, like input-output analysis (IOA) and ecological footprint analysis (EFA), have been utilised for measuring sustainability; however, EMA is utilised in this study because it provides in-depth detail of ecological imbalance and environmental cost (Geng et al. Citation2017). In this study, EMA is performed for four animal skin suppliers. EMA reveals varying renewable and non-renewable resources of the four suppliers. Using the EMA results, the focal company may select the most sustainable supplier. Based on the outcome, the study suggests policy implication on the broad perspective as the transition towards the emergy system needs socio-economic and organisational change.
Moving towards a circular economy: From an emergy perspective, the tannery sector is a major environmental stress inducer. However, this sector is considered the major economic pillar for India, so it is difficult to restrict the activities of the tannery. Still, it is possible to regulate raw materials, energy utilisation, and production scale. Regarding the raw materials, especially chemicals, it is possible to utilise some eco-friendly chemicals in place of chromium. Also, the tannery can recover value from the wastes by utilising the wastes. For instance, the fleshing from the tannery can be used in fertiliser and vermicompost manufacturing (Balachandar et al. Citation2020). In such a manner, the tannery may reduce the adverse environmental impact.
Creating awareness about EMA: Both the industrial community and society are still in the early stage of adopting sustainability practices in their regular work. In enforcing the sustainability practice strictly, the role of the government and regulatory board is crucial. Raising awareness and educating the industrial community in EMA can lead to the adoption of emergy in manufacturing practice. Guidelines from global bodies like the International Standards Organization (ISO) may further assist in adopting EMA (Fraccascia and Giannoccaro Citation2020; Xu et al. Citation2021; Yadav et al. Citation2021). Also, the buyers must consider the supplier’s EMA performance and other factors like cost and quality of the products.
7. Conclusion
Uncontrolled exploitation of natural resources has resulted in resource scarcity and raised questions on the availability of natural resources for future generations. Moreover, such uncontrolled activities have brought in adverse environmental effects by affecting the ecosystem. Under such a situation, the United Nations has demanded sustainable manufacturing practices from the industrial community to lower the exploitation of natural resources. As a token of response to the United Nations sustainable development goal 12 (Sustainable Production and Consumption), the industrial community has taken several sustainable initiatives. However, in measuring the success of the sustainable initiatives, the commonly adopted methods have been a failure as it measures the sustainable performance only from the user side. Therefore, a donor-side measurement is mandatory for measuring the effectiveness of the sustainable initiatives taken. In this connection, this study uses an EMA analysis in supplier selection for the leather bag industry. Here, EMA analysis was used to measure the sustainable performance of the four tanneries i.e. suppliers. This study demonstrates how EMA analysis can be used in supplier selection employing the emergy database. The EMA analysis provides comprehensive results of the amount of renewable, non-renewable, and imported resources. Results based on ELR, EYR, ESI, %R and ESR value, it is clear that the suppliers considered in this study are moving in unsustainable patterns. The results also indicate that the suppliers are adding environmental pressure on the business ecosystem.
Even though the EMA approach provides some valuable insights into sustainability evaluation from the donor-side, EMA has some limitations. One of the limitations is that the data of all materials and products are not available in EMA analysis. Therefore, when a system is evaluated using EMA analysis, getting comprehensive data of all the study components is difficult. Next, as some data are not available in the emergy database while carrying out EMA analysis, several assumptions are made. Hence, it is difficult to get reliable data for certain products as the assumption differs from study to study.
Although EMA measures sustainable resource consumption by the industries, the number of research works carried out using EMA analysis is still scant. While EMA provides comprehensive data of resources used in a system, integrating other environmental accounting tools may increase the results’ reliability and validity. As future work, the EMA analysis may be integrated with environmental accounting tools like LCA and material flow analysis (MFA). Also, other environmental accounting tools like ecological footprint, exergy analysis, and carbon footprint can be used with EMA analysis. Also, other suitable multi-criteria decision-making techniques such as the analytical hierarchy process (AHP) and step‐wise weight assessment ratio analysis (SWARA) may be used along with EMA analysis to prioritise the factors under consideration.
Nomenclature
Disclosure statement
No potential conflict of interest was reported by the author(s).
Additional information
Notes on contributors
Koppiahraj Karuppiah
K. Koppiahraj obtained his B.E (MECH) in 2014 from the Erode sengunthar engineering college, Erode, Tamilnadu, India. He completed his M.Tech (CAD/CAM) in 2016 at the B.S.Abdur Rahman Crescent institute of science and technology, Chennai, Tamilnadu, India. Currently, he is a Research Scholar in the Department of Mechanical Engineering, Kalasalingam Academy of Research and Education, Krishnankoil, Tamilnadu, India. His research interests include multi-criteria decision making and application of fuzzy set theory in real life decision problems. He is currently pursuing PhD in the area of analyzing Day-today challenges in leather industries using MCDM techniques.
Bathrinath Sankaranarayanan
Dr. S. Bathrinath is an Associate Professor in the Department of Mechanical Engineering, Kalasalingam Academy of Research and Education, Krishnankoil, Tamilnadu, India. His current area of research includes Industry 4.0, Supply Chain Management, Circular Economy, Risk Assessment, multi-criteria decision making, scheduling, optimization of process parameters, soft computing and Artificial intelligence. He has obtained his Post-Doctoral Fellowship in University of Southern Denmark, Odense, Denmark. He has also obtained his Young Scientist Fellowship from Tamilnadu State Council for Science and Technology (TNSCST). He has published 30 papers in journal of national/international repute and presented a number of papers in various conferences/symposia in India and abroad. He is presently guiding a number of master/doctoral research scholars. Dr.S.Bathrinath can be contacted at: [email protected]
Syed Mithun Ali
Dr. Syed Mithun Ali is an Associate Professor in the Department of Industrial and Production Engineering in Bangladesh University of Engineering and Technology. He holds a PhD majoring in supply chain risk management from Nagoya Institute of Technology, Japan. His research appears in Journal of Cleaner Production, Computer and Industrial Engineering, Process Safety and Environmental Protection, Sustainable Production and Consumption, Measurement, Environmental Impact Assessment Review, Industrial Management and Data, Journal of Retailing and Consumer Services, International Journal of Logistics Systems and Management, The International Journal of Advanced Manufacturing Technology, International Journal of Production Research and so on. His research interests include logistics and supply chain management, supply chain risk and resilience management and trying that to supply chain sustainability and circular economy.
References
- Abel, C., S. Horion, T. Tagesson, W. De Keersmaecker, A. W. R. Seddon, A. M. Abdi, and R. Fensholt. 2021. “The Human–environment Nexus and Vegetation–rainfall Sensitivity in Tropical Drylands.” Nature Sustainability 4: 25–32. doi:10.1038/s41893-020-00597-z.
- Adenso-Díaz, B., J. Mar-Ortiz, and S. Lozano. 2018. “Assessing Supply Chain Robustness to Links Failure.” International Journal of Production Research 56 (15): 5104–5117. doi:10.1080/00207543.2017.1419582.
- Alkhuzaim, L., Q. Zhu, and J. Sarkis. 2021. “Evaluating Emergy Analysis at the Nexus of Circular Economy and Sustainable Supply Chain Management.” Sustainable Production and Consumption 25: 413–424. doi:10.1016/j.spc.2020.11.022.
- Amaral, L. P., N. Martins, and J. B. Gouveia. 2016. “A Review of Emergy Theory, Its Application and Latest Developments.” Renewable and Sustainable Energy Reviews 54: 882–888. doi:10.1016/j.rser.2015.10.048.
- Ameen, R. F. M., and M. Mourshed. 2019. “Urban Sustainability Assessment Framework Development: The Ranking and Weighting of Sustainability Indicators Using Analytic Hierarchy Process.” Sustainable Cities and Society 44: 356–366. doi:10.1016/j.scs.2018.10.020.
- Balachandar, R., L. Baskaran, A. Yuvaraj, R. Thangaraj, R. Subbaiya, B. Ravindran, S. W. Chang, and N. Karmegam. 2020. “Enriched Pressmud Vermicompost Production with Green Manure Plants Using Eudrilus Eugeniae.” Bioresource Technology 299: 122578. doi:10.1016/j.biortech.2019.122578.
- Barbosa, M., J. A. Castañeda -Ayarza, and D. H. Lombardo Ferreira. 2020. “Sustainable Strategic Management (GES): Sustainability in Small Business.” Journal of Cleaner Production 258: 120880. doi:10.1016/j.jclepro.2020.120880.
- Barratt, M. 2004. “Understanding the Meaning of Collaboration in the Supply Chain.” Supply Chain Management: An International Journal 9 (1): 30–42. doi:10.1108/13598540410517566.
- Bastianoni, S., and N. Marchettini. 2000. “The problem of co-production in environmental accounting by energy analysis.„ Ecological modelling 129, no. 2–3: 187–193.
- Blatt, E. F., B. F. Giannetti, F. Agostinho, F. Sevegnani, Y. Wang, and C. M. V. B. Almeida. 2020. “Evaluating Producers as Resource Consumers and Alternative Consumption Patterns: Outcomes from Emergy Synthesis of the Jeans Supply Chain.” Cleaner and Responsible Consumption 1: 100002. doi:10.1016/j.clrc.2020.100002.
- Blount, I., and M. Li. 2020. “How Buyers’ Attitudes toward Supplier Diversity Affect Their Expenditures with Ethnic Minority Businesses.” Journal of Supply Chain Management. jscm.12237. doi:10.1111/jscm.12237
- Brown, M., and S. Ulgiati. 1997. “Emergy-based Indices and Ratios to Evaluate Sustainability: Monitoring Economies and Technology toward Environmentally Sound Innovation.” Ecological Engineering 9 (1–2): 51–69. doi:10.1016/S0925-8574(97)00033-5.
- Brown, M. T. 2001. “Handbook of Emergy Evaluation A Compendium of Data for Emergy Computation Issued in A Series of Folios.” Ecosystems3.
- Brown, M. T., D. E. Campbell, C. De Vilbiss, and S. Ulgiati. 2016. “The Geobiosphere Emergy Baseline: A Synthesis.” Ecological Modelling 339: 92–95. doi:10.1016/j.ecolmodel.2016.03.018.
- Brown, M. T., and S. Ulgiati. 2016. “Emergy Assessment of Global Renewable Sources.” Ecological Modelling 339: 148–156. doi:10.1016/j.ecolmodel.2016.03.010.
- Chen, G. Q., M. M. Jiang, B. Chen, Z. F. Yang, and C. Lin. 2006. “Emergy Analysis of Chinese Agriculture.” Agriculture, Ecosystems & Environment 115 (1–4): 161–173. doi:10.1016/j.agee.2006.01.005.
- Chen, I. J., and A. Paulraj. 2004. “Understanding Supply Chain Management: Critical Research and a Theoretical Framework.” International Journal of Production Research 42 (1): 131–163. doi:10.1080/00207540310001602865.
- Chen, J., Y. Mei, Y. Ben, and T. Hu. 2020. “Energy-based sustainability evaluation of two hydropower projects on the Tibetan Plateau.„ Ecological Engineering 150: 105838.
- Chen, W., W. Liu, Y. Geng, M. T. Brown, C. Gao, and R. Wu. 2017. “Recent Progress on Emergy Research: A Bibliometric Analysis.” Renewable and Sustainable Energy Reviews 73: 1051–1060. doi:10.1016/j.rser.2017.02.041.
- Chen, W., W. Liu, Y. Geng, S. Ohnishi, L. Sun, W. Han, and S. Zhong. 2016. “Life Cycle Based Emergy Analysis on China’s Cement Production.” . Journal of Cleaner Production 131: 272–279. doi:10.1016/j.jclepro.2016.05.036.
- Dalampira, E., and S. A. Nastis. 2020. “Mapping Sustainable Development Goals: A Network Analysis Framework.” Sustainable Development 28 (1): 46–55. doi:10.1002/sd.1964.
- Danish, U., and R. Khan. 2020. “Determinants of the Ecological Footprint: Role of Renewable Energy, Natural Resources, and Urbanization.” Sustainable Cities and Society 54: 101996. doi:10.1016/j.scs.2019.101996.
- Das, M., and K. Rangarajan. 2020. “Impact of Policy Initiatives and Collaborative Synergy on Sustainability and Business Growth of Indian SMEs.” Indian Growth and Development Review 13 (3): 607–627. ahead-of-p. doi10.1108/IGDR-09-2019-0095.
- de Aquim, P. M., É. Hansen, and M. Gutterres. 2019. “Water Reuse: An Alternative to Minimize the Environmental Impact on the Leather Industry.” Journal of Environmental Management 230: 456–463. doi:10.1016/j.jenvman.2018.09.077.
- Dolgui, A., D. Ivanov, and B. Sokolov. 2020. “Reconfigurable supply chain: The X-network.„ International Journal of Production Research 58, no. 13: 4138–4163.
- Fraccascia, L., and I. Giannoccaro. 2020. “What, Where, and How Measuring Industrial Symbiosis: A Reasoned Taxonomy of Relevant Indicators.” Resources, Conservation and Recycling 157: 104799. doi:10.1016/j.resconrec.2020.104799.
- Geng, Y., X. Tian, J. Sarkis, and S. Ulgiati. 2017. “China-USA Trade: Indicators for Equitable and Environmentally Balanced Resource Exchange.” Ecological Economics 132: 245–254. doi:10.1016/j.ecolecon.2016.11.008.
- Gowrisankar, G., R. Chelliah, S. R. Ramakrishnan, V. Elumalai, S. Dhanamadhavan, K. Brindha, U. Antony, and L. Elango. 2017. “Chemical, Microbial and Antibiotic Susceptibility Analyses of Groundwater after a Major Flood Event in Chennai.” Scientific Data 4 (1): 170135. doi:10.1038/sdata.2017.135.
- Hau, J. L., and B. R. Bakshi. 2004. “Promise and Problems of Emergy Analysis.” Ecological Modelling 178 (1–2): 215–225. doi:10.1016/j.ecolmodel.2003.12.016.
- He, S., D. Zhu, Y. Chen, X. Liu, Y. Chen, and X. Wang. 2020. “Application and problems of energy evaluation: A systemic review based on bibliometric and content analysis methods.„ Ecological Indicators 114: 106304.
- Hosseinijou, S. A., S. Mansour, and M. A. Shirazi. 2014. “Social Life Cycle Assessment for Material Selection: A Case Study of Building Materials.” The International Journal of Life Cycle Assessment 19 (3): 620–645. doi:10.1007/s11367-013-0658-1.
- Ighalo, J. O., and A. G. Adeniyi. 2020. “A Perspective on Environmental Sustainability in the Cement Industry.” Waste Disposal & Sustainable Energy 2 (3): 161–164. doi:10.1007/s42768-020-00043-y.
- Jing, R., C. Yuan, H. Rezaei, J. Qian, and Z. Zhang. 2020. “Assessments on Emergy and Greenhouse Gas Emissions of Internal Combustion Engine Automobiles and Electric Automobiles in the USA.” Journal of Environmental Sciences 90: 297–309. doi:10.1016/j.jes.2019.11.017.
- Koberg, E., and A. Longoni. 2019. “A Systematic Review of Sustainable Supply Chain Management in Global Supply Chains.” Journal of Cleaner Production 207: 1084–1098. doi:10.1016/j.jclepro.2018.10.033.
- Koppiahraj, K. 2019. “Leather Waste Management Scenario in Developed and Developing Nations.” The International Journal of Engineering and Advanced Technology 9: 852–857. doi:10.35940/ijeat.A1056.1291S419.
- Koppiahraj, K., S. Bathrinath, V. G. Venkatesh, V. Mani, and Y. Shi. 2021. “Optimal Sustainability Assessment Method Selection: A Practitioner Perspective.” The Annals of Operations Research. doi:10.1007/s10479-021-03946-z.
- Kumar, D. 2020. “Satellite-based Solar Energy Potential Analysis for Southern States of India.” Energy Reports 6: 1487–1500. doi:10.1016/j.egyr.2020.05.028.
- Li, H., and M. Brown. 2017. “Emergy-based Environmental Accounting toward a Sustainable Mongolia.” Journal of Geographical Sciences 27 (10): 1227–1248. doi:10.1007/s11442-017-1432-2.
- Liu, J., B.-L. Lin, and M. Sagisaka. 2012. “Sustainability Assessment of Bioethanol and Petroleum Fuel Production in Japan Based on Emergy Analysis.” Energy Policy 44: 23–33. doi:10.1016/j.enpol.2011.12.022.
- Liu, X., P. Guo, and L. Nie. 2020. “Applying Emergy and Decoupling Analysis to Assess the Sustainability of China’s Coal Mining Area.” Journal of Cleaner Production 243: 118577. doi:10.1016/j.jclepro.2019.118577.
- Liu, Z., W. Liu, M. Adams, R. P. Cote, Y. Geng, and S. Chen. 2019. “A Hybrid Model of LCA and Emergy for Co-benefits Assessment Associated with Waste and By-product Reutilization.” Journal of Cleaner Production 236: 117670. doi:10.1016/j.jclepro.2019.117670.
- Livingston, J. E., and M. Rummukainen. 2020. “Taking Science by Surprise: The Knowledge Politics of the IPCC Special Report on 1.5 Degrees.” Environmental Science & Policy 112: 10–16. doi:10.1016/j.envsci.2020.05.020.
- Meenal, R., and A. I. Selvakumar, 2016. Estimation of Global Solar Radiation Using Sunshine Duration and Temperature in Chennai, in: 2016 International Conference on Emerging Trends in Engineering, Technology and Science (ICETETS). Pudukkottai, India: IEEE, pp. 1–6. doi:10.1109/ICETETS.2016.7603089
- Miao, S., C. Jin, R. Liu, Y. Bai, H. Lan, H. Liu, C. Hu, and J. Qu. 2020. “Carbon Harvesting from Organic Liquid Wastes for Heterotrophic Denitrification: Feasibility Evaluation and Cost and Emergy Optimization.” Resources, Conservation and Recycling 160: 104782. doi:10.1016/j.resconrec.2020.104782.
- Mishra, D., A. Gunasekaran, T. Papadopoulos, and R. Dubey. 2018. “Supply Chain Performance Measures and Metrics: A Bibliometric Study.” Benchmarking: An International Journal 25: 932–967. doi:10.1108/BIJ-08-2017-0224.
- Moonilall, N. I., O. Homenauth, and R. Lal. 2020. “Emergy Analysis for Maize Fields under Different Amendment Applications in Guyana.” Journal of Cleaner Production 258: 120761. doi:10.1016/j.jclepro.2020.120761.
- Nasrollahi, M., M. R. Fathi, H. R. Sanouni, S. M. Sobhani, and A. Behrooz. 2021. “Impact of Coercive and Non-coercive Environmental Supply Chain Sustainability Drivers on Supply Chain Performance: Mediation Role of Monitoring and Collaboration.” International Journal of Sustainable Engineering 14 (2): 98–106. doi:10.1080/19397038.2020.1853271.
- Noshad, K., and A. Awasthi. 2018. “Investigating Critical Criteria for Supplier Quality Development.” International Journal of Management Science and Engineering Management 13: 215–224. doi:10.1080/17509653.2017.1387821.
- Ocak, B. 2018. “Film-forming Ability of Collagen Hydrolysate Extracted from Leather Solid Wastes with Chitosan.” Environmental Science and Pollution Research 25: 4643–4655. doi:10.1007/s11356-017-0843-z.
- Odum, H. T. 1996. Environmental Accounting: Emergy and Environmental Decision Making. Washington: Wiley.
- Pandey, N., M. Bhatnagar, and D. Ghosh. 2021. “. An Analysis of Critical Success Factors Towards Sustainable Supply Chain Management – In the Context of an Engine Manufacturing Industry.” International Journal of Sustainable Engineering 1–13. doi:10.1080/19397038.2021.1966128.
- Park, Y. S., G. Egilmez, and M. Kucukvar. 2016. “Emergy and End-point Impact Assessment of Agricultural and Food Production in the United States: A Supply Chain-linked Ecologically-based Life Cycle Assessment.” Ecological Indicators 62: 117–137. doi:10.1016/j.ecolind.2015.11.045.
- Rigueto, C. V. T., M. Rosseto, D. D. C. Krein, B. E. P. Ostwald, L. A. Massuda, B. B. Zanella, and A. Dettmer. 2020. “Alternative Uses for Tannery Wastes: A Review of Environmental, Sustainability, and Science.” Journal of Leather Science and Engineering 2: 21. doi:10.1186/s42825-020-00034-z.
- Rozario, A. M., and M. A. Vasarhelyi. 2018. “Auditing with Smart Contracts.” International Journal of Digital Accounting Research 1–27. doi:10.4192/1577-8517-v18_1.
- Santagata, R., A. Zucaro, G. Fiorentino, E. Lucagnano, and S. Ulgiati. 2020. “Developing a Procedure for the Integration of Life Cycle Assessment and Emergy Accounting Approaches. The Amalfi Paper Case Study.” Ecological Indicators 117: 106676. doi:10.1016/j.ecolind.2020.106676.
- Santagata, R., S. Viglia, G. Fiorentino, G. Liu, and M. Ripa. 2019. “Power Generation from Slaughterhouse Waste Materials. An Emergy Accounting Assessment.” Journal of Cleaner Production 223: 536–552. doi:10.1016/j.jclepro.2019.03.148.
- Shinkhede, S., V. Katare, S. Joglekar, M. Madurwar, and S. Mandavgane. 2021. “Comparison of Different Concrete Compositions Based on Sustainability Score.” International Journal of Sustainable Engineering 1–12. doi:10.1080/19397038.2021.1966123.
- Singh Parihar, N., and A. Kumar Gupta. 2020. “Chemical Stabilization of Expansive Soil Using Liming Leather Waste Ash.” International Journal of Geotechnical Engineering 1–13. doi:10.1080/19386362.2020.1775357.
- Spagnolo, S., G. Chinellato, S. Cristiano, A. Zucaro, and F. Gonella. 2020. “Sustainability Assessment of Bioenergy at Different Scales: An Emergy Analysis of Biogas Power Production.” Journal of Cleaner Production 277: 124038. doi:10.1016/j.jclepro.2020.124038.
- Su, Y., S. He, K. Wang, A. R. Shahtahmassebi, L. Zhang, J. Zhang, M. Zhang, and M. Gan. 2020. “Quantifying the Sustainability of Three Types of Agricultural Production in China: An Emergy Analysis with the Integration of Environmental Pollution.” Journal of Cleaner Production 252: 119650. doi:10.1016/j.jclepro.2019.119650.
- Tak, S., A. Tiwari, and B. P. Vellanki. 2020. “Identification of Emerging Contaminants and Their Transformation Products in a Moving Bed Biofilm Reactor (Mbbr)–based Drinking Water Treatment Plant around River Yamuna in India.” Environmental Monitoring and Assessment 192 (6): 365. doi:10.1007/s10661-020-08303-4.
- Tian, X., and J. Sarkis. 2020. “Expanding Green Supply Chain Performance Measurement through Emergy Accounting and Analysis.” International Journal of Production Economics 225: 107576. doi:10.1016/j.ijpe.2019.107576.
- Ulgiati, S., and M. T. Brown. 2002. “Quantifying the Environmental Support for Dilution and Abatement of Process Emissions.” Journal of Cleaner Production 10 (4): 335–348. doi:10.1016/S0959-6526(01)00044-0.
- Xu, Q., Y. Yang, K. Hu, J. Chen, S. N. Djomo, X. Yang, and M. T. Knudsen. 2021. “Economic, Environmental, and Emergy Analysis of China’s Green Tea Production.” Sustainable Production and Consumption 28: 269–280. doi:10.1016/j.spc.2021.04.019.
- Yadav, V., P. Gahlot, R. Rathi, A. Kumar, G. Yadav, and M. S. Kaswan. 2021. “Integral Measures and Framework for Green Lean Six Sigma Implementation in Manufacturing Environment.” International Journal of Sustainable Engineering. doi:10.1080/19397038.2021.1970855.
- Yawar, S. A., and S. Seuring. 2018. “The Role of Supplier Development in Managing Social and Societal Issues in Supply Chains.” Journal of Cleaner Production 182: 227–237. doi:10.1016/j.jclepro.2018.01.234.
- Yi, H., and W. W. Braham. 2015. “Uncertainty Characterization of Building Emergy Analysis (Bema).” Building and Environment 92: 538–558. doi:10.1016/j.buildenv.2015.05.007.
- Zhang, X., W. Jiang, S. Deng, and K. Peng. 2009. “Emergy Evaluation of the Sustainability of Chinese Steel Production during 1998–2004.” Journal of Cleaner Production 17 (11): 1030–1038. doi:10.1016/j.jclepro.2009.02.014.
- Zhao, C., and W. Chen. 2019. “A Review for Tannery Wastewater Treatment: Some Thoughts under Stricter Discharge Requirements.” Environmental Science and Pollution Research 26 (25): 26102–26111. doi:10.1007/s11356-019-05699-6.
- Zhao, H., X. Zhai, L. Guo, K. Liu, D. Huang, Y. Yang, J. Li, et al. 2019a. “Assessing the Efficiency and Sustainability of Wheat Production Systems in Different Climate Zones in China Using Emergy Analysis.” Journal of Cleaner Production 235: 724–732. doi:10.1016/j.jclepro.2019.06.251.
- Zhao, H., X. Zhai, L. Guo, Y. Yang, J. Li, C. Ren, K. Wang, X. Liu, R. Zhan, and K. Wang. 2019b. “Comparing Protected Cucumber and Field Cucumber Production Systems in China Based on Emergy Analysis.” Journal of Cleaner Production 236: 117648. doi:10.1016/j.jclepro.2019.117648.
- Zhong, S., Y. Geng, H. Kong, B. Liu, X. Tian, W. Chen, Y. Qian, and S. Ulgiati. 2018. “Emergy-based Sustainability Evaluation of Erhai Lake Basin in China.” Journal of Cleaner Production 178: 142–153. doi:10.1016/j.jclepro.2018.01.019.
Appendix A
Table A1. Emergy based flows and indicators.
Appendix B
Evaluation of suppliers based on EMA
In order to evaluate the supplier using EMA, the amount of consumption of indigenous renewable and non-renewable resources, and imported resources need to be measured. In this study, we assume an amount of input resources used for production for each supplier. The insolation value for supplier 1, supplier 2, supplier 3, and supplier 4 are 6.57x10⁹, 5.91x10⁹, 7.23 × 10⁹ and 8.23 × 10⁹ (Kumar Citation2020; Meenal and Selvakumar Citation2016). The sample calculation for the renewable resources of supplier 1 is given below:
Solar energy calculation
Area of the tannery = 30,000 m2
Insolation (Chennai, India) = 6.57x10⁹ J/m2/yr (Meenal and Selvakumar Citation2016)
Albedo = 0.162
Energy = (insolation) x (1 – albedo) x (area) = (6.57x10⁹ J/m2/yr) x (1–0.162) x (30,000 m2) = 1.65x10¹⁴ J/yr
UEV = 1 sej/j
Emergy of one year = 1.65x10¹⁴ J/yr x 1 yr x 1 sej/j = 1.65x10¹⁴ sej
(2) Rain calculation
Area of the tannery = 30,000 m2
Rainfall (annually) = 1.2 m/yr (Gowrisankar et al. Citation2017)
Density of water = 1000 kg/m3
Evapotranspiration rate = 30%
Gibbs free energy of water = 4940 J/kg
Energy = (area) x (rainfall) x (evapotranspiration rate) x (water density) x (Gibbs free energy of water) = (30,000 m2) x (1.2 m/yr) x (30%) x (1000 kg/m3) x (4940 J/kg) = 5.34x10¹⁰ J/yr
UEV = 7.0x10³ sej/j
Emergy of one year = 5.34x10¹⁰ J/yr x 1 yr x 7.0 × 103 sej/j = 3.74x10¹⁴ sej
(3) Wind energy calculation
Area of the tannery = 30,000 m2
Air density = 1.29 kg/m3
Wind velocity = 4.4 m/s
Velocity of geostrophic wind = 3.25 m/s
Drag coefficient = 0.001
Energy = (area) x (air density) x (drag coefficient) x (velocity of geostrophic wind)3 = (30,000 m2) x (1.29 kg/m3) x (0.001) x (3.25 m/s)3 x (3.15x107 s/yr) = 3.96 x 10⁹ J/yr
UEV = 8.0 x 10² sej/j
Emergy of one year = 3.96 x 10⁹ J/yr x 1 yr x 8.0 × 102 sej/j = 3.16 x 10¹² sej
Likewise, the emergy for non-renewable resources and imported resources are calculated for supplier 1.