
 ?Mathematical formulae have been encoded as MathML and are displayed in this HTML version using MathJax in order to improve their display. Uncheck the box to turn MathJax off. This feature requires Javascript. Click on a formula to zoom.
ABSTRACT
Municipal solid remains an issue that needs to be addressed globally towards a more circular economy and lower environmental impacts. In Colombia, over 96% of municipal solid wastes are landfilled, with little recycling or revalorisation of wastes and several environmental implications. With the technological development of different waste-to-energy routes, the energy revalorisation of solid wastes is increasingly becoming an attractive business opportunity. The waste-to-energy potential of the Atlantic Department (Colombia) was estimated based on the characteristics and daily availability of municipal solid wastes for different technologic routes. The implementation of the technological routes discussed could replace from 1 to 49 % of the demand for energy carriers like natural gas, electricity, or gasoline. This energy potential could replace from 2 to 106% of the energy demanded by the power generation, transport, residential, industrial, and commercial sectors. Furthermore, these technology routes could reduce greenhouse gas emissions by 46 to 92% of the greenhouse gas emissions resulting from landfilling. These results stress the need to upgrade energy policies in the country and to introduce new incentives to overcome economic and other barriers precluding the widespread use of waste-to-energy technologies.
Abbreviations: Tuning in to Kids (TIK); Parental Reflective Functioning (PRF) Australian New Zealand Clinical Trials Registry (ANZCTR) number: ACTRN12618000310268
1. Introduction
The inadequate management of municipal solid wastes (MSW) is a rapidly growing source of environmental impacts (Hoornweg and Bhada-Tata Citation2012) to the water, soil, and air pollution that impacts public health (Giusti Citation2009) and the economy (Rahman, Azeem, and Ahammed Citation2017). Worldwide different managing approaches are implemented to address MSW, including landfilling (43%), recycling (17%), Waste-to-Energy (WtE) (16%), dumpsites (9%), composting (9%), others (6%) (World Energy Council Citation2016). Currently, over half of the MSW generated is either dumped (which is a common practice in developing countries (Kumar and Samadder Citation2017)) or landfilled. In the case of developed countries, current policies promote reduced use of landfills. In the US, 50% of the MSW was landfilled in 2018 (US EPA Citation2018), while in Europe landfilling accounts for 23% of the MSW generated (Sauve and Van Acker Citation2020), with some countries like Switzerland, Germany, or Belgium that no longer landfill MSW (OECD Citation2020). Other countries landfill from 75% to 100% of MSW (Leme et al. Citation2014), and addressing the management of MSW is increasingly challenging for developing countries (Rahman, Azeem, and Ahammed Citation2017).
Although the valorisation of the organic fraction of MSW (OFMSW) is instrumental to pave the way towards a circular economy (Barampouti et al. Citation2019), recycling MSW is mostly limited to the non-organic fractions (i.e. plastics, metals, glass, and paper), while the organic fraction, usually the largest fraction, is frequently dumped or landfilled. In the opinion of experts, only 10 to 15% of the MSW should be landfilled (Kumar and Samadder Citation2017). Landfilling MSW is an environmental risk, impacting human health, underground water, soils, and global warming (Wang and Geng, Citation2015), and it is more polluting than other alternatives (Marchettini, Ridolfi, and Rustici Citation2007). Landfills alone account for 12% (Pour, Webley, and Cook Citation2018) to 18% (Alzate, Restrepo-Cuestas, and Jaramillo-Duque Citation2019) of the global emissions of methane, and 3 to 4 % of the greenhouse gas emissions (GHG) (Annepu Citation2012). Therefore, the sustainable management of MSW is a significant challenge at the global scale (He et al. Citation2017), which becomes more significant with the increased generation of MSW driven by the continuous growth of the world population (Kumar and Samadder Citation2017). To reduce GHG emissions, limiting the growth of the global temperature to 1.5 °C for preventing economic and environmental risks, it is estimated that 70 to 85 % of electricity should be produced from renewable sources by 2050 (Davis et al. Citation2020). To promote the sustainable management of MSW it is necessary to implement the waste management hierarchy (Nzihou et al. Citation2012).
Along with the increased generation of MSW, the increased world population drives higher demand for energy (World Energy Council Citation2016). Together with biomass, MSWs account for one of the largest sources of renewable energy globally, which are locally available for energy applications (Udomsri et al. Citation2011), and can be used to close the energy gap in developing countries (Ndukwu et al. Citation2020). Particularly, there are different waste-to-energy technologies available to produce energy (i.e. heat and electricity) (Cheng and Hu Citation2010) and fuels (e.g. biomethane, ethanol, etc.) from MSW (Ding et al. Citation2021), some of these renewable technologies can lower the economic costs of energy while reducing the environmental impacts contrasted to a business-as-usual scenario (Davis et al. Citation2020). The use of WtE technologies permits the production of heat and electricity and energy carriers like refuse-derived fuels and biofuels (Ding et al. Citation2021). Providing sustainable energy access stand as one main challenge globally (Mainali et al. Citation2014), and while the widespread use of renewables is increasingly promoted, the global energy demand is mainly supported by fossil fuels (IEA Citation2020). Worldwide, different WtE technologies are under exploitation as an effective approach to management MSWs (Kumar and Samadder Citation2017), diversify the energy mix, and mitigate its negative environmental impacts (Ribé Citation2018). Among others, WtE systems require less area than landfills, resulting in lower emissions of GHG (incinerating 1 ton of MSW prevents the emissions of 1 ton of equivalent CO2.) (Kumar and Samadder Citation2017). Furthermore, the energy valorisation of MSW might be a key element towards a circular economy, minimising wastes disposal and resource demand (Malinauskaite et al. Citation2017). Currently, a limited 10% of the MSW yearly produced worldwide (i.e. over 130 million tons of MSW) are used in WtE systems for electricity production (Kumar and Samadder Citation2017). WtE technologies permit the generation of energy from MSW while mitigating the environmental issues associated with its management (Gebreslassie et al. Citation2020). However, while different WtE technologies are available, in developing countries government/regulatory constraints frequently preclude the introduction into the renewable energy market to individual entrepreneurs (Gabriel et al. Citation2016). Identifying the WtE potential can help to address this issue.
The power purchase parity (PPP) was considered as an economic factor to assess the evolution of waste treatment methods in EU28 countries between 2008 and 2017 (Kyriakis, Psomopoulos, and Kalkanis Citation2019). The results show no correlation between the PPP, which increased an average of 4% during the assessed period, to the implementation of ecofriendly MSW treatment methods like incineration with energy recovery, which increased by over 70% during the same period. This suggests that economic policies like the Waste Framework Directive from 2008 (European Parliament Citation2008) are instrumental to increase the implementation of WtE technologies. The sustainable management of MSW cannot be realised without the use of WtE technologies to take advantage of the heating value of the non-recyclable and non-reusable fractions of MSW as an energy source (Psomopoulos, Limperis, and Kalkanis Citation2019). In contrast to composting, anaerobic digestion is a more sustainable approach, although more capital and technology-intensive, while the incineration of MSW results in a higher energy output than anaerobic digestion, is more sustainable than the production of waste-derived fuels (Psomopoulos, Limperis, and Kalkanis Citation2019). In Europe, Japan, the US, and China WTE technologies have increasingly become a suitable alternative to address the management of MSW, while based on the gate fees for landfilling in Latin America, government support must be provided for WTE technologies to be economically feasible (Themelis et al. Citation2013). Overall, MSW can be a significant source of sustainable energy throughout the year (Nikkhah et al. Citation2019).
Particularly, Colombia landfills over 96% of MSW with marginal recycling or revalorisation (Superservicios Citation2019). Additionally, solid waste disposal accounts for 2.7% of the national GHG emissions (IDEAM Citation2016). Specifically, the Atlantic department, accounting for the 4th highest per capita of MSW in the country, landfills 2,388 tons per day, which increases some 6% yearly (Superservicios Citation2018). In 2017, a limited 0.2% of the MSW was recycled (Superservicios Citation2017), which although increased to 3% in 2020 remains marginal (Vergel Acero Citation2020). In total, solid waste disposal accounts for 3.2% of the departmental GHG emissions (IDEAM Citation2016). The Atlantic department shows one of the fastest economic growth in the country, been challenged to upgrade its practices to more sustainable approaches, including the management of MSW (Secretaría de Planeación Citation2015). Currently, a limited fraction of the MSW is recycled in the department (Melo Citation2014). Therefore, this study aims to assess the potential of the WtE technologies available to valorise MSW in the Atlantic Department. Furthermore, the study aims to develop an initial assessment of the economic feasibility of the technologies discussed and how the energy and fuel potentials identified could impact on the end-use energy consumption of the Atlantic department. This approach permits to identify the potentialities and initial economic feasibility to upgrade the management of MSW and reduce their environmental impacts, while highlighting possible applications of the potential energy/fuels production in the context of the Atlantic department, which can contribute to support the development of new policies to upgrade the management of MSW.
2. Waste-to-Energy technologies
There are different WtE technologies available to manage MSW. The adequate selection of WtE technologies depends on the one hand, on its capital and operation costs, while, on the other hand, depends on the availability of wastes, and its composition and characteristics. There are four general WtE approaches to revalorise MSW:
Thermal conversion: incineration, pyrolysis, and gasification.
Physicochemical conversion
Biological conversion
Landfilling with gas recuperation
2.1. Applications of Waste-to-Energy technologies
In the north-eastern US, over 40% of the MSW is used as an energy source in incineration plants, while western Europe incinerates from 35 to 80% of its MSW, and other European countries also use incineration to manage a significant share of their MSW (Kumar and Samadder Citation2017). In 2013, China incinerated 30% of its MSW in 166 plants (Li et al. Citation2015), resulting in higher airborne emissions (Lombardi, Carnevale, and Corti Citation2015), while Japan uses 71% of its MSW as an energy source (Chifari et al. Citation2017), recycling 28%, and landfilling a low 1% (Rajaeifar et al. Citation2017).
There are countless commercial-scale anaerobic digestion plants successfully operating worldwide in countries like Greece (Karagiannidis and Perkoulidis Citation2009), Italy (Kumar and Samadder Citation2017), Denmark (Raven and Gregersen Citation2007), Germany (Pan et al. Citation2015), etc. Moreover, a significant potential for biogas production from MSW was identified in Vietnam, accounting for 2.4 to 4.1% of the electricity demanded between 2015 and 2025 (Nguyen, Heaven, and Banks Citation2014). However, in most developing countries, the energy potential of MSW is rather unknown (Kumar and Samadder Citation2017).
As compared to the incineration of MSW, pyrolysis, and gasification are energetically and environmentally more favourable (Zaman Citation2010), and can reduce the volume of the wastes up to 95% requiring a less intensive gas cleaning (Yap and Nixon Citation2015). Currently, high-efficiency gasification technologies have been developed (He et al. Citation2017), which operate with lower emissions of greenhouse gases and other pollutants than incineration (Murphy and McKeogh Citation2004). Particularly, 85 plants have been built in Japan since 2007, while in the US and Europe this technology has been implemented at a lower scale (Panepinto et al. Citation2014). Moreover, the commercial success of pyrolysis for MSW has been limited as compared to gasification, and there are some middle-sized plants with 3 to 6 tpd commercially exploited in Japan, while large scale plants (i.e. from 20 to 40 tpd) proved too costly to operate (Reddy Citation2016). Different pilot-scale demonstration plants of MSW pyrolysis are running in Japan, Europe, Australia, Indonesia (Reddy Citation2016), and China with unsatisfactory results (Chen et al. Citation2014). Recently pyrolysis was pointed as an unsustainable WtE approach for MSW (Rollinson and Oladejo Citation2019), and it is currently integrated with gasification or combustion processes (Mukherjee et al. Citation2020). Thermoselect is an example of a technology combining pyrolysis and gasification for syngas production (Chen et al. Citation2014). Given its process complexity and the need for costly gas cleaning (Callegari et al. Citation2020) the use of biomass and wastes for syngas production is limited, and currently, its production is mostly based on fossil fuels like coal (51%), petroleum residues (25%), natural gas (22%), and petcoke (1%), while biomass and wastes account for a marginal 0.5% (Guo, Song, and Buhain Citation2015).
In general, incineration, gasification, pyrolysis, landfill gas, and anaerobic digestion are the most used WtE systems, and their cost is the main barrier to a wider application (Kumar and Samadder Citation2017). While it is pointed that alternatives like fermentation and transesterification need to reduce their economic costs before they can be considered suitable for commercial-scale (Beyene, Werkneh, and Ambaye Citation2018), the fermentation technology developed by Lanzatech is commercially available as a WtE alternative for MSW. Considering that transesterification and pyrolysis are economically unfeasible currently, such technologies are not stressed in this study.
2.2 Waste-to-Energy technologies
Incineration is the most used WtE technology for the energy valorisation of MSW Fig. 1shows its main characteristics.
Incineration reduces the volume of MSW up to 90% and its weight up to 75% (Cheng and Hu Citation2010). Incineration was initially used to reduce the volume of MSW (Brunner and Rechberger Citation2015). However, the incineration of MSW generates airborne emissions of pollutants like NOX, SOX, COX, dioxins, and furans (Zhao et al., Citation2016). Thus, a gas cleaning system is required in this case (Kumar and Samadder Citation2017), and there are different alternatives available to reduce pollutant emissions to the level of considering MSW a clean source of energy (Leme et al. Citation2014). However, gas cleaning systems significantly increase the capital cost of incineration systems. The power generation efficiency for incineration systems varies from 20 to 35%, consuming from 62 to 257 kWh per ton of feedstock (Reddy Citation2016).
Pyrolysis refers to the thermal decomposition of different components in a substance at temperatures between 200 and 800°C in the absence of oxygen, to produce syngas, oil (tar), and char (Ghosh et al. Citation2020). This technology has proved ineffective to valorise MSW a will not be considered in this study.
Similar to pyrolysis, gasification (see ) refers to the thermal decomposition of different components in a substance, although at higher temperatures (i.e. from 400 to over 1000 °C) to produce syngas (Basu Citation2013). Moreover, contrary to incineration and pyrolysis, gasification requires a limited amount of oxygen
Figure 1. Incineration of municipal solid wastes
Figure 2. Gasification of municipal solid wastes
Syngas must be cleaned before been used as an energy carrier. Syngas can be directly used for electricity (Thermoselect Citation2003) production or as raw material for ethanol (Interstate Waste Technologies Citation2017) or biomethane production (Thunman Citation2018). Gasification can produce power with efficiencies between 25 and 35% (Waldheim Citation2018), while the efficiency of syngas production varies from 60% (Waldheim Citation2018) to 65% (Thermoselect Citation2003). Gasification consumes around 9% of the electricity produced (Thermoselect Citation2003).
Physicochemical conversion technologies include transesterification and catalytic methanation. Particularly, transesterification, which is a chemical process where oil reacts with an alcoholic solvent like methanol or ethanol, into methyl or ethyl esters, and glycerol (the only by-product) (Barampouti et al. Citation2019), is currently rather costly and needs to reduce its economic costs before it can be considered suitable for commercial-scale (Beyene, Werkneh, and Ambaye Citation2018).
Moreover, catalytic methanation (see ) is the chemical reaction of hydrogen and carbon oxides at elevated temperatures in the presence of a catalyst to produce methane and water (Seemann and Thunman Citation2019).
Figure 3. Catalytic methanation
Catalytic methanation is an alternative to produce a CH4-rich gas known as a substitute for natural gas (Götz et al. Citation2016). Currently, GoBiGas is the only plant developed to produce methane through catalytic methanation with biomethane efficiencies of 55 to 75% of the LHV, depending on the feedstock, while the plant consumes an amount of electricity equivalent to 6.75% of the biomass energy (Thunman et al. Citation2019).
Biological conversion technologies include anaerobic digestion, fermentation, and landfilling with gas recuperation. Anaerobic digestion (see ), also known as biological methanation, is a process catalysed by microbes in which a series of sequential microbial conversions, mineralise organic matter into biogas (i.e. through a series of oxidation-reduction reactions complex organic matter is converted to CH4 and CO2) (Angelidaki et al. Citation2019). To this end, MSW must be separated into organic and non-organic fractions, for which the main alternatives are the source and mechanical separation. In Colombia, where source separation of MSWs is not a common practice, only mechanical separation is possible.
Figure 4. Anaerobic digestion of the organic fraction of municipal solid wastes
Biogas (i.e. a gas containing between 50 to 75% of CH4, 25 to 50% of CO2, and 1 to 15% of other gases) is obtained from the anaerobic digestion of organic substances (Surendra et al. Citation2014). The resulting byproduct mud can be used as fertiliser (Pivato et al. Citation2016), although the presence of pollutants precluded this application in Europe (Browne, Allen, and Murphy Citation2014). In general, the main disadvantage of this process is the residence time of 20 to 40 days of substrates (Pham et al. Citation2015). On large scale, biogas can be used as a fuel for heat and electricity production or be upgraded to biomethane (a substitute for natural gas). Methane yield from the OFMSW varies from 0.177 to 0.580 m3/kgVS. Biogas can be used to produce electricity with 30% efficiency, with an electricity self-consumption of the system of 20% (Sagastume et al. Citation2020).
Biogas upgrading (see ) refers to removing CO2 from biogas to increase CH4 in the resulting gas, so its specifications are comparable to natural gas (Angelidaki et al. Citation2019).
Figure 5. Biogas upgrading
The presence of other gases reduces the calorific power of biogas and can impact human health (Angelidaki et al. Citation2019).
Moreover, fermentation (see ) is defined as the biological process where microorganisms like yeast, bacteria, and fungi participate in the conversion of a substrate to organic acids and alcohol (Sataloff, Johns, and Kost Citation2018). Recently Lanzatech developed a fermentation technology, based on proprietary microbes to ferment CO-rich gases into ethanol (Holmgren Citation2014). In this case, the feedstock is a CO-rich gas.
Figure 6. Lanzatech fermentation for ethanol production
This is a rather new technology that is combined with gasification to produce the required syngas used as feedstock for ethanol production. In this case, it is produced an amount of ethanol with an energy content that coincides with 51% of the energy of the feedstock (Interstate Waste Technologies Citation2017).
Landfill gas (see ) resulting from the decomposition of the organic fraction of MSW in landfills is roughly 50 % of CH4 and 50 % of CO2 with traces of other organic components (EPA Citation2021). Landfill gas can be captured and used as a source of renewable energy.
Figure 7. Municipal solid wastes landfills
Capturing landfill gas prevents the emissions of CH4 a greenhouse gas 25 times more powerful than CO2. However, this approach is not focused on the management of MSW, rather takes advantage of the CH4 generated in landfills. It is thus recommended for landfills with several years of exploitation, rather than for introducing new approaches to manage MSW.
In general, incineration and anaerobic digestion are more mature technologies than pyrolysis, gasification, and fermentation (IEA Citation2017). Particularly, pyrolysis and gasification are under research and development and are currently less profitable for commercial applications at a large scale (Kumar and Samadder Citation2017). Based on incineration, gasification, and anaerobic digestion is possible to produce electricity, biogas, biomethane, and ethanol from MSW.
3. Materials and methods
In Colombia, the government is actively promoting renewable energy sources to diversify the energy mix. Particularly, law 1715 (Gobierno Nacional Citation2014) promotes the expansion of non-conventional renewable energy sources (i.e. Aeolic, solar, biomass, and small hydroelectric systems). Moreover, the government also promotes WtE systems to manage MSW. Specifically, to promote the energy revalorisation of MSW and reduce landfilling (MINVIVIENDA Citation2018), the government introduced an incentive in law 1753 (Congreso de la República de Colombia Citation2015) and law 2412 (MINVIVIENDA Citation2018) for MSW projects considering the implementation of WtE technologies. The incentive account for 0.58 to 1.75 USD per ton of MSW processed. The complementary law 596 (MINVIVIENDA Citation2016), establishes that the incentive is added to the tipping fee in WtE projects managing over 100,000 tons per year with thermal conversion technologies (i.e. incineration, pyrolysis, or gasification), or over 20,000 tons per year with biological conversion technologies (e.g. anaerobic digestion).
3.1 Generation and characteristics of MSW in the Atlantic department
The composition of MSW varies with different socioeconomic factors (Hoornweg and Bhada-Tata Citation2012). Components like glass, metals, or plastics can be directly recycled, while the organic fraction in high-income countries is around 30% in low-income countries is over 60%. Particularly, the organic fraction that cannot be recycled directly but can be valorised using WtE systems, is frequently landfilled or wasted in dumpsites.
In developed countries (e.g. in the USA and European countries), the moisture of MSW that varies from 20 to 30% (Cheng et al. Citation2007), is lower than in developing nations (e.g. countries like in China and India) where it is over 50% (Mohee and Mudhoo Citation2012). Moreover, in developed countries, the share of organic materials is lower than 30% (by weight), while in developing countries is over 50% (Alzate, Restrepo-Cuestas, and Jaramillo-Duque Citation2019). The lower moisture and organic content of MSW in developed countries result in calorific values from 8300 to 17,000 kJ/kg as compared to 3000 to 6700 kJ/kg in developing countries (Patumsawad and Cliffe, Citation2002).
Based on its composition, the low heating value (LHV) of MSW can be calculated as (Dalmo et al. Citation2019)
where:
– Low heating value of the i-est component of MSW (e.g. organic, plastics, paper & cardboard, textiles, etc.)
– Mass fraction of the i-est component (%)
The LHV on a wet basis of the different MSW components is calculated as (Boundy et al. Citation2011):
where:
– High heating value on a dry basis
– Low heating value on a wet basis
MC – Moisture fraction
The composition of MSW landfilled in the department, including the mass fractions of the different components and the high heating value on a dry basis of the fractions, are shown in . The moisture of MSW as received in the landfill is 40% (Guevara and Rodriguez Citation2013). The is taken from (Dalmo et al. Citation2019), while the
for each fraction was calculated with Equationequation 2
(2)
(2) , and the heating value of MSW was calculated with Equationequation 1
(1)
(1) .
Table 1. MSW as received in the landfill (source: own elaboration with data from (Dalmo et al. Citation2019; Guevara and Rodriguez Citation2013))
The LHV of MSW on a wet basis is estimated at 9.7 MJ/kg in the department.
The anaerobic digestion of MSW yields between 60 and 200 m3 of biogas per ton of waste, which coincides with a CH4 yield of 0.13 to 0.40 m3 per kgVS (Rapport et al. Citation2008; Rocamora et al. Citation2020). In Colombia, volatile solids (VS) in the organic fraction of MSW vary from 70 to 83% of the total solids (TS) (Triana-Jiménez and Velásquez Lozano Citation2019).
3.2 End-use energy consumption
In Colombia, the electricity demand is forecasted to increase yearly by over 3%. Particularly, in the Atlantic department, the demand increased between 6 and 8% during the last years (Ramírez et al. Citation2018; Valencia et al. Citation2016). This pattern is the result of the rapid economic development of different sectors, which, on the one hand, led to an expansion of industry and commerce. On the other hand, the economic development boosted the electricity demand in the residential sector, particularly for air conditioning in this tropical region. shows the final energy consumption in the department.
Figure 8. End-use energy consumption in the Atlantic department (Source: Own elaboration with data from: (Concentra Citation2020; MINMINAS Citation2018; SUPERSERVICIOS Citation2020; UPME Citation2013; Velasquez Citation2018))
In total, the end-use energy consumption demands 4,324 TJ in the department. Particularly, natural gas accounts for the highest energy consumption, of which 52% is used in industry, 30 % in the residential sector, and 14% in transport. Moreover, electricity accounts for 31% of the final energy consumption, while gasoline account for 17% and diesel for 16%h, and other energy sources have marginal contributions. The transport sector is the highest consumer, followed by the residential and industrial sectors.
3.3. Economic assessment
The economic feasibility is assessed using the net present value (NPV) and the internal return rate (IRR) (Escamilla-García et al. Citation2020):
where:
– Cash flow.
– Operational and maintenance costs.
i – Discount rate (I = 6.25% (CEIC Citation2020)).
t – Year of the project.
n – Lifetime of the project (20 years).
T – Year for which NPV is zero.
The lifetime of the projects was considered equal to 20 years, with an operational time of 8,000 h per year.
The information available in the literature of the capital and operating costs for gasification technologies (i.e. to produce electricity, ethanol, or biomethane) is limited (Waldheim Citation2018). The capital (CAPEX) and operational (OPEX) costs of the WtE technologies discussed in this study are shown in . For incineration the CAPEX is calculated as a function of the electric power capacity (Escamilla-García et al. Citation2020; Silva et al. Citation2020):
Table 2. Capital costs of WtE technologies for MSW applications
where CAPEXincineration is in USD and P is in kW.
In Colombia, the tipping fee for MSW in landfills is around 7.8 USD/tMSW. Moreover, the market price of electricity, ethanol, and natural gas in the country are shown in .
Table 3. Market price of selected energy carriers in Colombia (source: (Bolsa Mercantil de Colombia Citation2016; Federación Nacional de Biomcombustible Citation2020; XM Citation2020)
3.4. Energy efficiency
The energy output of the WtE technologies was calculated with the energy efficiency as (Cengel, Boles, and Kanoglu Citation2019):
Where is the mass of MSW,
is the low heating value of MSW on a wet basis, while
is the net energy efficiency of technology J.
The energy efficiency of the different technologies is depicted in .
Table 4. Energy output of WtE technologies (source: Own elaboration with data from (Interstate Waste Technologies Citation2017; Larsson, Gunnasrsson, and Tengberg Citation2019; Reddy Citation2016; Sagastume et al. Citation2020; Thermoselect Citation2003; Thrän et al. Citation2014; Thunman Citation2018; Thunman and Seemann Citation2019))
The efficiencies and consumptions considered for the use of gasification are based on data from Thermoselect (for syngas and power production) and Lanzatech (for ethanol production). In the case of biomethane via gasification (resulting in gas with 96% of CH4) data is taken from GoBiGas technology (Thunman Citation2018).
Moreover, the characteristics of biogas and biomethane are depicted in .
Table 5. Characteristics of biogas production and upgrading (Campuzano and González-Martínez Citation2016; Dang et al. Citation2017; Dereli et al. Citation2010; Kumar Tyagi et al. Citation2018; Thrän et al. Citation2014)
The production of biomethane, in this case, requires the use of anaerobic digestion to produce biogas.
3.5. Emission factors
The emissions of MSW were calculated using the emission factors depicted in using the equation:
Table 6. Emission factors for incineration, gasification, pyrolysis, and the landfill (Dong et al. Citation2018; Holmgren Citation2014; Liebetrau et al. Citation2017; Nielsen, Nielsen, and Thomsen Citation2010; Siddiqi, Haraguchi, and Narayanamurti Citation2020; Slorach et al. Citation2019; Thermoselect Citation2003; Tschaplinski and Simpson Citation2019; Yang et al. Citation2013)
where RV (i.e. mass of MSW, the volume of exhaust gases, the mass of biogas produced, or the mass of CH4 emitted) is the reference value and EF is the emission factor.
Emission factors are presented in mg per m3 of exhaust gases. However, the CO2 emissions for incineration and gasification to power are presented in kg/tMSW, while the emissions of CO2, CO, and CH4 for gasification to biomethane are in % of the exhaust, and the emission of CO2 for anaerobic digestion to power are in kg/kgbiogas produced.
3.6. Energy conversion routes
Considering the WtE technologies available to revalorise MSW, 10 technology routes were considered as an alternative to energetically revalorise MSW in the Atlantic department
Incineration: combustion of MSW to produce electricity (see )
Gasification to power: gasification of MSW (based on the characteristics of Thermoselect gasification technology) to produce syngas for electricity generation (see )
Gasification to ethanol: gasification of MSW (based on the characteristics of Thermoselect gasification technology) to use syngas for ethanol production (based on the characteristics of Lanzatech fermentation technology) (see )
Gasification to biomethane: gasification of MSW (based on the characteristics of GoBiGas gasification and catalytic methanation technology) to use syngas for biomethane production (see )
Anaerobic digestion: biological methanation of the OFMWS to use the biogas for electricity production (see ). This alternative requires mechanical separation.
Anaerobic digestion to biomethane: biological methanation of the OFMWS to produce biogas, and later upgrade it to biomethane (see ). Similarly, this alternative requires mechanical separation.
Incineration: combustion of the NOFMSW to produce electricity (see )
Gasification to power: gasification of the NOFMSW (based on the characteristics of Thermoselect gasification technology) to produce syngas for electricity generation (see )
Gasification to ethanol: gasification of the NOFMSW (based on the characteristics of Thermoselect gasification technology) to use syngas for ethanol production (based on the characteristics of Lanzatech fermentation technology) (see )
Gasification to biomethane: gasification of the NOFMSW (based on the characteristics of GoBiGas gasification and catalytic methanation technology) to use syngas for biomethane production (see )
Routes A to D consider processing the total mass of MSW generated for energy conversion, while for technology routes E to J it is considered combining anaerobic digestion (routes E and F) with incineration and gasification (routes G, H, I, and J) to process the total mass of MSW. Therefore, the following combinations are considered using anaerobic digestion to power E – G, E – H, E – I, E – J, or using anaerobic digestion to biomethane F – G, F – H, F – I, F – J. However, to better understand the implications of processing OFMSW and NOFMSW separately, technology routes E to J were individually assessed.
Compared to others, this approach can compare the energy potential, economic performance, and GHG emissions for the different WtE technologies discussed.
4. Results
This section describes the energy potential, economic feasibility, and emissions for each technology route discussed.
4.1 Energy potential
shows the energy potential calculated for each technology route. These potentials include a sensitivity assessment based on the data available for each technology.
Figure 9. Energy potential for technology routes
In general, there are four technology routes for power generation (i.e. incineration (A and G), gasification (B and H), and anaerobic digestion (E)) that can produce from 244 to 1,557 MWh/day, including the combined use of the OFMSW in route E with the incineration of NOFMSW in route F. Particularly, incineration accounts for the highest potential for electricity conversion contrasted to gasification and anaerobic digestion, which is partly explained by the lowest energy self-consumption considered for incineration plants as compared to gasification technologies. Moreover, the routes for biomethane production have a potential of 972 to 3,617 MWh/day. Particularly, the route via catalytic methanation can produce from 2.8 (i.e. with route J) to 3.7 (i.e. route D) times the biomethane potential of the biogas upgrading to biomethane (i.e. route F). Finally, ethanol production via gasification – fermentation can yield in from 1,346 to 3,283 MWh/day of ethanol. Overall, biomethane production routes show a higher potential for biofuel production than ethanol technology. The error bars show the lower and higher energy potential based on the efficiency range considered. Based on the limited availability of data for ethanol production in routes C and I, no range of efficiency could be considered.
Depending on the energy source, technology routes could potentially replace a share of the end-use energy of the department (i.e. biomethane can replace natural gas, electricity can replace grid electricity, and ethanol can replace gasoline). shows the share of end-use of natural gas, electricity, and gasoline that could be potentially replaced by the electricity/biofuel produced with the technology routes discussed.
Figure 10. Share of end-use energy consumption by an energy source that could be replaced by the technology routes
Results show that the potential for electricity generation from technology routes A, B, E, G, and H could replace an estimated 1.9 to 12.4% of the end-use electricity consumption. Particularly, incineration yields the highest potential. Moreover, ethanol production could replace from 20.2 to 49.3% of the end-use of gasoline in the department, while the potential biomethane production from the technology routes D, F, and J, could replace from 7 to 26% of the end-use of natural gas.
4.2 Economic assessment
Although the technology routes show significant potentialities to support the end-use energy mix in the department, it is necessary to assess their economic feasibility (using the Net Present Value, NPV) to highlight the most adequate alternatives. On the one hand, an economic assessment was developed considering the regular gate fee established in Colombia. On the other hand, the assessment was repeated considering the economic benefit foreseen by the government to increase the gate fee for WtE technology plants during the management of MSW. shows the NPV calculated for each technology route.
Figure 11. Net present value of the technology routes
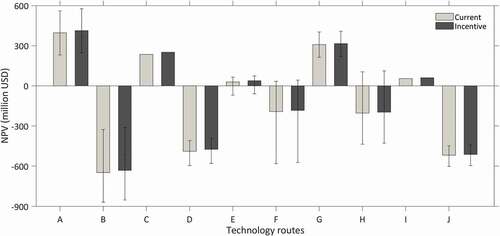
The error bars in the figure show the minimum and highest NPV values that could be obtained from the implementation of the different WtE alternatives. Results show that route A (with an NPV of 396 to 412 million USD), the combination of routes E – G (with an NPV of 337 to 353 million USD), route C (with an NPV of 235 to 251 million USD), and the combination of route E with route G (with an NPV of 337 to 353 million USD) or with the route I (with an NPV of 82 to 99 million USD) are the economically viable alternatives. In the case of anaerobic digestion, considering the lowest methane yield and the highest capital and maintenance costs resulted in an NPV of −61 to −70 million USD. Moreover, gasification to power resulted in a negative NPV between −311 and −868 million USD, except for the use of NOFMSW at the lowest capital cost that resulted in an NPV of 104 to 110 million USD. In the case of gasification to biomethane technologies, the NPV varied from −442 to −603 million USD. The low gate fee for MSW in Colombia (i.e. 7.8 to 9.6 USD as compared to over 50 USD in the US and Europe) significantly affects the economic feasibility.
Regarding the economic benefits foresee in Law 596 (MINVIVIENDA Citation2016) to promote WtE technologies, the results show that it can improve from 1 to 33% the NPV depending on the significance of the tipping fee for revenues. Particularly, for incineration and gasification technologies processing MSW, the NPV improved from 1 to 4%, while processing the NOFMSW improved 1 to 12%. In the case of anaerobic digestion, the NPV improved from 5 to 33%. Consequently, there is still a need to upgrade energy policy in the country and to introduce more benefits to promote the implementation of incineration and gasification technologies.
In general, economic feasibility was expected for incineration and anaerobic digestion based on their technological maturity. Moreover, gasification to ethanol technology that was calculated with the limited information available providing some feasible alternatives still requires more detailed information to further assess its economic feasibility.
4.3 Emissions
The emission factors included in were used to calculate the emissions from each technology route and landfill, which are shown in .
Table 7. Estimated airborne emission from technology routes and landfilling
In general, landfilling results in the highest emissions except for the emissions of N2O and SO2 from gasification to power routes.
shows the equivalent GHG emissions from the technology routes and landfilling based on the data from . Additionally, the figure shows the specific GHG emissions per technology route (i.e. the ratio of daily emissions to the MSW managed per day).
Figure 12. Equivalent GHG emissions from WtE technology routes and landfill
In total, the equivalent GHG emissions from the WtE technology routes for electricity production are between 6 and 54% of the emissions resulting from landfilling MSW, with gasification and anaerobic digestion resulting in the lowest emissions. Specifically, the equivalent GHG emissions per ton of MSW are between 10 to 54% of the emissions from landfills. Moreover, the total emissions from ethanol and biomethane production routes are between 5 to 13% of the landfill emissions, while the specific emissions are between 1 to 33% contrasted to landfilling. Of course, ethanol and biomethane will emit more GHG during their use as biofuels.
Other environmental issues related to WtE technologies include the management of solid wastes like the fly and bottom ashes from incineration (which account for 1 to 30% in weight (on a wet basis) and 5 to 15% in volume of the input MSW) (Siddique Citation2008). Some management alternatives either exist or are under development to manage these wastes. For example, incineration ashes are frequently landfilled, yet they can be byproducts for concrete production or replace raw materials during cement production, however, the presence of heavy metals and other pollutants currently precludes these applications (Siddique Citation2008).
All in all, the environmental performance of the different routes requires further assessment to adequately address environmental impacts preventing trade-offs.
4.4 Suitable WtE technologies for the Atlantic department
Considering the previous results, the highest yields of electricity are obtained for the incineration of MSW, while gasification yields 28% less electricity. Likewise, combining the anaerobic digestion of OFMSW with either incineration or gasification of the NOFMSW result in 1 to 5% less electricity than considering incineration or gasification of MSW. Moreover, the economic assessment of incineration shows a good performance with high NPV values estimated for the incineration of MSW, while the incineration of the NOFMWS shows good performance too. Contrasted, gasification, with negative values of the NPV, appears like a poor investment choice. In the case of anaerobic digestion, the results that for efficient alternatives is a feasible investment, yet it can be a poor investment given the implementation of inefficient technology. The lowest GHG emissions result from the combination of the anaerobic digestion of the OFMSW with the incineration of the NOFMSW looks like the indicated alternative, yet the incineration of MSW shows better economic performance. In both cases, a similar share of the end-use electricity could be replaced in the department. Overall, incineration, considered more polluting than anaerobic digestion, is the most widely used WtE technology, because of its lower costs and higher energy yields, although is less indicated for high moisture fuels (Octavianthy and Purwanto Citation2019). However, given its higher energy yield, from a life cycle perspective more environmental gains result from incineration than from anaerobic digestion, which is mostly explained by the avoided emissions from using fossil fuels (Di Maria and Micale Citation2015).
Moreover, while producing biomethane through gasification-catalytic methanation of MSW or combining the anaerobic digestion of OFMSW with the gasification-catalytic methanation of NOFMSW yields more biofuel energy than producing ethanol, based on the available data, ethanol production result in an economically feasible alternative while biomethane production will result in economic loss. Therefore, in this case, ethanol production is the indicated alternative. Furthermore, the potential to produce ethanol, which could replace nearly half of the gasoline demand in the department, can be a GHG mitigation measure in the transport sector that accounts for some 15% of the GHG emissions in Colombia (IDEAM Citation2016).
From an economic point of view, incineration shows better economic performance and is a more mature technology than ethanol production from MSW. Moreover, the electricity mix in Colombia mostly depends on hydroelectric plants, while the transport sector mostly relies on fossil fuels. Thus, from an environmental point of view, ethanol production is the indicated alternative.
A study in the city of Bucaramanga concluded that the anaerobic digestion of MSW implemented by mixing it with the sludge produced in conventional wastewater treatment plants can be a significant source of energy (Castillo, Cristancho, and Victor Arellano, A. Citation2006). However, no economic considerations were discussed in this case. Moreover, an assessment of the energy potential of MSW in three urban centres in Colombia (one municipality with 4,555 inhabitants, one municipality with 47,747 inhabitants, and one municipality with 465,148 inhabitants) shows that the implementation of incineration gasification and anaerobic digestion is feasible only considering a tax reduction of 50% during five years, combined with a VAT exemption for WtE equipment (Alzate et al., Citation2019). In this case, LHV between 4.7 and 8.8 MJ/kgMSW were considered, which are lower than the 9.7 MJ/kgMSW considered in this study and affect the feasibility of incineration and gasification. Based on the same calculation, it is pointed that tax benefits can make incineration, gasification, landfill gas, and anaerobic digestion feasibly WtE investments in Colombia (Alzate-Arias et al. Citation2018). These studies neither consider the potential application of the WtE outputs in the context discussed, neither consider the polluting emissions of the WtE alternatives discussed.
4.5 Challenges to implementing WtE technologies
The increased generation of MSW, which is related to the rapid growth of the world population, the accelerated urbanisation, and in some cases the increased incomes of some population sectors, is a major challenge, especially in developing countries, in the way to environmental sustainability (Jaiswal and Kumar Citation2019). In Colombia, one main challenge to WtE technologies is the access to capital to meet the high upfront costs required. An additional challenge to higher economic profitability in Colombia, and most likely other developing countries, is the low gate fee of MSW, which combined with the lower costs of energy carriers like electricity (as compared to developed countries) makes WtE technologies less competitive.
To effectively increase WtE projects, waste management policies are instrumental to balance economic growth and environmental deterioration (Jaiswal and Kumar Citation2019). The implementation of sound policies has been instrumental to reduce landfilling in some countries. In the EU, the exploitation of WtE increased after the implementation of the Waste Framework Directive in 2008 (European Parliament Citation2008), which resulted in reducing landfilling by 50% (Malinauskaite et al. Citation2017). I result, e implementation of t
ter the implementation of t
ic growth and environmental deterioration.t.n China, companies embraced the build operate transfer (BOT) mechanism established by the government as a business model in the franchise policy (currently 50% of the WtE projects uses this mechanism), which facilitates meeting the high upfront capital costs of WtE projects (Zheng et al., Citation2014). Additionally, the renewable energy law enforces grid companies to purchase electricity from WtE plants based on MSW, compensating the additional costs to companies with a subsidy in the price of electricity (Zheng et al., Citation2014). Likewise, a preferential tax policy was established for the immediate refund of the value-added tax (VAT) to WtE projects based on MSW. These policies drive the increased MSW incineration capacity in China from 15,000 tpd in 2003 to 231,600 tpd in 2015 (Lu et al. Citation2017). Moreover, in other countries, the implementation of inadequate policies had limited results. In Brazil, the National Solid Waste Policy introduced in 2010 failed to include comprehensive quantitative goals, which combined with the difficulties for political and administrative integration of the different governmental levels (e.g. the national and local levels), has led to the failure of this policy to date (De Morais Lima et al. Citation2019).
In Colombia, the government has introduced policies to promote the exploitation of non-conventional renewable energy sources (Gobierno Nacional Citation2014), and WtE projects as a managing alternative to MSW (MINVIVIENDA Citation2018). However, these policies are insufficient to diversify the energy mix in the country (Arias-Gaviria, Carvajal-Quintero, and Arango-Aramburo Citation2019). On the one hand, law 1715 (Gobierno Nacional Citation2014) includes indirect incentives like tax reduction or exemptions, excluding direct incentives like price-based incentives that have proved more efficient to promote renewable energy in other countries. Additionally, the law does not include MSW as a renewable source. This explains the limited expansion of non-conventional renewable energy sources accounting for a marginal share of the energy mix (Cabello et al. Citation2019; Sagastume et al. Citation2020). Moreover, the results from this study show a limited impact on the economic performance of WtE projects of the incentive introduced in law 2412 (MINVIVIENDA Citation2018), which may explain its limited impact. In general, because of the growing energy demand, incentives like tax reduction, feed-in-tariffs, tradable certificates, and technical subsidies are unlikely to drive the expansion for non-conventional renewable energy sources in the future (Arias-Gaviria, Carvajal-Quintero, and Arango-Aramburo Citation2019). Therefore, one main challenge is to improve the existing policies and developing new ones to promote renewable energies and WtE technologies. The introduction of the BOT mechanism implemented in China might be an interesting alternative to make WtE projects more attractive economically.
5. Conclusions
Waste-to-energy alternatives can support from 1,001 to 3,283 MWh/day of energy in the department. Gasification and incineration account for the highest energy potentials. The ethanol potential of the different technology routes represents a significant 20 to 49% of the gasoline demand in the department, while the electricity potential account for a lower 8 to 10% of demand. On the other hand, the potential of biomethane accounts for a marginal 3 to 4% of the consumption of natural gas in the department.
The use of MSW in the departmental power sector can replace from 2 to 5% of its fuel demand. Moreover, while ethanol potential accounts for 9 to 23% of the energy demand from transport, the biomethane potential could support from 20% to 23% of the sector demand, and 10 to 28% of the energy demand from either the residential or the industrial sectors. Furthermore, it could support from 39 to 106% of the energy required by the commercial sector.
The economic assessment highlights incineration, gasification-to-ethanol, and anaerobic digestion as the most profitable technology routes. A deeper and more detailed assessment is required for more accurate results, particularly for gasification. Under the current condition and for the economic costs considered, the technology routes of gasification-to-power and gasification-to-biomethane are unfeasible. The technological routes discussed can reduce the estimated GHG emissions from landfilling to about 8 to 54% of the emissions from landfilling.
Overall, it is necessary to upgrade policies and introduce new incentives to overcome economic and other barriers to waste-to-energy technologies, which are more environmentally friendly than landfilling and need further promotion.
Acknowledges
The authors like to acknowledge the University of Córdoba for the support through project No. FI-05-17 of 2019, and to the Framework Agreement for the mobility of students and professors between undergraduate and postgraduate academic programs from engineering faculties in higher education institutions in the Caribbean region, Colombia. Additionally, the authors like to acknowledge the support to Universidad de la Costa for the support through the investigation.
Declarations of interest:
none
Nomenclature
CAPEX – Capital costs
Cin – Cash flow.
COPEX – Operational and maintenance costs
E – Energy output from waste-to-energy technologies
GHG – Greenhouse gases
HHV – High heating value
i – Discount rate
LHV – Low heating value
MC – Moisture fraction
MSW – Municipal solid wastes
n – Lifetime of the project (20 years)
NOFMSW – Non-organic fraction of municipal solid wastes
OFMSW – Organic fraction of municipal solid wastes
OPEX – Operational costs
T – Year for which NPV is zero
t – Year of the project
tpd – tons per day
tpy – tons per year
TS – Total solids
VS – Volatile solids
WtE – Waste-to-Energy
Xi – Mass fraction of the i-est component (%)
Greek symbols:
– Net energy efficiency of technology J
Subscripts:
d.b. – Dry basis
w.b. – Wet basis
Disclosure statement
No potential conflict of interest was reported by the author(s).
Additional information
Funding
Notes on contributors
Alexis Sagastume Gutiérrez
Alexis Sagastume Gutiérrez: Full-time professor of Thermal Sciences in “Universidad de la Costa”, Barranquilla, Colombia. Actively involved in research projects of thermal sciences, energy efficiency, renewable energy, energy valorization of wastes, cleaner production, and environmental assessment.
Jorge M. Mendoza Fandiño
Jorge M. Mendoza Fandiño: Full-time professor and Dean of the Faculty of Engineering in “Universidad de Cordoba”, Colombia. Actively involved in research projects of thermal sciences, energy efficiency, renewable energy, and energy valorization of wastes through gasification and anaerobic digestion.
Juan J. Cabello Eras
Juan J. Cabello Eras: Full-time professor and head of the Department of Energy in “Universidad de la Costa”, Barranquilla, Colombia. Actively involved in research projects of energy efficiency, renewable energy, energy valorization of wastes, cleaner production, environmental assessment, and mechanical design.
References
- Alzate, S., B. Restrepo-Cuestas, and Á. Jaramillo-Duque. 2019. “Municipal Solid Waste as A Source of Electric Power Generation in Colombia: A Techno-economic Evaluation under Different Scenarios.” Resources 8 (1): 1–16. doi:https://doi.org/10.3390/resources8010051.
- Alzate-Arias, S., Á. Jaramillo-Duque, F. Villada, and B. Restrepo-Cuestas. 2018. “Assessment of Government Incentives for Energy From waste in Colombia.” Sustainability 10 (4): 1–16. doi:https://doi.org/10.3390/su10041294.
- Angelidaki, I., L. Xie, G. Luo, Y. Zhang, H. Oechsner, A. Lemmer, R. Munoz, and P. G. Kougias. 2019. “Biogas Upgrading: Current and Emerging Technologies”. 2nd. In Biomass, Biofuels, Biochemicals: Biofuels: Alternative Feedstocks and Conversion Processes for the Production of Liquid and Gaseous Biofuels, 2nd ed., pp. 817–843. Elsevier. doi:https://doi.org/10.1016/B978-0-12-816856-1.00033-6.
- Annepu, R. K. 2012. Sustainable Solid Waste Management in India. In Department of Earth and Environmental Engineering at Columbia University. New York. http://www.seas.columbia.edu/earth/wtert/sofos/SustainableSolidWasteManagementinIndia_Final.pdf
- Arias-Gaviria, J., S. X. Carvajal-Quintero, and S. Arango-Aramburo. 2019. “Understanding Dynamics and Policy for Renewable Energy Diffusion in Colombia.” Renew. Energy 139: 1111–1119. doi:https://doi.org/10.1016/j.renene.2019.02.138.
- Barampouti, E. M., S. Mai, D. Malamis, K. Moustakas, and M. Loizidou. 2019. “Liquid Biofuels from the Organic Fraction of Municipal Solid Waste: A Review.” Renew. Sustain. Energy Rev 110: 298–314. doi:https://doi.org/10.1016/j.rser.2019.04.005.
- Basu, P. 2013. “Biomass Gasification, Pyrolysis and Torrefaction: Practical Design and Theory, Biomass Gasification, Pyrolysis and Torrefaction: Practical Design and Theory.” Academic Press. doi:https://doi.org/10.1016/C2011-0-07564-6.
- Beyene, H. D., A. A. Werkneh, and T. G. Ambaye. 2018. “Current Updates on Waste to Energy (Wte) Technologies: A Review. Renew.” Energy Focus 24: 1–11. doi:https://doi.org/10.1016/j.ref.2017.11.001.
- Bolsa Mercantil de Colombia, 2016. Mercado de gas natural.
- Boundy, B., S. W. Diegel, L. Wright, and S. C. Davis. 2011. Biomas Energy Data Book. 4th ed. U.S.: Department of Energy, Tenesse.
- Browne, J. D., E. Allen, and J. D. Murphy. 2014. “Assessing the Variability in Biomethane Production from the Organic Fraction of Municipal Solid Waste in Batch and Continuous Operation.” Applied Energy 128: 307–314. doi:https://doi.org/10.1016/j.apenergy.2014.04.097.
- Brunner, P. H., and H. Rechberger. 2015. “Waste to Energy - Key Element for Sustainable Waste Management.” Waste Manag 37: 3–12. doi:https://doi.org/10.1016/j.wasman.2014.02.003.
- Cabello, J. J., M. Balbis, A. Sagastume, A. Pardo, M. J. Cabello, F. J. Rey, and J. G. Rueda-Bayona. 2019. “A Look to the Electricity Generation from Non-conventional Renewable Energy Sources in Colombia.” Int. J. Energy Econ. Policy 9. doi:https://doi.org/10.32479/ijeep.7108.
- Callegari, A., S. Bolognesi, D. Cecconet, and A. G. Capodaglio. 2020. “Production Technologies, Current Role, and Future Prospects of Biofuels Feedstocks: A State-of-the-art Review.” Crit. Rev. Environ. Sci. Technol 50 (4): 384–436. doi:https://doi.org/10.1080/10643389.2019.1629801.
- Campuzano, R., and S. González-Martínez. 2016. “Characteristics of the Organic Fraction of Municipal Solid Waste and Methane Production: A Review, Waste Management.” Elsevier Ltd. doi:https://doi.org/10.1016/j.wasman.2016.05.016.
- Castillo, M., E. F. Cristancho, and D. E. Victor Arellano, A. 2006. “Study of the Operational Conditions for Anaerobic Digestion of Urban Solid Wastes.” Waste Manag 26 (5): 546–556. doi:https://doi.org/10.1016/j.wasman.2005.06.003.
- CEIC, 2020. Colombia | CO: Discount Rate: End of Period | Economic Indicators [WWW Document]. Money Mark. Policy Rates Annu.
- Cengel, Y., M. Boles, and M. Kanoglu. 2019. Thermodynamics: An Engineering Approach. 9th ed. New York: McGraw-Hill Education.
- Chen, D., L. Yin, H. Wang, and P. He. 2014. “Pyrolysis Technologies for Municipal Solid Waste: A Review.” Waste Manag 34 (12): 2466–2486. doi:https://doi.org/10.1016/j.wasman.2014.08.004.
- Cheng, H., and Y. Hu. 2010. “Municipal Solid Waste (MSW) as a Renewable Source of Energy: Current and Future Practices in China.” Bioresour. Technol 101 (11): 3816–3824. doi:https://doi.org/10.1016/j.biortech.2010.01.040.
- Cheng, H., Y. Zhang, A. Meng, and Q. Li. 2007. “Municipal Solid Waste Fueled Power Generation in China: A Case Study of Waste-to-energy in Changchun City.” Environmental Science & Technology 41 (21): 7509–7515. doi:https://doi.org/10.1021/es071416g.
- Chifari, R., S. Lo Piano, S. Matsumoto, and T. Tasaki. 2017. “Does Recyclable Separation Reduce the Cost of Municipal Waste Management in Japan?” Waste Manag 60: 32–41. doi:https://doi.org/10.1016/j.wasman.2017.01.015.
- Concentra, 2020. Consumo y suscriptores por departamento | Concentra. Informes de Gas Natural [WWW Document].
- Congreso de la República de Colombia, 2015. Ley 1753 de 2015. Colombia.
- Council, W. E., 2016. World Energy Resources | 2016, World Energy Resources 2016. World Energy Council, London, United Kingdom. Accessed 25 Mar 2020 http://www.worldenergy.org/wp-content/uploads/2013/09/Complete_WER_2013_Survey.pdf
- Dalmo, F. C., N. M. Simão, H. Q. Lima, A. C. de, Medina Jimenez, S. Nebra, G. Martins, R. Palacios-Bereche, and P. Henrique de Mello Sant’Ana. 2019. “Energy Recovery Overview of Municipal Solid Waste in São Paulo State, Brazil.” J. Clean. Prod 212: 461–474. doi:https://doi.org/10.1016/j.jclepro.2018.12.016.
- Dang, Y., D. Sun, T. L. Woodard, L.-Y. Wang, K. P. Nevin, and D. E. Holmes. 2017. “Stimulation of the Anaerobic Digestion of the Dry Organic Fraction of Municipal Solid Waste (OFMSW) with Carbon-based Conductive Materials.” Bioresource Technology 238: 30–38. doi:https://doi.org/10.1016/j.biortech.2017.04.021.
- Davis, M., A. Moronkeji, M. Ahiduzzaman, and A. Kumar. 2020. “Assessment of Renewable Energy Transition Pathways for a Fossil Fuel-dependent Electricity-producing Jurisdiction.” Energy Sustain. Dev 59: 243–261. doi:https://doi.org/10.1016/j.esd.2020.10.011.
- De Morais Lima, P., F. Olivo, P. L. Paulo, V. Schalch, and C. Cimpan. 2019. “Life Cycle Assessment of Prospective MSW Management Based on Integrated Management Planning in Campo Grande, Brazil.” Waste Manag 90: 59–71. doi:https://doi.org/10.1016/j.wasman.2019.04.035.
- Dereli, R. K., M. E. Ersahin, C. Y. Gomec, I. Ozturk, and O. Ozdemir. 2010. “Co-digestion of the Organic Fraction of Municipal Solid Waste with Primary Sludge at a Municipal Wastewater Treatment Plant in Turkey.” Waste Manag. Res 28 (5): 404–410. doi:https://doi.org/10.1177/0734242X09338227.
- Di Maria, F., and C. Micale. 2015. “Life Cycle Analysis of Incineration Compared to Anaerobic Digestion Followed by Composting for Managing Organic Waste: The Influence of System Components for an Italian District.” The International Journal of Life Cycle Assessment 20 (3): 377–388. doi:https://doi.org/10.1007/s11367-014-0833-z.
- Ding, Y., J. Zhao, J.-W. Liu, J. Zhou, L. Cheng, J. Zhao, Z. Shao, et al. 2021. “A Review of China’s Municipal Solid Waste (MSW) and Comparison with International Regions: Management and Technologies in Treatment and Resource Utilization.” Journal of Cleaner Production 293: 126144. doi:https://doi.org/10.1016/j.jclepro.2021.126144.
- Dong, J., Y. Tang, A. Nzihou, Y. Chi, E. Weiss-Hortala, and M. Ni. 2018. “Life Cycle Assessment of Pyrolysis, Gasification and Incineration Waste-to-energy Technologies: Theoretical Analysis and Case Study of Commercial Plants.” Sci. Total Environ. J 626: 744–753. doi:https://doi.org/10.1016/j.scitotenv.2018.01.151.
- EPA, 2021. Basic Information about Landfill Gas [WWW Document]. Landfill Methane Outreach Progr. CONTACT US.
- Escamilla-García, P. E., R. H. Camarillo-López, R. Carrasco-Hernández, E. Fernández-Rodríguez, and J. M. Legal-Hernández. 2020. “Technical and Economic Analysis of Energy Generation from Waste Incineration in Mexico.” Energy Strateg. Rev 31: 100542. doi:https://doi.org/10.1016/j.esr.2020.100542.
- European Parliament. 2008. “Directive 2008/122/EC of the European Parliament and of the Council.” Official Journal of the European Union, L312, 3–30. https://eur-lex.europa.eu/legal-content/EN/TXT/PDF/?uri=CELEX:32008L0098&from=EN.
- Federación Nacional de Biomcombustible, 2020. Precio De Alcohol Carburtante (Etanol) [WWW Document]. Estadísticas. Accessed 19 Jan 2021. https://www.fedebiocombustibles.com/estadistica-precios-titulo-Alcohol_Carburante_(Etanol).htm
- Gabriel, C. A., J. Kirkwood, S. Walton, and E. L. Rose. 2016. “How Do Developing Country Constraints Affect Renewable Energy Entrepreneurs? Energy Sustain.” Dev 35: 52–66. doi:https://doi.org/10.1016/j.esd.2016.09.006.
- Gebreslassie, M. G., H. B. Gebreyesus, M. T. Gebretsadik, S. T. Bahta, and S. E. Birkie. 2020. “Characterization of Municipal Solid Waste’s Potential for Power Generation at Mekelle City as a Waste Minimisation Strategy.” Int. J. Sustain. Eng 13 (1): 68–75. doi:https://doi.org/10.1080/19397038.2019.1645757.
- Ghosh, P., S. Sengupta, L. Singh, and A. Sahay. 2020. “Life Cycle Assessment of Waste-to-bioenergy Processes: A Review.” In Bioreactors, edited by L. Singh, A. Yousuf, and D. M. Mahapatra, 105–122. Amsterdam, Netherlands: Elsevier. doi:https://doi.org/10.1016/b978-0-12-821264-6.00008-5.
- Giusti, L. 2009. “A Review of Waste Management Practices and Their Impact on Human Health.” Waste Manag 29 (8): 2227–2239. doi:https://doi.org/10.1016/j.wasman.2009.03.028.
- Gobierno Nacional, 2014. Ley 1715, Congreso de la República de Colombia.
- Götz, M., J. Lefebvre, F. Mörs, A. McDaniel Koch, F. Graf, S. Bajohr, R. Reimert, and T. Kolb. 2016. “Renewable Power-to-Gas: A Technological and Economic Review.” Renewable Energy 85: 1371–1390. doi:https://doi.org/10.1016/j.renene.2015.07.066.
- Guevara, P., and D. M. Rodriguez. 2013. “Area Metropolitana de Barranquilla.” In CCAC Municipal Solid Waste Initiative. Vienna, Austria. https://www.waste.ccacoalition.org/sites/default/files/files/events_documents/PriscilaGuevara-PRESENTACIONVIENA-AUSTRIARESIDUOS-DR.pdf
- Guo, M., W. Song, and J. Buhain. 2015. “Bioenergy and Biofuels: History, Status, and Perspective.” Renew. Sustain. Energy Rev 42: 712–725. doi:https://doi.org/10.1016/j.rser.2014.10.013.
- He, Z., J. Xiong, T. S. Ng, B. Fan, and C. A. Shoemaker. 2017. “Managing Competitive Municipal Solid Waste Treatment Systems: An Agent-based Approach.” European Journal of Operational Research 263 (3): 1063–1077. doi:https://doi.org/10.1016/j.ejor.2017.05.028.
- Holmgren, J., 2014. The Road to Awesome [WWW Document]. Lanzatech.
- Hoornweg, D., and P. Bhada-Tata. 2012. What a Waste: A Global Review of Solid Waste Management. Washington: World Bank.
- IDEAM. 2016. Inventario nacional y departamental de gases efecto invernadero. Colombia: Instituto de Hidrología, Meteorología y Estudios Ambientales.
- IEA. 2017. Technology Roadmap. Delivering sustainable bioenergy. Paris, France: IEA Publications.
- IEA, 2020. Total Energy Supply (TES) by Source, World 1990-2018 [WWW Document]. Data Stat. URL https://www.iea.org/data-and-statistics?country=WORLD&fuel=Energysupply&indicator=TPESbySource (accessed 29 12 20).
- Interstate Waste Technologies. 2017. Overview of IWT’s Waste to Ethanol Project. Los Angeles.
- Jaiswal, A., and S. Kumar. 2019. “Waste Legislation across the Globe: An Overview.” In Current Developments in Biotechnology and Bioengineering: Waste Treatment Processes for Energy Generation, 11–30. Amsterdam, Netherlands: Elsevier. doi:https://doi.org/10.1016/B978-0-444-64083-3.00002-6.
- Karagiannidis, A., and G. Perkoulidis. 2009. “A Multi-criteria Ranking of Different Technologies for the Anaerobic Digestion for Energy Recovery of the Organic Fraction of Municipal Solid Wastes.” Bioresource Technology 100 (8): 2355–2360. doi:https://doi.org/10.1016/j.biortech.2008.11.033.
- Kumar, A., and S. R. Samadder. 2017. “A Review on Technological Options of Waste to Energy for Effective Management of Municipal Solid Waste.” Waste Manag 69: 407–422. doi:https://doi.org/10.1016/j.wasman.2017.08.046.
- Kumar Tyagi, V., L. A. Fdez-Güelfo, Y. Zhou, C. J. Álvarez-Gallego, L. I. Romero Garcia, and W. J. Ng, 2018. Anaerobic Co-digestion of Organic Fraction of Municipal Solid Waste (OFMSW): Progress and Challenges. Renewable and Sustainable Energy Reviews 93: 380–399. doi: https://doi.org/10.1016/j.rser.2018.05.051
- Kyriakis, E., C. Psomopoulos, and K. Kalkanis. 2019. “Investigating the Correlation of Purchase Power Parity (PPP) with the Adopted Waste Management Method in EU28.” Soc. Sci 8 (5): 162. doi:https://doi.org/10.3390/SOCSCI8050162.
- Larsson, A., I. Gunnasrsson, and F. Tengberg, 2019. The GoBiGas project demonstration of the production of biomethane from biomass via gasification.
- Leme, M. M. V., M. H. Rocha, E. E. S. Lora, O. J. Venturini, B. M. Lopes, and C. H. Ferreira. 2014. “Techno-economic Analysis and Environmental Impact Assessment of Energy Recovery from Municipal Solid Waste (MSW) in Brazil.” Resour. Conserv. Recycl 87: 8–20. doi:https://doi.org/10.1016/j.resconrec.2014.03.003.
- Li, Y., X. Zhao, Y. Li, and X. Li. 2015. “Waste Incineration Industry and Development Policies in China.” Waste Manag 46: 234–241. doi:https://doi.org/10.1016/j.wasman.2015.08.008.
- Liebetrau, J., T. Reinelt, A. Agostini, B. Linke, and J. D. Murphy, 2017. Methane Emissions from Biogas Plants. Methods for measurement, results and effect on greenhouse gas balance of electricity produced. IEA Bioenergy.
- Lombardi, L., E. Carnevale, and A. Corti. 2015. “A Review of Technologies and Performances of Thermal Treatment Systems for Energy Recovery from Waste.” Waste Manag 37: 26–44. doi:https://doi.org/10.1016/j.wasman.2014.11.010.
- Lu, J. W., S. Zhang, J. Hai, and M. Lei. 2017. “Status and Perspectives of Municipal Solid Waste Incineration in China: A Comparison with Developed Regions.” Waste Manag 69: 170–186. doi:https://doi.org/10.1016/j.wasman.2017.04.014.
- Mainali, B., S. Pachauri, N. D. Rao, and S. Silveira. 2014. “Assessing Rural Energy Sustainability in Developing Countries.” Energy Sustain. Dev 19: 15–28. doi:https://doi.org/10.1016/j.esd.2014.01.008.
- Malinauskaite, J., H. Jouhara, D. Czajczyńska, P. Stanchev, E. Katsou, P. Rostkowski, R. J. Thorne, et al. 2017. “Municipal Solid Waste Management and Waste-to-energy in the Context of a Circular Economy and Energy Recycling in Europe.” Energy 141: 2013–2044. doi:https://doi.org/10.1016/j.energy.2017.11.128.
- Marchettini, N., R. Ridolfi, and M. Rustici. 2007. “An Environmental Analysis for Comparing Waste Management Options and Strategies.” Waste Manag 27 (4): 562–571. doi:https://doi.org/10.1016/j.wasman.2006.04.007.
- Melo, A. I. 2014. “Vista de Generación de residuos sólidos en el municipio de Galapa (Atlántico) y su aprovechamiento como forma de minimizar la problemática ambiental.” Rev. INGE CUC 10: 89–96.
- MINMINAS. 2018. Boletín Estadístico Trimestre II De 2018 Abril a Junio. Bogota, Colombia: MINISTERIO DE MINAS Y ENERGIA (MINMINAS).
- MINVIVIENDA. 2016. Resolución 596 De 2016. Bogotá, Colombia.
- MINVIVIENDA. 2018. Decreto 2412. Bogotá, Colombia.
- Mohee, R., and A. Mudhoo. 2012. “Energy from Biomass in Mauritius: Overview of Research and Applications”. In Waste to Energy. Opportunities and Challenges for Developing and Transition Economies, edited by A. Karagiannidis, 297–322. London, United Kingdom. doi:https://doi.org/10.1007/978-1-4471-2306-4.
- Mukherjee, C., J. Denney, E. G. Mbonimpa, J. Slagley, and R. Bhowmik. 2020. “A Review on Municipal Solid Waste-to-energy Trends in the USA.” Renew. Sustain. Energy Rev 119: 109512. doi:https://doi.org/10.1016/j.rser.2019.109512.
- Murphy, J. D., and E. McKeogh. 2004. “Technical, Economic and Environmental Analysis of Energy Production from Municipal Solid Waste.” Renew. Energy 29 (7): 1043–1057. doi:https://doi.org/10.1016/j.renene.2003.12.002.
- Ndukwu, M. C., D. I. Onwude, L. Bennamoun, F. I. Abam, M. Simo-Tagne, I. T. Horsfall, and T. A. Briggs. 2020. “Nigeria’s Energy Deficit: The Challenges and Eco- Friendly Approach in Reducing the Energy Gap.” Int. J. Sustain. Eng 1–18. doi:https://doi.org/10.1080/19397038.2020.1842546.
- Nguyen, H. H., S. Heaven, and C. Banks. 2014. “Energy Potential from the Anaerobic Digestion of Food Waste in Municipal Solid Waste Stream of Urban Areas in Vietnam.” Int. J. Energy Environ. Eng 5 (4): 365–374. doi:https://doi.org/10.1007/s40095-014-0133-1.
- Nielsen, M., O.-K. Nielsen, and M. Thomsen. 2010. “Emissions from Decentralised CHP Plants 2007 - Energinet.dk.” In Environmental Project No, 07/1882. Aarhus, Denmark: National Environmental Research Institute.
- Nikkhah, A., I. Bagheri, C. Psomopoulos, H. Payman, H. Zareiforoush, M. El, H. Assad, A. Bakhshipour, and S. Ghnimi. 2019. “Energy Sources, Part A: Recovery, Utilization, and Environmental Effects Sustainable Second-generation Biofuel Production Potential in a Developing Country Case Study.” Energy Sources, Part A: Recovery, Utilization, and Environmental Effectsdoi:https://doi.org/10.1080/15567036.2019.1677805.
- Nzihou, A., N. J. Themelis, M. Kemiha, and Y. Benhamou. 2012. “Dioxin Emissions from Municipal Solid Waste Incinerators (Mswis) in France.” Waste Manag 32 (12): 2273–2277. doi:https://doi.org/10.1016/j.wasman.2012.06.016.
- Octavianthy, D., and W. W. Purwanto, 2019. Municipal Solid Waste to Electricity Using Anaerobic Digestion and Incineration Conversion Technologies: A Comparative Study, in: 2nd IEEE International Conference on Innovative Research and Development, ICIRD 2019, Jakarta, Indonesia. doi:https://doi.org/10.1109/ICIRD47319.2019.9074751
- OECD. 2020. Environment at a Glance 2020. Paris, France: OECD Publisher. doi:https://doi.org/10.1787/4ea7d35f-en.
- Pan, S. Y., M. A. Du, H. I. Te, I. H. Liu, E. E. Chang, and P. C. Chiang. 2015. “Strategies on Implementation of Waste-to-energy (WTE) Supply Chain for Circular Economy System: A Review.” J. Clean. Prod 108: 409–421. doi:https://doi.org/10.1016/j.jclepro.2015.06.124.
- Panepinto, D., V. Tedesco, E. Brizio, and G. Genon. 2014. “Environmental Performances and Energy Efficiency for MSW Gasification Treatment.” Waste and Biomass Valorization 6 (1): 123–135. doi:https://doi.org/10.1007/s12649-014-9322-7.
- Patumsawad, S., & Cliffe, K. R. (2002). Experimental study on fluidised bed combustion of high moisture municipal solid waste. Energy Conversion and Management, 43(17), 2329–2340. https://doi.org/https://doi.org/10.1016/S0196-8904(01)00179-0
- Pham, T. P. T., R. Kaushik, G. K. Parshetti, R. Mahmood, and R. Balasubramanian. 2015. “Food Waste-to-energy Conversion Technologies: Current Status and Future Directions.” Waste Manag 38: 399–408. doi:https://doi.org/10.1016/j.wasman.2014.12.004.
- Pivato, A., S. Vanin, R. Raga, M. C. Lavagnolo, A. Barausse, A. Rieple, A. Laurent, and R. Cossu. 2016. “Use of Digestate from a Decentralized On-farm Biogas Plant as Fertilizer in Soils: An Ecotoxicological Study for Future Indicators in Risk and Life Cycle Assessment.” Waste Manag 49: 378–389. doi:https://doi.org/10.1016/j.wasman.2015.12.009.
- Pour, N., P. A. Webley, and P. J. Cook. 2018. “Potential for Using Municipal Solid Waste as a Resource for Bioenergy with Carbon Capture and Storage (BECCS).” Int. J. Greenh. Gas Control 68: 1–15. doi:https://doi.org/10.1016/j.ijggc.2017.11.007.
- Psomopoulos, C. S., I. Limperis, and K. Kalkanis, 2019. Evaluating the Energy Demand for Municipal Solid Wastes Treatment Facilities: A Critical Approach toward Sustainable Development. AIP Conf. Proc, Vienna, Austria. 2190. doi:https://doi.org/10.1063/1.5138532
- Rahman, S. M. S., A. Azeem, and F. Ahammed. 2017. “Selection of an Appropriate Waste-to-energy Conversion Technology for Dhaka City, Bangladesh.” Int. J. Sustain. Eng 10: 1–6. doi:https://doi.org/10.1080/19397038.2016.1270368.
- Rajaeifar, M. A., H. Ghanavati, B. B. Dashti, R. Heijungs, M. Aghbashlo, and M. Tabatabaei. 2017. “Electricity Generation and GHG Emission Reduction Potentials through Different Municipal Solid Waste Management Technologies: A Comparative Review.” Renew. Sustain. Energy Rev 79: 414–439. doi:https://doi.org/10.1016/j.rser.2017.04.109.
- Ramírez, R., J. C. Arce, C. Jeréz, Y. Puertas, L. Gómez, J. Riaño, and O. Diaz. 2018. Boletín estadístico de minas y energía 2018. Bogotá, Colombia: Unidad de Planeación Minero Energética (UPME).
- Rapport, J., R. Zhang, B. M. Jenkins, R. B. Williams, A. Schwarzenegger, L. S. Adams, M. R. Brown, and B. Chair. 2008. Current Anaerobic Digestion Technologies Used for Treatment of Municipal Organic Solid Waste. California: Integrated Waste Management Board.
- Raven, R. P. J. M., and K. H. Gregersen. 2007. “Biogas Plants in Denmark: Successes and Setbacks.” Renew. Sustain. Energy Rev 11 (1): 116–132. doi:https://doi.org/10.1016/j.rser.2004.12.002.
- Reddy, P. J. 2016. Energy Recovery from Municipal Solid Waste by Thermal Conversion Technologies. Chennai, India: CRC press.
- Ribé, V. 2018. “OBSOLETE: Environmental Issues of Energy and Natural Resources.” In Reference Module in Earth Systems and Environmental Sciences. Amsterdam, The Netherlands: Elsevier. doi:https://doi.org/10.1016/b978-0-12-409548-9.09103-x.
- Rocamora, I., S. T. Wagland, R. Villa, E. W. Simpson, O. Fernández, and Y. Bajón-Fernández. 2020. “Dry Anaerobic Digestion of Organic Waste: A Review of Operational Parameters and Their Impact on Process Performance.” Bioresour. Technol 299: 122681. doi:https://doi.org/10.1016/j.biortech.2019.122681.
- Rollinson, A. N., and J. M. Oladejo. 2019. “‘Patented Blunderings’ Efficiency Awareness, and Self-sustainability Claims in the Pyrolysis Energy from Waste Sector.” Resour. Conserv. Recycl 141: 233–242. doi:https://doi.org/10.1016/j.resconrec.2018.10.038.
- Sagastume, A., J. J. Cabello Eras, L. Hens, and C. Vandecasteele. 2020. “The Energy Potential of Agriculture, Agroindustrial, Livestock, and Slaughterhouse Biomass Wastes through Direct Combustion and Anaerobic Digestion. The Case of Colombia.” J. Clean. Prod 269: 122317. doi:https://doi.org/10.1016/j.jclepro.2020.122317.
- Sataloff, R. T., M. M. Johns, and K. M. Kost. 2018. Principles and Applications of Fermentation Technology. 1st ed. Maryland, USA: John Wiley & Sons, .
- Sauve, G., and K. Van Acker. 2020. “The Environmental Impacts of Municipal Solid Waste Landfills in Europe: A Life Cycle Assessment of Proper Reference Cases to Support Decision Making.” Journal of Environmental Management 261: 110216. doi:https://doi.org/10.1016/j.jenvman.2020.110216.
- Secretaría de Planeación. 2015. Plan De Gestión Integral De Residuos Sólidos - PGIRS 2016-2017. Barranquilla, Colombia.
- Seemann, M., and H. Thunman. 2019. “Methane Synthesis.” In Substitute Natural Gas from Waste: Technical Assessment and Industrial Applications of Biochemical and Thermochemical Processes, edited by Massimiliano Materazzi, Pier Ugo Foscolo, 221–243. London, United Kingdom: Elsevier. doi:https://doi.org/10.1016/B978-0-12-815554-7.00009-X.
- Siddiqi, A., M. Haraguchi, and V. Narayanamurti. 2020. “Urban Waste to Energy Recovery Assessment Simulations for Developing Countries.” Word Dev 131: 104949. doi:https://doi.org/10.1016/j.worlddev.2020.104949.
- Siddique, R. 2008. “Waste Materials and By-products in Concrete, Waste Materials and By-Products in Concrete.” Springer-Verlag Berlin Heidelberg. Berlin, Germany. doi:https://doi.org/10.1007/978-3-540-74294-4.
- Silva, L. J., S. De V.b. Da, I. F. S. dos, J. H. R. Mensah, A. T. T. Gonçalves, and R. M. Barros. 2020. “Incineration of Municipal Solid Waste in Brazil: An Analysis of the Economically Viable Energy Potential.” Renew. Energy 149: 1386–1394. doi:https://doi.org/10.1016/j.renene.2019.10.134.
- Slorach, P. C., H. K. Jeswani, R. Cuéllar-Franca, and A. Azapagic. 2019. “Environmental Sustainability of Anaerobic Digestion of Household Food Waste.” Journal of Environmental Management 236: 798–814. doi:https://doi.org/10.1016/j.jenvman.2019.02.001.
- Stürmer, B., F. Kirchmeyr, K. Kovacs, F. Hofmann, D. Collins, C. Ingremeau, and J. Stambasky, 2016. Technical-economic analysis for determining the feasibility threshold for tradable biomethane certificates.
- Superservicios. 2017. “Disposición Final De Residuos Sólidos.” In Informe nacional - 2016. Bogotá, Colombia: Superintendencia de Servicios Públicos Domiciliarios (SUPERSERVISIOS).
- Superservicios, 2018. Informe de disposición final de residuos sólidos – 2017. Bogotá.
- Superservicios, 2019. Disposición Final de Residuos Sólidos.
- SUPERSERVICIOS. 2020. Consolidado Energía Por Empresa Departamento Y Municipio [WWW Document]. Bogotá, Colombia: Sist. Único Inf. Serv. Públicos Domic.
- Surendra, K. C., D. Takara, A. G. Hashimoto, and S. K. Khanal. 2014. “Biogas as a Sustainable Energy Source for Developing Countries: Opportunities and Challenges.” Renew. Sustain. Energy Rev 31: 846–859. doi:https://doi.org/10.1016/j.rser.2013.12.015.
- Themelis, N. J., M. E. Diaz Barriga, P. Estevez, and M. Gaviota Velasco. 2013. Guidebook for the Application of Waste to Energy Technologies in Latin America and Other Developing Regions. New York: EARTH ENGINEERING CENTER, COLUMBIA UNIVERSITY.
- Thermoselect, S. A. 2003. Thermoselect. An advanced Field Proven High Temperature Recycling Process. Locarno, Switzerland.
- Thrän, D., E. Billig, T. Persson, M. Svensson, J. Daniel-Gromke, J. Ponitka, M. Seiffert, et al. 2014. Biomethane-status and Factors Affecting Market Development and Trade. Paris, France: IEA Bioenergy.
- Thunman, H., 2018. GoBiGas demonstration – a vital step for a large-scale transition from fossil fuels to advanced biofuels and electrofuels.
- Thunman, H., and M. Seemann. 2019. “The GoBiGas Plant.” In Substitute Natural Gas from Waste: Technical Assessment and Industrial Applications of Biochemical and Thermochemical Processes, edited by M. Materazzi and P. U. Foscolo, 455–474. London, United Kingdom: Elsevier . doi:https://doi.org/10.1016/B978-0-12-815554-7.00017-9.
- Thunman, H., C. Gustavsson, A. Larsson, I. Gunnarsson, and F. Tengberg. 2019. “Economic Assessment of Advanced Biofuel Production via Gasification Using Cost Data from the GoBiGas Plant.” Energy Sci. Eng 7 (1): 217–229. doi:https://doi.org/10.1002/ese3.271.
- Triana-Jiménez, K. M., and M. E. Velásquez Lozano. 2019. “Comparison of Biogas Production Obtained from Samples of Mitú and Sibundoy Municipal Solid Waste Comparación Del Potencial De Producción De Biogás Obtenido a Partir De Residuos Sólidos Urbanos Provenientes De Mitú Y De Sibundoy.” Ing. E Investig 39: 31–36. doi:https://doi.org/10.15446/ing.investig.v39n2.78597.
- Tschaplinski, T. J., and S. D. Simpson. 2019. Development of a Sustainable Green Chemistry Platform for Production of Acetone and Downstream Drop-in Fuel and Commodity Products Directly from Biomass Syngas via a Novel Energy Conserving Route in Engineered Acetogenic Bacteria. Tennessee, USA: Oak Ridge National Laboratory.
- Udomsri, S., M. P. Petrov, A. R. Martin, and T. H. Fransson. 2011. “Clean Energy Conversion from Municipal Solid Waste and Climate Change Mitigation in Thailand: Waste Management and Thermodynamic Evaluation.” Energy Sustain. Dev 15 (4): 355–364. doi:https://doi.org/10.1016/j.esd.2011.07.007.
- UPME. 2013. Cadena Del Gas Licuado Del Petroleo 2013. Bogota, Colombia: Unidad de Planeación Minero Energética (UPME).
- US EPA, 2018. National Overview: Facts and Figures on Materials, Wastes and Recycling [WWW Document]. Facts Fig. about Mater. Waste Recycl.
- Valencia, J., C. Correa, N. Niño, C. Valles, and C. Pérez, 2016. Boletín estadístico de minas y energía 2012 – 2016.
- Velasquez, M. 2018. Estimación de la huella de carbono de fuentes fijas industriales de la ciudad de Barranquilla. Colombia: Universidad del Norte.
- Vergel Acero, J. L. 2020. Tratamiento de residuos sólidos en el marco de la emergencia por COVID-19. Bogotá, Colombia: Ministerio de Vivienda, Ciudad y Territorio de Colombia (MINVIVIENDA).
- Waldheim, L., 2018. Gasification of Waste for Energy Carriers. A review, IEA Bioenergy. IEA Bioenergy.
- Wang, Z., & Geng, L. (2015). Carbon emissions calculation from municipal solid waste and the influencing factors analysis in China. Journal of Cleaner Production, 104, 177–184. https://doi.org/https://doi.org/10.1016/j.jclepro.2015.05.062
- XM, 2020. Noviembre 2020 [WWW Document]. Energía y Merc. Precio promedio y energía transada. Accessed 20 Jan 2021 http://www.xm.com.co/_layouts/xlviewer.aspx?id=/Precio.PromedioyEnergaTransada/Noviembre_2020.xlsx&Source=http%3A%2F%2Fwww.xm.com.co%2FPrecio%2520Promedio%2520y%2520Energa%2520Transada%2FForms%2FAllItems.aspx&DefaultItemOpen=1
- Yang, N., H. Zhang, L. M. Shao, F. Lü, and P. J. He. 2013. “Greenhouse Gas Emissions during MSW Landfilling in China: Influence of Waste Characteristics and LFG Treatment Measures.” Journal of Environmental Management 129: 510–521. doi:https://doi.org/10.1016/j.jenvman.2013.08.039.
- Yap, H. Y., and J. D. Nixon. 2015. “A Multi-criteria Analysis of Options for Energy Recovery from Municipal Solid Waste in India and the UK.” Waste Manag 46: 265–277. doi:https://doi.org/10.1016/j.wasman.2015.08.002.
- Zaman, A. U. 2010. “Comparative Study of Municipal Solid Waste Treatment Technologies.” Int. J. Environ. Sci. Technol 7 (2): 225–234. doi:https://doi.org/10.1007/BF03326132.
- Zhao, X., J. Gang, G. Wu, A. Li, and L. Wang. 2016. “Economic Analysis of Waste-to-energy Industry in China.” Waste Manag 48: 604–618. doi:https://doi.org/10.1016/j.wasman.2015.10.014
- Zheng, L., J. Song, C. Li, Y. Gao, P. Geng, B. Qu, and L. Lin. 2014. “Preferential Policies Promote Municipal Solid Waste (MSW) to Energy in China: Current Status and Prospects.” Renew. Sustain. Energy Rev. doi:https://doi.org/10.1016/j.rser.2014.04.049