
ABSTRACT
In recent decades, an increasing number of manufacturers have implemented a reverse supply chain (RSC) that takes back and recovers products, components, or packaging, thereby supporting the ideas of the circular economy. The literature has shown that the profitability of RSCs varies in the sense that some manufacturers profit from this while others do not. The causes of this variance, however, remain unclear. To add to the knowledge on this topic, this paper investigates the factors that influence RSCs’ financial performance. This is done through three case studies of RSCs at equipment manufacturers, focusing on the end-product, component, and packaging level, respectively. The findings show that the RSC initiatives were rather profitable at all three product levels. On the other hand, RSC profitability had only a slight relationship to reverse logistics and RSC design. By demonstrating the importance of factors other than reverse logistics, the present study suggests that future research should apply a broader focus when investigating RSCs’ impact on overall financial performance. By identifying a set of factors influencing profitability at the end-product, component, and packaging levels, the present study advances the understanding of RSC profitability and provides a basis for more holistic RSC research.
1. Introduction
The circular economy is a development approach that aims to benefit the environment, businesses, and society (EMF, Citation2017). For manufacturers, a circular economy approach implies a transformation of their supply chains from ‘take, make and dispose’ models to restorative systems that regenerate resources and reduce waste (EMF (Ellen MacArthur Foundation) Citation2017). Manufacturers can make this transformation by closing their supply chain loop in the form of a ‘reverse supply chain’ (RSC). This RSC takes back used items from the market for the purpose of recovery and resale or internal reuse. In addition to combatting the planet’s resource scarcity problem, resale and internal reuse give manufacturers opportunities to increase revenue and reducing costs (Govindan, Soleimani, and Kannan Citation2015; Larsen and Jacobsen Citation2016; Larsen et al. Citation2017; Wang, Zhou, and Yu Citation2019).
According to Huscroft et al. (Citation2013), ‘the RSC as a profit center’ is one of the areas that requires further RSC research. However, to establish the RSC as an independent profit-creating entity in an organisation, managers and academics require a better understanding of what factors are decisive for RSC profitability (i.e. the contribution of the RSC to the firm’s financial performance). In this context, many papers have been published about reverse transportation, reverse network design and inventory management (Ilgin and Surendra Citation2010; Sasikumar and Kannan Citation2008, Citation2009; Herbert-Hansen et al. Citation2017); however, these papers do not examine the relative importance of such individual factors in relation to profitability. In addition, more market-related factors have been studied, such as customers’ willingness to pay for recovered products and the degree of new product cannibalisation (Guide and Li Citation2010; Wu and Wu Citation2016). On the other hand, there is also a wide range of such factors that have only been given sparse attention in the literature (Larsen and Jacobsen Citation2016; Larsen et al. Citation2018). The question is, however: does the emphasis placed in the literature on certain factors reflect their importance?
There are no clear answers to this question, because the knowledge about the impacts of different factors on RSC profitability is sparse (Larsen et al. Citation2018). Thus, to add to this knowledge, three case studies of RSCs at equipment manufacturers are conducted. These cases take on a product life-cycle perspective in the sense that they focus on the component, end-product, and packaging levels, respectively, as called for in prior research (Guide and Van Wassenhove Citation2006).
The organisation of the remainder of the paper is as follows. Section 2 reviews the extant literature on RSC and its profitability. Section 3 describes the study’s research design. Section 4 describes and analyses the case studies. Section 5 discusses these findings and draws conclusions.
2. Literature review
This section first resumes the literature on RSC processes, after which RCS influencers are discussed. Finally, the theoretical foundation applied in the study is clarified.
2.1 RSC processes
Over the past two decades, the industrial use of RSCs, as well as the academic interest in the topic, has increased (Rubio, Chamorro, and Miranda Citation2008; Govindan, Soleimani, and Kannan Citation2015; Govindan and Soleimani Citation2017; Rajeev et al. Citation2017; Russo et al. Citation2019). There are several reasons for this development: 1) increasing raw material prices makes reuse attractive, 2) ‘green’ consumer segments are willing to pay premiums for sustainability in manufacturing, and 3) some industries’ regulations force firms to follow extended producer responsibilities that include materials recycling (Klausner and Hendrickson Citation2000; Stock, Speh, and Shear Citation2002; Ginsberg and Bloom Citation2004; Geyer, Van Wassenhove, and Atasu Citation2007; Guide and Van Wassenhove Citation2009). To provide a basic understanding of RSCs, Guide and Van Wassenhove (Citation2006) describe five interconnected processes. This is depicted in and subsequently discussed in relation to other RSC literature.
Figure 1. The reverse supply chain (adapted from Guide and Van Wassenhove Citation2006)
2.1.1 Used product acquisition
Customers play two roles in relation to RSCs because they both provide input for the RSC (used products) and purchase the RSC’s outcomes (recovered products). Acquiring used products from the market has been shown to be feasible (e.g. Guide and Jayaraman Citation2000; Clottey and Benton Citation2014; Liao, Deng, and Shen Citation2019; Russo et al. Citation2019). Product acquisition costs are the price of gaining ownership of used products. In this context, an original equipment manufacturer’s (OEM’s) cost of used product acquisition depends, among other things, on whether the OEM competes with independent remanufacturers for used products (Ferguson and Toktay Citation2006; Van Loon and van Wassenhove Citation2020).
The takeback of products may involve initial product screening to determine recoverability. This screening process requires salaries, equipment, and facility costs (Larsen and Jacobsen Citation2014). Furthermore, the cost of acquisition depends on the quality and quantity of the acquired end-of-life products (Liao, Deng, and Shen Citation2019; Yanikoglu and Denizel, Citation2020). In this context, Östlin, Sundin, and Björkman (Citation2008) present seven relationship types between the used-product-owning customers and the OEM.
2.1.2 Reverse logistics
The first step of in RSC processes is reverse logistics (Guide and Van Wassenhove Citation2009). This topic has received much attention in the literature (see the review by Wang et al. Citation2017), and for good reason. Specifically, Cannella, Bruccoleri, and Framinan (Citation2016) applied ‘what-if analyses’ to their systematic literature review of how reverse logistics impacts performance, which showed that closed-loop supply chains can outperform forward supply chains under both static and turbulent market demands.
The literature has also provided several methods via which to support the implementation of reverse logistics. This includes Jayaraman, Patterson, and Rolland (Citation2003), who discussed the profitability of reverse distribution and proposed a heuristic solution methodology to support the design of reverse distribution networks; Krikke et al. (Citation2008), who introduced an approach to optimise the transportation of dismantled materials from end-of-life vehicles; Krug, Guillaume, and Battaïac (Citation2021), who developed an approach to deal with the uncertainty of reverse flows, which was applied to a reverse facility location problem, and Wen at al. (Citation2018), who proposed a multi-agent simulation model to determine the impacts of quality regulation policies on the performance of remanufacturing supply chains that have non-waste returns.
2.1.3 Inspection and sorting
The inspecting and sorting process for used products has, on the other hand, not received much attention, and the same is the case for the impact of a firm’s sorting policy on overall RSC profitability. Examples of research with this focus include Van Wassenhove and Zikopoulos (Citation2010), who discussed how quality overestimation affects RSC profitability using a case focusing on the remanufacturing and selling of used mobile telephones. On this basis, they concluded that the ‘economical impact of poor classification is primarily affected by the extent of quality overestimation and the difference of acquisition and remanufacturing costs of sequential quality classes at the same or different suppliers’. Another related study is that of Robotis, Boyaci, and Verter (Citation2012), who investigated the effect of inspection capabilities on recovery costs. They concluded that, contrary to the general belief, uncertainty in relation to remanufacturing cost does not necessarily hinder such investments; rather, that the precise effects are dependent on the inspection capabilities, the firm’s available technologies and market parameters. Similarly, Hazen, Hall, and Hanna (Citation2012) used problem‐driven content analysis on the reverse logistics literature from 2000 to 2010 to determine which components impact firms’ reverse logistics disposition decisions. This gave rise to the conceptualisation of seven components that support the decision to further a product’s path in the RSC, which are described under profits and costs.
2.1.4 Recovery operation
Although the recovery process of an item depends on the nature and quality level of that item, four general cost parameters are relevant to most recovery processes. These are the cost of disassembling a used product, the cost of exchanging worn parts, the cost of refurbishing parts and reassembling the entire product, and the cost of testing the recovered product. Such processes, as well as the cost of the subcomponents that are inserted into the recovered product, have a direct impact on RSC profitability (Larsen and Jacobsen Citation2014).
An RSC can recover items using several types of recovery processes (Theirry et al., Citation1995; Guide and Van Wassenhove Citation2009; Gobbi Citation2011; Saha, Sarmah, and Moon Citation2016; Larsen et al. Citation2018). Profit-influencing factors depend on the type of process involved. Larsen and Jacobsen (Citation2014) introduce the term ‘RSC-function’, which describes what an RSC does (physically) and how the RSC contributes to the firm’s financial performance. The term ‘RSC-function’ has three constituent elements: 1) a process, e.g. repair or remanufacturing; 2) an item, e.g. a complete end-product or a component, and 3) a financially contributing purpose, e.g. resale in secondary markets or reuse as spare parts. A firm’s RSC can contain one or more RSC-functions, and the factors that influence RSC profitability largely depend on what specific functions the RSC contains (Larsen and Jacobsen Citation2014).
2.1.5 Resale and internal reuse
The value of recovered products is determined by customers’ willingness to pay (WTP). Consumers normally value remanufactured products less highly than new products (Debo, Toktay, and Van Wassenhove Citation2005). Remanufactured products are valued more highly than refurbished products because remanufactured products are upgraded to a higher quality level than refurbished products (Thierry et al. Citation1995; Steeneck and Sarin Citation2018). Further, recovered product remarketing may result in of the cannibalisation of new products (Guide and Li Citation2010), which also directly affects RSC profitability. Specifically, the resale of refurbished products may introduce dual channel competition given the selling of both new and refurbished products through the same channels, which may negatively affect one another’s sale numbers, depending on pricing, marketing and similarity (Taleizadeh, Sane Zerang, and Choi Citation2018a; Taleizadeh, Moshtagh, and Moon Citation2018b; Ding, Dong, and Pan Citation2016; Li and Li Citation2016).
Reselling recovered complete products is another way of extracting value through the RSC, as is the resale of components and/or used materials. In this context, Larsen and Jacobsen (Citation2015) identify eight ways a firm can reduce operating costs in that firm’s forward supply chain through reuse. Internal reuse implies having to produce fewer new items in-house, as well as purchasing fewer subcomponents and materials for these items. Reusing recovered components as spare parts in the servicing of their installed base of products and reusing packaging materials are examples of such internal reuse (Kleindorfer, Singhal, and Wassenhove Citation2005; Larsen, Deleuran, and Jacobsen Citation2015).
2.2 Direct and indirect influencers of RSC profitability
A distinction can be made between the direct influencers of RSC profitability and sub-level antecedents (or indirect influencers). As an example, disassembly costs directly influence RSC profitability, and if these disassembly costs are high, profitability is low. Disassembly costs are influenced by the sub-level antecedent ‘ease of disassembly’. If the disassembly ease is high, then the process is fast, and costs are low. While the sub-level antecedents may hold the key to understanding RSC profitability, the pathway to uncovering important sub-level antecedents leads through the identification of the important direct influencers (Guide and Van Wassenhove Citation2006).
Based on a systematic literature review of the impact of RSC on financial performance manufacturers (including 112 papers), Larsen et al. (Citation2018) identified 15 types of direct cost factors affecting RSC profitability. These are shown in .
Table 1. Direct costs factors of RSC (Larsen et al. Citation2018)
Additionally, the literature review by Larsen et al. (Citation2018) identified seven types of added benefits for RSC activities: (1) deterring effect on the part of selling recovered products on competitor entrance, (2) RSC-enabled new product revenue increases, (3) access to government subsidies, (4) addressing market pressure (e.g. the need for a better image), (5) a reduced risk of brand value erosion from independent recovery firms, (6) the ability to innovate using information from the RSC and (7) reduced scrapping costs per product.
2.3 Theoretical foundation
The theoretical foundation of the paper is based on Guide and Van Wassenhove’s (Citation2006) business perspective, which differs markedly from the traditional literature stream, which largely concerns reducing the cost of RSC processes. Specifically, this business perspective views the RSC as a value creator rather than a cost centre. represents this study’s interpretation of the crux of the business perspective and how the perspective differs from the cost reduction literature stream.
Figure 2. Business perspective on RSC
3. Research method
Existing research is sparse and inconclusive on many RSC profitability factors (Larsen et al. Citation2018). Therefore, this research applies the case study method because it promotes the investigation of a phenomenon by applying rich data from real-world settings (Barrat et al., Citation2011; Meredith et al. Citation1989; Voss, Tsikriktsis, and Frohlich Citation2002). Following Geyer and Jackson (Citation2004) and Larsen and Jacobsen (Citation2016), the study limits its scope to OEMs that manufacture durable and recoverable products, as well as spare parts for servicing these products. These firms conduct the assembly of all products and the fabrication of some components in-house, while the remaining components and all materials are purchased from suppliers. Furthermore, such firms have a primary market for their products, as well as some potential secondary markets for recovered products (Larsen and Jacobsen Citation2016). Thus, OEMs fit the scope of this research because they encompass the majority of RSC processes.
3.1 Case context
Within the scope defined above, two relevant companies were identified. A central argument for choosing these two particular companies was their willingness to provide access to relevant information and manufacturing sites and spend resources on facilitating research activities. The two companies are labelled Firm A and Firm B based on requests for anonymity. Firm A is a medium-sized manufacturer of measurement equipment. The firm manufactures its products in several locations on three continents and sells products worldwide, either directly to customers or via agents. Firm B is also a medium-sized manufacturer of measurement equipment. The firm carries out manufacturing and R&D in Europe and the US and sells its products worldwide through sales subsidiaries, while distributors serve smaller markets.
The study’s unit of analysis is the RSC-function, which, in this study, involves three cases, i.e. RSCs focused on end-products, components, and packaging, respectively. These three RSC functions involve the following:
Refurbishing used end-products for resale to primary and secondary markets, which results in added revenue (Firm A)
Refurbishing used components for internal reuse, which results in the avoidance of purchasing and manufacturing costs for new components (Firm B)
Reuse of packaging materials to replace the purchase of new packaging materials (Firm B)
illustrates the RSC of the three RSC-functions.
Figure 3. An RSC containing three RSC-functions
3.2 Data collection
The case studies collected data using interviews, observations, and mail correspondence. The interviews were semi-structured and included seven key informants, who were selected based on proximity to and insights into their respective firms’ RSC processes. For each of the three cases, the interviewers sought to gain a thorough understanding of the RSC in focus and the factors that influenced its profitability. To do so, first, interviewees were asked to provide information on the RSC in focus, which concerned the RSC’s purpose, the RSC’s scope (i.e. components, end-products, or packaging included or excluded), and the RSC’s process steps. Hereafter, a set of questions related to RSC profitability was asked (Appendix 1 shows the questions prepared for the end-product case). Next, the interviewees were asked to mention any factors they could think of that they believed influenced the RSC’s profitability. To ensure that the interviewees did not neglect to consider certain types of factors, the overview produced by Larsen et al. (Citation2018) was utilised when interviewees could not list additional factors.
Because both case firms are medium-sized, the number of informants necessary for acquiring all necessary information was relatively low. The persons interviewed in the two companies are shown in .
Table 2. List of informants
The study interviewed informants in two rounds. The first-round interviews were with the senior-level informants from each case firm – for Firm A, the senior manager of global logistics, and for Firm B, the supply chain director. These interviews were recorded. Based on the first-round interviews, the study mapped the RSC processes for each case. These results were quality-checked in subsequent interviews with the other informants.
During the study, the case firms’ European manufacturing sites were visited several times. During these visits, the researchers inspected reusable products and components, examined physical reverse and forward supply chain processes and collected documentation about products and markets. Some quantitative data necessary for the analysis were collected directly during the interviews, while the remaining quantitative data were collected through written data requests.
3.3 Data analysis
The study analysed each factor’s relative impact on RSC profitability using the same three-step procedure for each of the three cases. The first step of the analysis focused on identifying a set of direct influencers of RSC profitability. This was accomplished through the coding of the interview transcripts (Flick Citation2018). Specifically, first, statements describing RSC factors were highlighted in the interview transcripts. Then, the identified statements were analysed and formulated into a set of RSC profitability influencers. The second step involved the quantification of each of the 20 identified influencers. This was done by using the retrieved cost data, supported by informal interviews, to allocate costs to each RSC-influencer. The third step concerned calculations of the profits or losses associated with each RSC-function. Once the profits of each RSC-function were calculated, the researchers analysed the sensitivity of the calculated profit by increasing each direct influencer, one-by-one, by 20%. For each increase, the study observed the impact on the calculated profitability to identify the most decisive factors.
The calculation of RSC profit for the RSC-function within each of the three cases was based on the following expression:
∑I: Total incomes from the RSC-function
∑PC: Total costs of all processes in the RSC-function
∑OC: Total other costs of the RSC-function (e.g. cannibalisation costs)
The direct influencers impact either ∑I, ∑PC, or ∑OC, and which of these direct influencers impact depends on the RSC-function in question. For the quantification of those factors that are constituted by continuous future income streams, the study uses a five-year time horizon. These future income streams are discounted at a 5% rate. The five-year horizon and the 5% discount rate are chosen to account for the change in the value of future cash flows. Although future cash flows from service operations are uncertain vis-à-vis certain and known sales prices, omitting these cash flows would exclude a distinct direct influencer.
4. Case study findings
This section is divided into three subsections, presenting results for Cases 1, 2 and 3, respectively.
4.1 Case 1: end-product refurbishing and resale
Firm A refurbishes most of its product portfolio. The firm has historically used the sales of recovered products to capture market share in price-sensitive market segments that are either unwilling or unable to purchase the firm’s new products. Product recovery and resale have been conducted for as long as any of the interviewees could remember.
In Firm A, the RSC-function involves the following overall process: (1) a subsidiary acquires a used product, (2) the subsidiary ships the product to the firm’s factory for refurbishing, (3) another subsidiary sells the refurbished product and sends a refurbishing order to the factory, (4) the factory recovers the product and ships the product to the firm’s subsidiary and (5) the subsidiary ships the recovered product. The RSC data associated with this process, which are used in the calculations below, include the following:
Sales price for new product:€ 30.000
Sales price for recovered product:€ 15.000
Acquisition price for used product:€ 5.000
Total costs of all RSC processes:€ 815
Price for a one-year service contract:€ 3.000
Next, the factors influencing this process were identified. These are described in , in which each column represents one of the three elements in expression (1) (as described in the ‘Research method’ section).
Table 3. Direct influencers in Case A1
Some of the earnings and costs associated with the influencers described in do not require quantification (e.g. the recovered products sales price), while others do (e.g. cannibalisation costs). In this context, Incomes (∑I) describe the net earnings from servicing the recovered product (b), which depend on the net earnings the firm receives from its service operations and whether the customer purchases a service contract or service on an ‘ad-hoc’ basis. The following expression quantifies the term:
NES:Net earnings from service contract over five years
PSC:Probability that customer purchases a service contract
NEAS:Net earnings on ad-hoc service
Selling a recovered product to a customer increases the probability of selling an additional new product to the same customer because the customer grows accustomed to the firm’s product, software, and procedures (c). The following expression quantifies the term:
NEV:Net earnings from sales of a new product
PNP:Probability that customer needs another product
PF1:The probability that the customer would choose the firm’s product havingpurchased the recovered product previously
PF2:The general probability of customers choosing the firm’s product
PF1-PF2 expresses the increase in probability. The initial sale of the recovered product enables this increase. The calculation presumes the customer needs a new product three years after the initial sale.
When the customer purchases the new product, the firm receives earnings from servicing that new product (d) in Years four and five. The following expression quantifies the term:
NES:Net earnings from service contract in Years four and five
PSC:Probability that the customer purchases a service contract
NEAS:Net earnings on ad-hoc service
PNP:Probability that the customer requires another product
PF2:The probability that the customer would choose the firm’s product havingpurchased the recovered product previously
PF1:The general probability of customers choosing the firm’s product
Process costs (∑PC) are calculated through field (e), (h), (j), and (l) as the ‘number of working hours x hourly wage’. Process costs (j) and (l) include the costs of using the firm’s factory facility, in addition to hourly wages. All inventory costs (f), (i), (k), (m), and (o) are calculated using the traditional inventory cost calculation method ‘value x time x inventory carrying cost rate’.
Other costs (∑OC) include ‘new product cannibalisation costs’ (s) and ‘sales costs’ (t), which require quantification. In this context, the risk of cannibalising new product sales is quantified as follows:
PC:Probability of cannibalising a new product sale when selling a recoveredproduct
NEV:Net earnings from sales of a new product
Sales cost (t) is quantified as ‘the number of working hours of sales staff x hourly sales staff wage’. The cost of components (r) needed in the recovery process is added to the costs of performing the recovery process so that the study can show the total cost of recovery in the analysis.
The result of Equationequation (1)(1) is € 17.500 profit per sale of recovered products. This number includes all incomes and costs. The result includes the derivative financial effects of the added probability of new product sales, cannibalisation of new product sales, and added service earnings. If the study of Case A1 were to exclude these influencers, then the profit would be € 8.300.
is the result of a sensitivity analysis, and it details how much each direct influencer impacts profitability. Specifically, each direct influencer is increased by 20%, and for every increase, the change in the RSC’s profit is described. For example, if the sales price of a recovered product increases by 20%, the RSC’s profitability increases by 17%, and if reverse logistics costs increase by 20%, the RSC’s profitability changes by less than 0.5%. It should be noted that this study groups inventory and transport costs into one ‘reverse logistics’ category and includes new component costs as a part of the ‘refurbishing process costs’.
Figure 4. Sensitivity analysis: Case 1
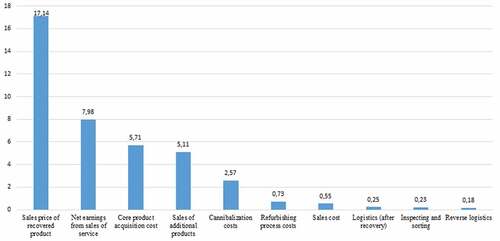
As seen in , only the size of the profit change is relevant to the study, not the direction of the change. Therefore, the columns represent absolute numbers. The analysis shows two important results:
If the sales price of the recovered product is increased by 20%, then the profitability increases by 17%.
If reverse logistics costs are increased by 20%, then the profitability increases by less than a half percent.
As shown in , the most important direct influencers are sales price, net earnings from the sales of service, used product acquisition costs, the value of additional sales and cannibalisation costs, while other factors contribute at a rate of less than one percent. Thus, these five influencers can be said to be the decisive factors in RSC profitability for RSC-functions that recover and resell products in the case studied.
4.2 Case 2: refurbishing of used components for internal reuse
In Firm B, the RSC-function reclaims and refurbishes components to avoid the purchasing of new materials and the manufacturing of new components. The firm uses the recovered components as spare parts in the firm’s service function. The cost elements (applied in the subsequent calculations) are as follows:
Cost of new component:€ 1.300
Acquisition price for used product:€ 0
Total costs of all RSC processes:€ 189
Cost of scrapping a used component:€ 16
The identified influencers involved in this process are described in .
Table 4. The set of influencers identified in the case
The following paragraphs detail the necessary quantification. In this case, Incomes (∑I) concern two types of incomes:
For every refurbished component, the firm avoids manufacturing a new component (a)
For every component the firm refurbishes and reuses, the firm avoids the costs of scrapping the used component (b)
These two incomes do not require quantification but are, instead, collected as fixed numbers from the case firm and a scrapping firm, respectively. Process costs (∑PC) include screening (d) and recovery (f) costs, which are calculated as the ‘number of working hours x hourly wage’ (f also includes facility costs). Inventory costs (e and g) are calculated using the traditional inventory cost calculation ‘value x time x inventory carrying cost rate’. Transport costs to and from a subsidiary (c and h) are collected from a transport firm. Other costs (∑OC) involve the firm paying to acquire their used components (i). The costs of these new parts (j) are collected from the firm without any need for further quantification.
Using the definitions above, the result of applying Equationequation (1)(1) is € 800 per component. details how much each direct influencer impacts the RSC-function’s profitability (the analysis is conducted as in Case 1).
Figure 5. Sensitivity analysis: Case 2
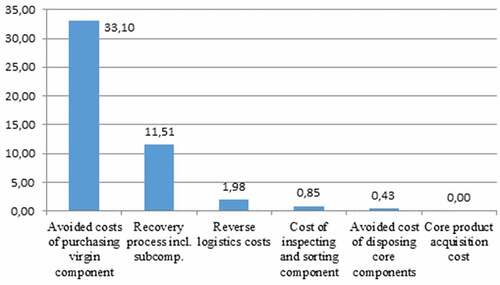
shows that the two most decisive factors, by far, are the avoided costs of manufacturing the new product and the recovery process costs. Of the recovery costs, 84% represent the costs of the new subcomponents inserted into the component. Finally, reverse logistics also constitutes more than one percent of the costs, while the remaining factors are less important.
4.3 Case 3: packaging materials reuse
The third case represents a ‘what-if’ scenario in which the firm begins taking back and reusing packaging materials, thereby avoiding the purchase of an equivalent amount of new packaging materials. In the scenario, the firm will take back, clean, and reuse polystyrene boxes and cooling elements that are used for transporting temperature-sensitive items, which the firm’s products use while operating.
The case deals with the firm’s operations in the German market. Every year, the firm sends around 12,000 shipments, and for each shipment, the firm purchases one new polystyrene box, which customers dispose of through their waste handling process. In addition to saving the firm the costs of purchasing new packaging materials, reusing packaging materials provides customers with the service of not having to handle packaging materials. Polystyrene boxes that are unfit for reuse are discarded at the firm’s site at the firm’s cost. The costs associated with this process (used in the subsequent calculations) are as follows:
Cost of new packaging materials for one shipment:€ 16–23
Added revenue from taking back packaging materials:€ 0
Total costs of all RSC processes:€ 7
Cost of scrapping a used component:€ 0.20
The identified influencers involved in this process are described in .
Table 5. The set of influencers identified in the case
The following paragraphs detail the necessary quantification. In this context, Incomes (∑I) concern the following:
1) Every piece of packaging material taken back the firm removes the cost of purchasing a new packaging material (a)
2) Customers may be willing to pay a marginally higher price for the service of having packaging materials taken back, which allows the customer to avoid the task of handling packaging materials (b)
14 In this case, Process costs (∑PC) are constituted by reverse logistical costs (c, d), which are collected from a third-party logistics provider that will collect and transport items from the German market to the firm’s factory, as well as the internal cost of screening and cleaning packaging materials (e). These are estimated by the firm’s logistics personnel. Other costs (∑OC) involve the cost of disposing of unusable packaging materials (i.), which is collected from the case firm as a per-kg number, whereafter it is multiplied by the weight of a polystyrene box and cooling elements.
Applying the definitions above, the result of using Equationequation (1)(1) is €9.74 per set of packaging materials for one shipment. Monthly, the RSC-function will result in profits of around €10.000. shows the sensitivity analysis for Case 3 (conducted as described in Case 1).
Figure 6. Sensitivity analysis: Case 3
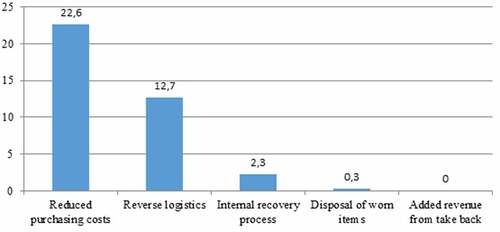
As seen in , the two most decisive factors, by far, are the avoided costs of purchasing new packaging materials and the reverse logistical costs of collecting and transporting used packaging materials. Additionally, internal recovery process costs also constitute more than one percent, while the remaining factors are less important.
5. Discussion and conclusions
As the literature study of this paper revealed, knowledge on the relative importance of the factors that determine the profitability of a firm’s RSC is sparse. By conducting three case studies at two OEMs at the end-product, component, and packaging levels, respectively, this research adds to the knowledge on this topic. While other studies have also focused on the factors influencing RSC profitability, this study stands out by comparing the impacts of such factors. Furthermore, in contrast to prior studies, the study includes considerations of service profits and the value of likely additional sales, thereby considering RSC profitability from a more holistic perspective.
The RSCs at all three product levels are substantially profitable. The study thereby supports the notion that RSCs can be profitable when accounting for an RSC’s overall impact on a firm’s financial performance.
The following six main patterns were found across the three case studies:
Profitability was strongly related to the market’s valuation of used products in relation to recovered products
Profitability was strongly related to the RSC’s derivative effects on the firm’s wider business (e.g. the firm’s service profits)
Profitability had only a slim relation to the way the RSC was designed.
Reverse logistics, which is widely researched, had minimal impact on RSC profitability
Decisive factors differed vastly across RSC-functions
RSCs were profitable in all three cases
Because this paper focuses on the impact of an RSC on the overall financial performance of a firm, surprisingly, the decisive factors for RSC profitability are mainly contextual rather than stemming from the inherent processes of the RSC. Specifically, for the recovery of end-products, the five most decisive factors are (1) the sales price for the recovered product, (2) the profit from servicing the recovered product during use, (3) the cost of acquiring the used product, (4) the up-sale of additional new products and (5) cannibalisation costs. For the recovery of components, the two far most decisive factors are (1) the avoided cost of manufacturing new components and (2) the costs of the recovery process. For the direct reuse of packaging materials, the two far most decisive factors are (1) the avoided cost of purchasing new materials and (2) reverse logistics costs.
The most decisive factors for RSC profitability in the cases studied stand in contrast with the intense academic focus on reverse logistics (Sasikuma and Kannan, Citation2008; Pokharel and Mutha Citation2009; Wang et al. Citation2017; Kaviani et al. Citation2020; Dutta et al. Citation2021) by revealing the importance of other factors that appear underexplored (Larsen et al. Citation2018). In this context, it should be noted that, while new product cannibalisation and customers’ WTP have been studied to a degree, increased service and new product up-sale have not received much attention (Larsen et al. Citation2018). In the present study, the impact on service sales is dependent on the customers’ need for service, while new product up-sale appears to depend on customers’ costs of switching from the OEM’s products to competing products. Thus, both relationships are interesting candidates for future research.
5.1 Implications for research
The first main contribution of the present study is that is demonstrates that factors other than reverse logistics can be the main determinants of RSC profitability. Because existing RSC research has mainly focused on reverse logistics, this finding therefore suggests that future research should apply a broader lens when exploring RSC. In other words, for the research community, the paper contributes by redirecting the focus from RSC processes (reverse logistics in particular) towards the RSC’s impact on overall financial performance. In addition to researching vehicle routing, inventory management, and network design, the study suggests a path towards a better understanding of the RSC’s impact on the forward supply chain’s ability to sell new products and services, as well as the potentially avoided cost of purchasing new components and packaging materials. Furthermore, this paper contributes to the academic challenge of establishing the RSC as an independent profit centre in the organisation by suggesting that future research should focus on the broader effects of RSCs in relation to firm financial performance.
The second main contribution concerns the identification of factors that influence RSC profitability at the end-product, component, and packaging levels, respectively. While these factors may have already been mentioned in the literature, the present study advances existing knowledge by providing an empirical basis supporting their relevance, as well by providing preliminary insights into their relevance. Thus, future studies may use these factors to broaden their scope from reverse logistics to a more holistic perspective on RSC. As is normal for explorative studies, their finding should not be perceived as conclusive but, rather, as a means of providing a more nuanced and deeper understanding of a phenomenon (Barratt, Choi, and Li Citation2011; Meredith et al. Citation1989; Voss, Tsikriktsis, and Frohlich Citation2002).
5.2 Implications for practice
For managers in manufacturing settings (at least OEMs), the study suggests that certain decisive factors have a higher profitability impact than many of the more commonly discussed factors (e.g. reverse network design and transportation), which, surprisingly, in the three cases mentioned above, have a minimal profitability impact. In other words, this study reveals that the decisive factors for RSC profitability exist outside the boundaries of traditional logistics or supply chain functions. To evaluate the profitability of a firm’s RSC, logistics managers must therefore share knowledge with their management colleagues from marketing, sales, service, and purchasing. Furthermore, the cases show that RSC can be rather financially profitable, in addition to being environmentally friendly, implying that such strategies deserve careful consideration.
5.3 Limitations and future research
The main limitation of the present study is that it involves only three cases, focusing on end-product, component, and packaging processes, respectively. The justification for this is the explorative nature of the study. Specifically, as shown by Isaac and Michael (Citation1995), explorative empirical research can provide important contributions when the research focus is relatively unexplored. In other words, case study research does not have generalisation as a goal. Instead, the present study raises some important questions regarding the focus of existing RSC research on certain factors. Specifically, the existing literature has largely focused on reverse logistics, but as shown by the present study, other RSC profitability factors, which so far have only received scant attention, may have comparable importance. Thus, future research must further explore the roles of such factors. In this context, the present study provides a foundation for such research by identifying a variety of such factors related to end-product, component, and packaging processes. Such research may apply a survey approach to provide more general knowledge on the relative importance of these.
A second limitation concerns the focus on OEMs, more specifically manufacturers of industrial measuring devices. In other words, the question is whether similar results could be expected at other types of OEMs. This, obviously, depends on the recoverability of the components, end-products, and packaging of the products of such OEMs. In this context, it appears that the implementation of RSCs is a least possible at some of these levels and that the challenges in implementing RSCs relate to issues other than product-related feasibility (Erol et al. Citation2010). For a better understanding of this issue, future research could apply a survey-based approach based on the RSC factors identified in the present study.
Disclosure statement
No potential conflict of interest was reported by the author(s).
Additional information
Notes on contributors
Samuel Brüning Larsen
Samuel Brüning Larsen is associate professor at the Technical University of Denmark (DTU) working with education, research, and innovation. Key areas include operations and supply chain management, the circular economy, and innovation. He leads a research group in Operations Management and Automation and heads the university’s engineering degree in transportation and logistics.
Zaza Nadja Lee Hansen
Zaza Nadja Lee Hansen, PhD, is department head in the Danish governmental sector. She received her PhD in Global Product Development from the Technical University of Denmark. She has worked for several years as a researcher, and after that both in the public and private sector, as a consultant and as a leader. She has published more than 100 papers. Her current research focuses on supply chain management.
Anders Haug
Anders Haug, PhD, is Associate Professor of Information and Technology Management at the University of Southern Denmark. He received his PhD in Knowledge Engineering from the Technical University of Denmark. He has worked for several years in the private sector as a Software Engineer and Business Consultant. He has published more than 100 journal and conference articles. His current research focuses on manufacturing technologies, data quality, knowledge-based systems, and IT management.
Lars Hvam
Lars Hvam, PhD, is Professor in Operations Management at the Technical University of Denmark. He has been working on production architectures, complexity management, digitalization and product configuration for more than 20 years as a teacher, a researcher and as consultant. He has supervised more than 15 Ph.D. projects and published more than 100 journal and conference articles.
Peter Jacobsen
Peter Jacobsen is associate Professor, emeritus at the Management Engineering Department at the Technical University of Denmark. His research area is design/simulation and management of production systems including introduction of new production philosophies such as lean and industry 4.0. Hi has supervised several master thesis and PhD projects in the area. Production systems covers both industrial and health care systems.
References
- Barratt, M., T. Y. Choi, and M. Li. 2011. “Qualitative Case Studies in Operations Management: Trends, Research Outcomes, and Future Research Implications.” Journal of Operations Management 29 (4): 329–342.
- Cannella, S., M. Bruccoleri, and J. M. Framinan. 2016. “Closed-loop Supply Chains: What Reverse Logistics Factors Influence Performance.” International Journal of Production Economics 175 (May): 35–49.
- Clottey, T., and W. C. Benton Jr. 2014. “Determining Core Acquisition Quantities When Products Have Long Return Lags.” IIE Transactions 46 (9): 880–893.
- Debo, L. G., L. B. Toktay, and L. N. Van Wassenhove. 2005. “Market Segmentation and Product Technology Selection for Remanufacturable Products.” Management Science 51 (8): 1193–1205.
- Ding, Q., C. Dong, and Z. Pan. 2016. “A Hierarchical Pricing Decision Process on A Dual-channel Problem with One Manufacturer and One Retailer.” International Journal of Production Economics 175: 197–212.
- Dutta, P., S. Talaulikar, V. Xavier, and S. Kapoor. 2021. “Fostering Reverse Logistics in India by Prominent Barrier Identification and Strategy Implementation to Promote Circular Economy.” Journal of Cleaner Production 294: 126241.
- EMF (Ellen MacArthur Foundation) (2017), “What Is the Circular Economy?”. accessed 4 January 2020. https://www.ellenmacarthurfoundation.org/circular-economy
- Erol, İ., M. Nurtaniş Velioğlu, F. Sivrikaya Şerifoğlu, G. Büyüközkan, N. Aras, N. Demircan Çakar, and A. Korugan. 2010. “Exploring Reverse Supply Chain Management Practices in Turkey.” Supply Chain Management 15 (1): 43–54.
- Ferguson, M. E., and L. B. Toktay. 2006. “The Effect of Competition on Recovery Strategies.” Production and Operations Management 15 (3): 351–368.
- Flick, U. 2018. Doing Grounded Theory. 2nd ed. London, UK: Sage.
- Geyer, R., and Jackson, T. 2004. ”Supply loops and their constraints: the industrial ecology of recycling and reuse.” California Management Review 46 (2): 55–73.
- Geyer, R., L. Van Wassenhove, and A. Atasu. 2007. “The Economics of Remanufacturing under Limited Component Durability and Finite Product Life Cycles.” Management Science 53 (1): 88–100.
- Ginsberg, J. M., and P. Bloom. 2004. “Choosing the Right Green Marketing Strategy.” MIT Sloan Management Review 46 (1): 79–84.
- Gobbi, C. 2011. “Designing the Reverse Supply Chain: The Impact of the Product Residual Value.” International Journal of Physical Distribution & Logistics Management 41 (8): 768–796.
- Govindan, K., and H. Soleimani. 2017. “A Review of Reverse Logistics and Closed-loop Supply Chains: A Journal of Cleaner Production Focus.” Journal of Cleaner Production 142 (1): 371–384.
- Govindan, K., H. Soleimani, and D. Kannan. 2015. “Reverse Logistics and Closed-loop Supply Chain: A Comprehensive Review to Explore the Future.” European Journal of Operational Research 240 (3): 603–626.
- Guide, V. D. R., and V. Jayaraman. 2000. “Product Acquisition Management: Current Industry Practice and a Proposed Framework.” International Journal of Production Research 38 (1): 3779–3800.
- Guide, V. D. R., and J. Li. 2010. “The Potential for Cannibalization of New Products Sales by Remanufactured Products.” Decision Sciences 41 (3): 547–572.
- Guide, V. D. R., and L. N. Van Wassenhove. 2006. “Closed‐loop Supply Chains: An Introduction to the Feature Issue Part 1.” Production and Operations Management 15 (3): 345–350.
- Guide, V. D. R., and L. N. Van Wassenhove. 2009. “The Evolution of Closed-loop Supply Chain Research.” Operations Research 57 (1): 10–18.
- Hazen, B. T., D. J. Hall, and J. B. Hanna. 2012. “Reverse Logistics Disposition Decision-making: Developing a Decision Framework via Content Analysis.” International Journal of Physical Distribution and Logistics Management 42 (3): 244–274.
- Herbert-Hansen, Z. N. L., S. B. Larsen, A. Nielsen, A. Groth, N. Gregersen, and A. Ghosh. 2017. “Combining or Separating Forward and Reverse Logistics.” International Journal of Logistics Management 29 (1): 216–236.
- Huscroft, J. R., B. T. Hazen, D. J. Hall, J. B. Skipper, and J. B. Hanna. 2013. “Reverse Logistics: Past Research, Current Management Issues, and Future Directions.” International Journal of Logistics Management 24 (3): 304–327.
- Ilgin, M., and G. Surendra. 2010. “Environmentally Conscious Manufacturing and Product Recovery ECMPRO: A Review of the State of the Art.” Journal of Environmental Management 91 (3): 563–591.
- Isaac, S., and W. B. Michael. 1995. Handbook in Research and Evaluation: A Collection of Principles, Methods, and Strategies Useful in the Planning, Design, and Evaluation of Studies in Education and the Behavioral Sciences. 3rd ed. San Diego, CA: EdITS Publishers.
- Jayaraman, V., R. A. Patterson, and E. Rolland. 2003. “The Design of Reverse Distribution Networks: Models and Solution Procedures.” European Journal of Operational Research 150 (1): 128–149.
- Kaviani, M. A., M. Tavana, A. Kumar, J. Michnik, R. Niknam, and E. A. R. D. Campos. 2020. “An Integrated Framework for Evaluating the Barriers to Successful Implementation of Reverse Logistics in the Automotive Industry.” Journal of Cleaner Production 272: 122714.
- Klausner, M., and C. Hendrickson. 2000. “Reverse-logistics Strategy for Product Take- Back.” Interfaces 30 (3): 156–165.
- Kleindorfer, P. R., K. Singhal, and L. N. Wassenhove. 2005. “Sustainable Operations Management.” Production and Operations Management 14 (4): 482–492.
- Krikke, H., I. le Blanc, M. van Krieken, and H. Fleuren. 2008. “Low-frequency Collection of Materials Disassembled from End-of-life Vehicles: On the Value of On-line Monitoring in Optimizing Route Planning.” International Journal of Production Economics 111 (2): 209–228.
- Krug, Z., R. Guillaume, and O. Battaïac. 2021. “Design of Reverse Supply Chains under Uncertainty: The Lexicographic R* Criterion for Exploring Opportunities.” International Journal of Production Research 59 (11): 3221–3236.
- Larsen, S. B., B. Deleuran, and P. Jacobsen. 2015. “The Profitability Drivers in Packaging Materials Reuse for Manufacturers in Business to Business Environments”, Ipsen, C. (Ed.), 3rd ScAIEM Conference, Technical University of Denmark, Lyngby, Denmark.
- Larsen, S. B., and P. Jacobsen. 2014. “Determining the Total Cost of Reverse Supply Chain Operations for Original Equipment Manufacturers”, Dittfeld, H., and Donk, V. (Eds.), Proceedings of the 21st EurOMA Conference, EurOMA, Palermo.
- Larsen, S. B., and P. Jacobsen. 2016. “Revenue in Reverse? an Examination of Reverse Supply Chain Enabled Revenue Streams.” International Journal of Physical Distribution and Logistics Management 46 (8): 783–804.
- Larsen, S. B., D. Masi, D. C. Feibert, and P. Jacobsen. 2018. “How the Reverse Supply Chain Impacts the Firm’s Financial Performance: A Manufacturer’s Perspective.” International Journal of Physical Distribution & Logistics Management 48 (3): 284–307.
- Larsen, S. B., D. Masi, P. Jacobsen, and J. Godsell. 2017. “How the Reverse Supply Chain Contributes to A Firm’s Competitive Strategy: A Strategic Alignment Perspective.” Production Planning and Control 29 (6): 452–463.
- Li, X., and Y. Li. 2016. “Chain-to-chain Competition on Product Sustainability.” Journal of Cleaner Production 112: 2058–2065.
- Liao, H., Q. Deng, and N. Shen. 2019. “Optimal Remanufacture-up-to Strategy with Uncertainties in Acquisition Quality, Quantity, and Market Demand.” Journal of Cleaner Production 206: 987–1003.
- Meredith, J. R., A. Raturi, K. Amoako-Gyampah, and B. Kaplan. 1989. “Alternative Research Paradigms in Operations.” Journal of Operations Management 8 (4): 297–326.
- Östlin, J., E. Sundin, and M. Björkman. 2008. “Importance of Closed-loop Supply Chain Relationships for Product Remanufacturing.” International Journal of Production Economics 115 (2): 336–348.
- Pokharel, S., and A. Mutha. 2009. “Perspectives in Reverse Logistics: A Review.” Resources, Conservation and Recycling 53 (4): 175–182.
- Rajeev, A., R. K. Pati, S. S. Padhi, and K. Govindan. 2017. “Evolution of Sustainability in Supply Chain Management: A Literature Review.” Journal of Cleaner Production 162: 299–314.
- Robotis, A., T. Boyaci, and V. Verter. 2012. “Investing in Reusability of Products of Uncertain Remanufacturing Cost: The Role of Inspection Capabilities.” International Journal of Production Economics 140 (1): 385–395.
- Rubio, S., A. Chamorro, and F. Miranda. 2008. “Characteristics of the Research on Reverse Logistics 1995–2005.” International Journal of Production Research 46 (4): 1099–1120.
- Russo, I., I. Confente, D. Gligor, and N. Cobelli. 2019. “A Roadmap for Applying Qualitative Comparative Analysis in Supply Chain Research: The Reverse Supply Chain Case.” International Journal of Physical Distribution & Logistics Management 49 (1): 99–120.
- Saha, S., S. P. Sarmah, and I. Moon. 2016. “Dual Channel Closed-loop Supply Chain Coordination with a Reward-driven Remanufacturing Policy.” International Journal of Production Research 54 (5): 1503–1517.
- Sasikumar, P., and G. Kannan. 2008. “Issues in Reverse Supply Chains, Part II: Reverse Distribution Issues–an Overview.” International Journal of Sustainable Engineering 1 (4): 234–249.
- Sasikumar, P., and G. Kannan. 2009. “Issues in Reverse Supply Chain, Part III: Classification and Simple Analysis.” International Journal of Sustainable Engineering 2 (1): 2–27.
- Steeneck, D. W., and S. C. Sarin. 2018. “Product Design for Leased Products under Remanufacturing.” International Journal of Production Economics 202: 132–144.
- Stock, J., T. Speh, and H. Shear. 2002. “Manny Happy Product Returns.” Harvard Business Review 80 (7): 16–17.
- Taleizadeh, A. A., M. S. Moshtagh, and I. Moon. 2018b. “Pricing, Product Quality, and Collection Optimization in a Decentralized Closed-loop Supply Chain with Different Channel Structures: Game Theoretical Approach.” Journal of Cleaner Production 189: 406–431.
- Taleizadeh, A. A., E. Sane Zerang, and T. S. Choi. 2018a. “The Effect of Marketing Effort on Dual Channel Closed Loop Supply Chain Systems.” IEEE Transactions on Systems, Man and Cybernetics: Systems 48 (2): 265–276.
- Thierry, M., M. Salomon, J. Van Nunen, and L. Van Wassenhove. 1995. “Strategic Issues in Product Recovery Management.” California Management Review 37 (2): 114–135.
- Van Loon, P., and L. N. van Wassenhove. 2020. “Transition to the Circular Economy: The Story of Four Case Companies.” International Journal of Production Research 58 (11): 3415–3422.
- Van Wassenhove, L. N., and C. Zikopoulos. 2010. “On the Effect of Quality Overestimation in Remanufacturing.” International Journal of Production Research 48 (18): 5263–5280.
- Voss, C., N. Tsikriktsis, and M. Frohlich. 2002. “Case Research in Operations Management.” International Journal of Operations and Production Management 22 (2): 195–219.
- Wang, -J.-J., H. Chen, D. S. Rogers, L. M. Ellram, and S. J. Grawe. 2017. “A Bibliometric Analysis of Reverse Logistics Research (1992–2015) and Opportunities for Future Research.” International Journal of Physical Distribution & Logistics Management 47 (8): 666–687.
- Wang, J., Z. Zhou, and M. Yu. 2019. “Pricing Models in a Sustainable Supply Chain with Capacity Constraint.” Journal of Cleaner Production 222: 57–76.
- Wen, D., J. Li, and T. Xiao. 2018. “Impact of Quality Regulation Policy on Performance of a Remanufacturing Supply Chain with Non-waste Returns.” International Journal of Production Research 57 (11): 3678–3694.
- Wu, C. H., and H. H. Wu. 2016. “Competitive Remanufacturing Strategy and Take-back Decision with OEM Remanufacturing.” Computers & Industrial Engineering 98: 149–163.
- Yanıkoğlu, İ., and M. Denizel. 2020. “The Value of Quality Grading in Remanufacturing under Quality Level Uncertainty.” International Journal of Production Research 59 (3): 839–859.