
ABSTRACT
Cities play an essential role in promoting the development of the whole national economy. Many scholars have proposed different methods to study this problem, but all have ignored the critical influence of network attention on the economy. Therefore, this study uses big Network data to profoundly analyse the relationship between urban spatial development and economic growth in eastern, central, and western China, further study this issue, and provide theoretical support for urban economic development. This study first divides China into three regions: eastern, central, and western, then selects the indicators of the national economy and urban development from 2014 to 2019, and finally constructs a panel regression model to explore the relationship between urban space elements and national economic development. The results show that China’s national economic development is closely related to spatial factors such as urban transportation, environment, science and technology, energy consumption, and housing price. These findings will help to make full use of the natural advantages of each region and guide the rational planning of the urban economy. This study provides references for urban development planning and industrial transfer in various regions of China and offers feasible suggestions for China’s overall national economic growth.
1. Introduction
Since the reform and opening-up, China’s national economy has moved forward steadily and developed rapidly, becoming the main force of world economic growth. With the successful conclusion of the 13th Five-Year Plan, China’s national economy has made historic achievements. The traffic facilities are perfect, forming an unimpeded comprehensive transport network. Our capacity to produce energy and ensure supply and demand has significantly improved. Inter-regional resource allocation has made Remarkable achievements, which alleviates the contradiction between regional development and resource supply. Several vital areas made breakthroughs, and the main targets of China’s 13th Five-Year Plan were successfully achieved. At present, China is in the first year of the ‘14th Five-Year Plan’ and the 2035 long-term goal, facing high-quality economic development. High-quality development should focus on the steady breakthrough of quality and promote the rational growth of quantity.
With the rapid rise of the tertiary industry, big data has become a new engine leading to high-quality economic development, playing a solid driving role in the economy. The significance of big data is to assist decision-making. Its rich data resources accumulate many user groups and a complete economic system, which is of immeasurable value to financial decision-making. The big data industry can overcome geographical constraints and boost the leapfrog development of a regional economy. For example, the New District of Gui’an has become China’s first national big data development centre; Chongzhou has become an essential base of the big data industry in Sichuan Province. In addition, big data can monitor environmental quality in a three-dimensional manner, accurately manage energy-consuming enterprises, improve people’s livelihood, and promote coordinated progress between the economy and the environment. Therefore, using big data to analyse the factors that affect the high-quality growth of the regional economy can provide a more scientific and reasonable basis for economic decision-making.
This study explores the urban spatial factors influencing China’s national economic development and further provides a theoretical basis for the rational division of labour of China’s urban economy and the use of regional natural advantages for the industrial undertaking. At the same time, it provides a reference for China’s national economic growth. As for national economic development, many scholars have investigated and analysed the factors affecting national economic expansion from different aspects, such as environment (Zahid et al. Citation2022; Mingdong, Hao, and Wang Citation2022), technological development (Alexis Sagastume, Fandiño Jorge M, and Eras Juan J Citation2021; František and Florian Citation2021; Slobodan, Andrea Andrejević, and Aleksandar Citation2021), transportation (Yuping and Ruizhi Citation2021; Minxue, Yukun, and Jingping Citation2019), energy consumption (Santosh Singh and Rajesh Citation2020; Tan et al. 2019), house price, and other livelihood consumption issues (Hua, Hui Min, and Tao Citation2011; Jianglin and Chen Hui Citation2014), and found the following problems. For example, science and technology can promote the sustainable development of the economy. Optimal power capacity planning can bring considerable economic benefits. Eco-environmental quality can significantly improve economic efficiency; There is a two-way promotion between transportation efficiency and economic development; The promoting effect of housing price on economic growth is inverted U-shaped change. In this way, many schemes are put forward, such as implementing regional real estate policies. Continuing to deepen the concept of ‘green water and green mountains are golden mountains and silver mountains’, accelerating the transformation from ecological and environmental advantages to economic advantages, implementing policy support, optimising transportation structure, and promoting high-quality economic development. Existing studies provide implementable suggestions and viewpoints for developing the national economy. Still, most of them are based on traditional data and carried out macro analysis from social policies, industrial structure, technical support, and other aspects. At the same time, there are relatively few micro studies on the combination of big data and traditional data. Therefore, based on the network data and panel data of China’s 30 provinces (due to data, not including Tibet, Hong Kong, Macau, and Taiwan), this paper uses the econometric panel regression model to analyse and explore the impact of comprehensive factors such as urban material space, social space, economic and industrial space and ecological space on China’s national economy, to provide a reference for the high-quality development of China’s economy.
The main contributions of this paper are as follows: 1) Establish a panel regression model combining traditional data and big network data, analyse the influence mechanism of various factors from the micro perspective, and provide a reference for the users of the model. 2) Analyse the development advantages of eastern, central, and western China through the model to carry out reasonable industrial layout, productivity planning, and promote sustainable economic growth. 3) This paper provides a supplementary reference for other scholars to research the national economy.
The paper is organised as follows: after this introduction, Section 2 describes the review of relevant literature; Section 3 explains the main steps and methods of the research; Section 4 shows the experimental results; Section 5 reports the discussion of the experimental results; Section 6 summarises the conclusions of the study; Section 7 expounds the future development.
2. Literature review
The economy is crucial to the development of a country. China’s national economy is influenced by many factors, including population, science, technology, nature, culture, etc. The research of existing scholars mainly includes: (1) Based on the effects of China’s relevant economic policy reforms on the national economy. Through the analysis of macroeconomic operation under the tax reduction policy, Ma Kewei (Kewei Citation2021) concluded that further reduction of VAT rate has a noticeable driving effect on the growth of the national economy. According to the CGE model, Duan Meng et al. (Meng, Feng, and Yuanyuan Citation2021) concluded that collecting real estate tax harms real GDP and proposed that measures should be taken according to local conditions to promote China’s real estate tax reform in an orderly manner. Xie Guanghua et al. (Guanghua et al. Citation2020) said that corporate investment could improve economic growth with moderate government subsidies. (2) Analysis of the impact of technological progress and development on the national economy. Based on the data from 2000 to 2019, He Ming et al. (Ming and Xiuwen Citation2021) adopted the empirical method of multiple regression and VAR model to study and concluded that technological innovation could significantly promote industrial-economic contribution. Using SEM spatial error model, Zhang Meitao (Meitao Citation2019) found that R&D expenditure and patent level could positively promote China’s regional economic growth and increase R&D spending. Based on the analysis of the input-output model, Sun Feihong (Feihong Citation2020) found that knowledge production has a solid driving effect on the economy, so the transformation capacity of knowledge production should be improved. (3) The contribution of different industries and industrial development to national GDP. Based on the data modelling and analysis of 31 provinces and cities in China, Jing Gang et al. (Gang and Liguo Citation2019) concluded that investment in real estate could drive economic growth to a certain extent. They suggested that related regulation policies should be different from place to place. Li Guo et al. (Guo, Tianfeng, and Qinghua Citation2019) found a positive correlation between the sports industry and national economic development. Using input-output and industrial correlation methods, Zhao Suping et al. (Suping and Ming Citation2015)concluded that the contribution of agricultural development to the national economy was low and proposed that the radiating role of the agricultural industry chain should be played to improve the contribution of agriculture to the national economy. (4) The influence of current social hot issues on the national economy. Guo Tao et al. (Tao and Rui Citation2020) said that the epidemic’s impact caused the shock shutdown of the national economy. Zeng Xiangang et al. (Xiangang and Fangfang Citation2020) concluded that PM2.5 pollution would cause labour and economic losses. Studies by Li Xiaofan (Xiaofan and Lingduo Citation2020) and others show that the Belt and Road initiative has promoted the opening-up and development of the central and western regions and contributed 0.397% to China’s GDP growth. (5) The impact of big data on the national economy. Based on the analysis of big data, Luo Yihong (Yihong Citation2019) believes that big data technology can promote the comprehensive efficiency of all sectors of the national economy. Hou Tianyu et al. (Tianyu and Jie Citation2017) concluded that Xinjiang’s big data industry positively affects Xinjiang’s economic development.
Generally speaking, China’s national economic development is driven by various social factors. Most existing studies tend to analyse single elements and provide feasible reference suggestions for national economic expansion from different aspects. However, how will the combination of multiple factors affect the national economy? Based on the previous achievements, this paper comprehensively analyzes the influence mechanism of the national economy from various elements of urban space. It puts forward a reasonable plan for national economic growth.
Compared with previous studies, this paper mainly has the following innovations: Firstly, from the perspective standpoint, most of the existing studies are empirical analyses based on yearbook data, without considering the current public concern. Considering that the core difference between traditional and big data lies in immeasurable value, this paper adopts the method of combining yearbook data and Baidu big data. It interprets from the macro and overall perspectives and studies its interior features from the microanalysis, meanwhile exploring the relationship between spatial development factors and national economic development. Secondly, in terms of the evaluation dimension, the evaluation indicators are evaluated from various spatial development perspectives and based on multidimensional data. Finally, in terms of regional heterogeneity, considering China’s vast territory geographical and economic level differences, this paper divides China into different regions for research according to relevant conference decisions. Therefore, this paper is helpful to understand the influencing mechanism of China’s national economy and has important reference significance for the high-quality and sustainable development of China’s economy.
3. Materials and methods
This study is divided into five steps ().
Figure 1. The main steps of the study.
Step 1: Select appropriate variables to measure the level of urban spatial development and define the variables. The detailed explanation is shown in Section 3.1.
Step 2: Find suitable data sources. Details are shown in Section 3.2.
Step 3: Data preprocessing to make it meet the needs of the panel model. Detailed preprocessing methods are shown in Section 3.3.
Step 4: Construct panel model. The detailed model building process is shown in Section 3.4.
Step 5: Test the model accuracy to ensure the rationality of the model. Detailed checking methods are presented in Section 3.5.
3.1. Variable selection and definition
The concept of ‘urban space’ is currently involved in urban planning, geography, economics, social sciences, and other fields, including urban physical space, urban geographic space, economic space, social space, and so on (Jie Citation2020). The urban spatial elements referred to in this paper are aimed at the city’s overall material, social, industrial, economic, and ecological space. On this basis, by quantifying the urban spatial elements into transportation, science and technology, environment, energy consumption, house price, and other aspects, this paper analyzes the impact of their development on the national economy.
Urban traffic is an essential guarantee for the vigorous development of material space. In this paper, civil car ownership, private car ownership, and online car booking index are selected as indicators to measure urban traffic. Science and technology are vital driving forces for the development of social space, and when science and technology prosper, a country prospers. In this paper, the number of R&D institutions represents the science and technology development level. Environmental Quality plays a vital role in constructing ecological space, which is mainly reflected in the degree of Air pollution. This paper selected Air Quality Index (AQI) and PM2.5 as the measurement indexes. Energy is the driving force of industrial spatial transformation and development. Coal, gasoline, and electricity consumption are chosen as indicators in this paper. Housing price is the ‘barometer’ of economic space changes, so urban housing price is used to affect economic space. is the specific definition of each variable.
Table 1. Definition of variables.
3.2. Data acquisition
The emergence of big data has changed the way people work, live, and communicate. It is an information asset formed through meaningful and professional comprehensive processing of massive and diversified information resources generated by the integration of human (human society), machine (information space), and object (physical world). Big data is often used for multi-dimensional data analysis and refined operation decisions. It plays a vital role in social production, consumption, and economic operation, among which Baidu’s big data is one of its manifestations. Baidu big data is a real-time record of the public’s willingness to pay attention, which has been used by many scholars (Long and Gan Citation2018; Renfu, Zuze, and Zemin Citation2019; Hao et al. Citation2020) for statistical analysis of current hot words, hot fields, and other aspects.
Given the availability and completeness of data, the analysis is based on panel data of 30 provinces in China from 2014 to 2019, and Baidu big data (Tibet, Hong Kong, Macau, and Taiwan are not studied in this paper because there is no relevant data in the Energy Yearbook). Secondly, 30 provinces are divided into three economic regions (East, central and west) according to the classification standards adopted by the National People’s Congress and the adjustment strategy of western Development (). The data sources of each index are as follows: gross regional product, number of motor vehicles, private car ownership, scientific and technological level, and urban housing price all come from the national statistical yearbooks over the years (China statistical yearbook Citation2015-2020 0000). Ride-hailing attention is obtained through Baidu’s extensive data statistics (Baidu Index Citation0000). AQI and PM2.5 come from the air quality index and PM2.5 index provided by the online air quality monitoring platform (Air Quality in China Citation0000). Coal, gasoline, and electricity consumption comes from the China Energy Statistical Yearbook (China Energy Statistical Yearbook, Citation2015–2020).
Table 2. Regional Division of Provinces.
3.3. Data pre-processing
3.3.1. Pseudo regression checking
Pseudo regression refers to a ‘false regression’ phenomenon in the regression model constructed by a group of variables when there is no co-integration relationship between a group of non-stationary time series. The original data was first logarithmic processed in this paper to avoid pseudo regression. Then the correlation coefficient between the explanatory variable and the explained variable was tested by Python to ensure the rationality of the data. The test rule is: if the linear correlation of two variable sequences passes the p-value (P < 0.1) test, it is said that there is a long-term stable equilibrium relationship between the two variable sequences. The data preprocessing is reasonable and can be checked in the next step.
3.3.2. Stationarity checking
The quality of panel model regression results is closely related to the stationarity of selected index variables. Therefore, to avoid abnormal results caused by the non-stationarity of variables, a unit root test should be conducted for each index variable. In this paper, EViews10 is used to test the heterogeneous unit root ADF of logarithmic processed indexes. The checking rules are as follows: first, it is assumed that the original sequence has unit-roots. After the checking, if the obtained significance statistics are less than 10%, 5%, and 1%, the probability of rejection of the original hypothesis is 90%, 95%, and 99%. The selected variable belongs to a stationary sequence; otherwise, it belongs to a non-stationary series. As for the non-stationary arrangements, difference processing is needed to test whether the first-order and second-order are stable in turn. When the sequence is steady, further panel regression analysis can be done.
3.4. Model building
The construction principle of the panel model is shown in , which mainly includes two parts: model building and model checking. Among them, the model construction includes data preprocessing, data testing, model selection and judgement, and finally, the establishment of the panel regression model. Model-checking is to test the rationality of the constructed model by calculating the error between the actual value and the predicted value of the model.
Figure 2. The principle of panel model construction.
3.4.1. Model selection
Since the research object of this paper is 30 provinces and regions in China, and there are two dimensions of time and individual, the panel data regression model reflecting multiple sections is selected to explore the effect of independent variables on dependent variables. Panel data can reduce the influence of multicollinearity, reduce the collinearity interference between variables, increase the degree of freedom of data, and improve the accuracy of econometric model estimation. The model is constructed as follows (Jianxun and Yixiao Citation2020):
In Formula (1), i represents the individual, and t represents the year; yit is the explained variable, that is, the gross national economic product of province i in t . ui is the intercept term; xit is the core explanatory variable, substituting indicators OnlineCar, MotorVehicles, PrivateCars, TECH, AQI, PM2.5, CoalConsum, GasConsum, ElectricityConsum, HousePrices, etc. is the coefficient term of the core explanatory variable, and
is the random disturbance term. To reduce errors caused by dimensionless inconsistency of data, logarithmic processing is performed on Formula (1), and the calculation formula is as follows:
3.4.2. Model judgement
There are usually three regression types of panel models: the POOL model, fixed FE model, and random RE model. The three models are judged and selected based on F test, BP test, and Hausman test (Qianying, Zhiqiang, and Chengsheng Citation2016), and the optimal regression type is determined through the three tests. Among them, the test criteria are as follows: F test is used to select and compare FE model and POOL model. If the P-value is less than 0.05, the FE model is better; otherwise, the POOL model is used. BP test is used for comparison between RE model and POOL model. A P-value less than 0.05 means that the RE model is better. Otherwise, the POOL model is used. Hausman test is used for selecting and comparing the FE model and RE model. A P-value less than 0.05 means the FE model is superior; otherwise, the RE model is used. Finally, one of the three test results is the model judgement result.
3.5. Model checking
Model checking is to determine the validity and credibility of the model. In this paper, the model is tested based on the model accuracy testing method used by Hou Na et al. (Hou, Jinmei, and Zhanjiang Citation2017) to ensure its economic significance. First, according to the regression results of the three regional models in the east, central and west, and the regional model formula constructed, the variable values of some provinces and cities in each region in 2019 were selected and put into the model to obtain the predictive value of 2019. Then, the actual and predictive values are substituted into (3), and the relative error is calculated to test the model’s accuracy.
is calculated by:
Where represents the error between the model-predicted value and the actual value, lnGDPactual represents the real gross value of the national economy of a particular province and city. lnGDPpredict represents the model appropriate expected value of the provincial, national economy.
4. Results
4.1. Results of data preprocessing
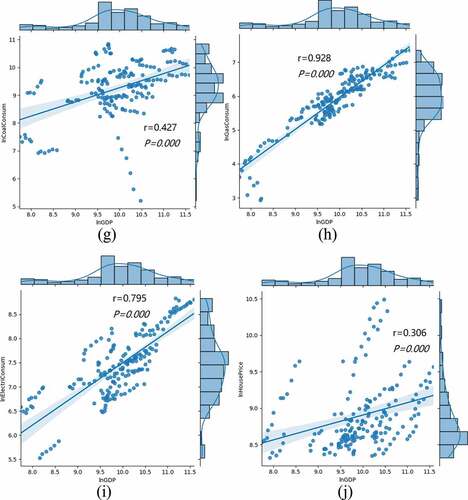
The gross regional Product (GDP) and index values of each factor of 30 provinces and autonomous regions in China from 2014 to 2019 were selected as sample data of the panel model. To avoid false regression, logarithmic pre-processing was performed on the original data. The correlation coefficients between logarithmic and explained variables were tested, and their analysis was visualised (). ) shows the relationship between lnGDP and lnMotoreVehicles. ) shows the relationship between lnGDP and lnParivateCars. ) shows the relationship between lnGDP and lnOnlineCars. ) shows the relationship between lnGDP and lnTECH. ) shows the relationship between lnGDP and lnAQI. ) shows the relationship between lnGDP and lnPM2.5. ) shows the relationship between lnGDP and lnCoalConsum. ) shows the relationship between lnGDP and lnGasConsum. ) shows the relationship between lnGDP and lnElectriConsum. ) shows the relationship between lnGDP and lnHousePrices.
Figure 3. Correlation test between variables.
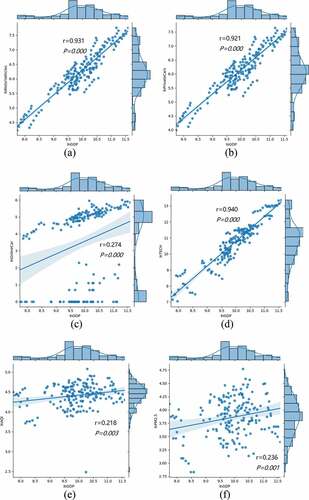
As shown from each subgraph in , lnGDP is correlated with each variable, but to different degrees. It was taking the correlation between the selected index in ) and lnGDP are examples for a specific explanation, and the same applies to other variables. In ), the Pearson coefficient of lnGDP and the motor vehicle (lnMotoreVehicle) is 0.931, and its test P-value is 0.000, indicating that there is a significant 1% correlation between lnGDP and the motor vehicle (lnMotoreVehicle). Therefore, it can be considered that there is a relationship between the selected indicator lnMotoreVehicle and lnGDP, and the pretreatment method of the variable is reasonable.
By comprehensive comparison of each subgraph in , it can be found that lnGDP is significantly positively correlated with the motor vehicle (lnMotoreVehicle), private vehicle (lnParivateCars), science and technology (lnTECH), gasoline consumption (lnGasConsum), and electricity consumption (lnElectriConsum) by 1%. The correlation degree with Internet hailing (lnOnlineCars), air quality index (lnAQI), PM2.5 (lnPM2.5), Coal consumption (lnCoalConsum), and urban housing price (lnHousePrices) is slightly lower, but all pass the P-value (P < 0.01) test, and are significant at the confidence level of 1%. It indicates that the pretreatment method is reasonable.
4.2. Results of stationarity test
According to ADF test rules and criteria, unit root tests were performed on Eastern, Central, and Western China variables. shows the test results of the logarithmic panel unit root of each index variable in eastern, central, and western China, and the corresponding p-value is in parentheses. It can be found that at zero-order, most of the P-values of variables in each region are more significant than 0.1. Only a few were between 0.01 and 0.1, indicating that the original hypothesis was valid. The initial sequence has a unit root, so it is necessary to check the first-order unit root of the variable. According to the first-order test results in the table, the P values of variables in each region are less than the significance level of 0.05, so all variables belong to the first-order stability and pass the test. Therefore, it can be considered that the logarithmic type of each index variable in the three regions has first-order stationarity. The index after differential stability has the condition of constructing a regression model to be modelled in the next step.
Table 3. Unit root test results of variables.
4.3. Result analysis of panel regression model
With the help of stata 15, this paper makes a panel data regression analysis on the three regions’ national economy and index factors. Combined with the F test, BP test, and Hausman test in the model judgement, select the optimal panel regression model in three regions of China. shows the model regression results of the three areas.
Table 4. Summary of panel model results in eastern, central and western regions.
According to each variable coefficients and constant terms of the model in , the respective regression models of the eastern, central, and western regions can be finally obtained.
Eastern region:
Central region..
Western region:
A comprehensive comparison of the panel model regression results of the three regions shows that the regression coefficients of each index variable are not the same, indicating that the gravity centre of each index factor in the eastern, central, and western regions is different.
From the perspective of transportation factors, motor vehicles, online ride-hailing, and private cars significantly impact the national economy in the eastern and central regions, respectively, but not in the western area. The central and east regions have the advantages of geography, transportation, and resources, essential to promoting passenger flow and logistics transportation. The vehicle has become a powerful driving force to promote economic development as necessary support of national economic development. With the DEA model, Song Min et al. (Min and Yixin Citation2019) calculated that urban transportation efficiency could boost the economic growth of the Yangtze River Delta. Transportation facilities are also the primary carrier of logistics development. The express delivery industry and modern logistics development must closely rely on the transportation industry. Zhu Changzheng et al. (Changzheng and Liang Citation2018) found that the logistics industry has the most substantial impact on the economy of eastern cities. Therefore, the development of the national economy in central and east China depends on the assistance of transportation advantages.
In terms of science and technology factors, science and technology levels positively impact 1% on the eastern, central, and western regions. Every 1% increase in science and technology input in the three areas will drive the economic growth of 0.225%, 0.159%, and 0.119%, respectively, indicating that Science and technology promote the economic development of each region. Among them, eastern China is the most significant, followed by central and western China. Comparing the indexes and factors in China west Vertically, we find that Science and technology occupy a large proportion in its national economy. Due to natural, economic, industrial, and other reasons, the western region lacks high-tech fields and high-tech talents. As the ways to enrich the country and strengthen the people, Science, technology, and education are essential in western China. Based on the empirical analysis of the data of six provinces in west China, Zhang Li (Zhang Citation2015) pointed out that Science and technology are crucial to the sustainable development of education, digital industry, and economy in western China, so the government should increase the investment ratio in Science and technology.
The air quality index is 5% significant for the central region in terms of environmental factors. The central area is the production base of many kinds of energy and raw materials in China, and heavy industry accounts for a large proportion. Eight of China’s top 10 coal-producing cities are central Shanxi Province and the Inner Mongolia Autonomous Region. Based on the air quality index analysis and research, Chang Qi et al. (Chang et al. Citation2021) concluded that industrial smoke and dust emissions and industrial electricity consumption are vital factors affecting air quality. PM2.5 harms both the eastern and central regions and is more significant in the central area; that is, every 1% increase in PM2.5 concentration in the air will worsen the economy by 0.370%. Using the CGE model, Zeng Xiangang et al. (Xiangang and Fangfang Citation2020) concluded that PM2.5 pollution caused 1.48% of GDP loss in China in 2017. According to Li Yong and others, the health burden and economic loss caused by PM2.5 are significantly different in space, mainly distributed in the central and eastern regions with high population density (Yong et al. Citation2021). Therefore, the environment significantly affects the national economy in the middle and east areas. The concept of ‘clear waters and green mountains are gold and silver mountains’ put forward by General Secretary Xi has been widely recognised and plays an essential guiding role in coordinating China’s ecological environment and economy. The transformation of ‘clear waters and green mountains’ and ‘gold and silver mountains’ is a crucial practice guideline of China’s ‘14th Five-year Plan’ and even in the future.
In terms of energy consumption, electricity consumption promotes the economy of the three regions to a certain extent. A 1% increase in electricity consumption in eastern, central, and western China will boost economic growth by 0.602%, 0.141%, and 0.431%, respectively. According to the model, coal consumption hurts the national economy of the three regions, especially in the eastern and central areas. Every 1% of coal consumption will decrease the economy by 0.184 and 0.233 percentage points. It can be seen that the electric power industry has a significant impact on the economy. First, all industries in production and life need electric power. Second, electric power is more green and low-carbon compared with other energy sources. According to the power structure statistics of China in 2019 (China Energy Statistical Yearbook, Citation2015–2020), coal, hydropower, and renewable energy occupy the top three, accounting for 64.7%, 16.9%, and 9.8%, respectively. The high proportion of coal power increases the pressure of coal mining, consumption, and transportation and increases pollution. Therefore, it is necessary to pay attention to the intensity of consumption and exploitation. At the same time, according to the statistics of the world’s total end energy consumption in 2019 (China Energy Statistical Yearbook, Citation2015–2020), China ranked first (20.53%) in consumption among OECD and non-OECD countries, surpassing the United States (15.65%). Therefore, the green transformation of the energy system under the vision of carbon neutrality requires a significant increase in the proportion of non-fossil energy consumption and changes the energy consumption model of the terminal sector(Weibin and Jiayi Citation2021).
From the perspective of urban housing prices, its impact on the three regions is not apparent. Still, the regression coefficients are negative, indicating that urban housing price has a particularly adverse effect on the national economy in a short period. According to the report, housing prices in many cities such as Chengdu, Chongqing, and Hefei continued to rise from 2016 to 2017. The contribution of investment in housing development to the national economy was negative in 2018 and 2019, at 0.91% and −0.70%, respectively (China Housing Development Report, Citation2019–2020). Compared with China’s central and western parts, the housing price in the eastern part of China is leading, and the housing price in the northern and southern regions is also different. In 2020, China’s economy will experience a recovery process, and various industries will recover actively. According to the latest housing development report (China Housing Development Report, Citation2020–2021), spatial differentiation between cities will gradually decrease. The housing price and economy, which are opposite in the short term, will return to normal and move in the same direction. Therefore, to achieve sustainable economic growth, all regions of China should do an excellent job of controlling housing prices.
4.4. Model accuracy test results
Select the index variable values of some provinces and cities in the three regions in 2019, substitute them into formulas (4) – (6), and calculate the GDP model fitting values of each province and city, respectively. Secondly, the predicted and actual values are substituted into formula (3) to obtain the relative error of each area, and then the average relative error is accepted, as shown in . As can be seen from the table, the maximum relative error of each region and province is 1.7322%, less than 2%. In comparison, the average relative error of each area is about 1%, indicating a relatively small error and high precision of the model. Therefore, the data show that the model is reasonable.
Table 5. Model test results.
5. Discussion
Taking the main elements of urban space, such as transportation, environment, science and technology, energy consumption, and house price, as the starting point, this study analyzes the impact of each element on the national economy. In addition to the theoretical significance of based on the new perspective of combining traditional data with big network data and supplementing experimental research evidence, the results of this study also have specific policy implications as follows:
(1) With the advantage of transportation, science, and technology, China’s eastern and central regions should vigorously develop new industries and highlight the further benefits of regional cities in the international market. At the same time, the central and east areas should give full play to the role of external and internal radiation, actively industrial layout transfer, and enhance the horizontal connection between the regions.
(2) The central region should promote the optimisation and upgrading of industrial structure, maintain the balanced development of ecological environment and economy, and green production and consumption following the development concept of green water and green mountains.
(3) Increase investment in science and technology and education in the western region, introduce high-tech talents, and promote the vitality of regional innovation. At the same time, to speed up the construction of the east-west transportation trunk line, the western region should actively undertake the transfer of industries, promote local employment, reduce the loss of labour force, improve the city activity in the area of the west.
(4) Rationally plan the power supply structure, reduce the use of coal power, and increase the proportion of wind power, nuclear power, and renewable energy. To develop and apply high and new technologies, guide the industry to develop into a low-energy structure, improve the way of using energy in terminal sectors, and enhance the quality of economic development.
This study has made some supplements for the lack of relevant research on national economic development and provided the theoretical reference for the rational division of labour, industrial layout, and scientific and technological investment of China’s urban economy. Still, some deficiencies in this study need to be further improved. First of all, due to data availability, this study measures urban development based on five main spatial elements. However, there are still some defects in its measurement. Later research can expand this based on data richness and improve measurement indicators of regional urban development levels. Secondly, China is a vast country with different physical and geographical conditions. However, the industrial structure of each region has not been included in the analysis of this paper, and no suitable data source has been found, so further paper mining is required in the later research. Finally, although this study analyzes the influence of urban spatial factors on the development of the national economy, it is not enough. Further research is needed to explore its theoretical mechanism and specific mechanism effect.
6. Conclusion
Based on panel data and big network data of 30 provinces and autonomous regions across China, this paper uses the panel regression model in econometric research to study and analyse the factors influencing the national economy of three areas in China from 2014 to 2019. The following conclusions are drawn:
(1) Each indicator variable’s final average relative error is controlled at about 1% through unit root test, model judgement, and model accuracy test, with minor error and reasonable model construction.
(2) On the whole, China’s national economic development is closely related to spatial development factors such as urban transportation, environment, science and technology, energy consumption, and urban housing price, indicating that these factors contribute to the growth of the national economy in varying degrees.
(3) From a local perspective, traffic has a significant positive impact on the national economy in China’s eastern and central regions and accounts for a relatively large proportion. The central and east areas can use their advantages to lead in and out. Environmental pollution hurts the national economy of the central region. Every 1% increase in PM2.5 concentration will worsen the economy by 0.370%; that is, the central area should develop its economy based on practicing ‘green water and green mountains’. Science and technology have a noticeable promoting effect on the three regions in China. Every 1% increase of science and technology input in the east, central and western regions will drive the economic growth of 0.225%, 0.159%, and 0.119%, respectively. In other words, the investment in science and technology education should be significantly increased, especially in the western region, to narrow the gap between the east and central areas. Energy consumption plays a vital role in promoting the development of new energy in the three areas of China. The urban housing price shows a negative impact quickly, so the government should reasonably regulate the real estate market.
7. Future developments
This study provides a reference for the rational planning of China’s national economic development and provides an additional reference for relevant scholars. Given the shortcomings of this paper, it is necessary to excavate the literature further, enrich the data and carry out more in-depth discussions in the subsequent research. Secondly, this study will continue to pay attention to the related issues of national economic development and expand or narrow the research object, such as industrial structure and ecological environmental quality, to explore its impact on the national economy and urban economic efficiency.
Acknowledgments
The authors would like to thank the editor and the anonymous reviewers.
Disclosure statement
No potential conflict of interest was reported by the author(s).
Additional information
Funding
Notes on contributors
Yulin Zhao
Yulin Zhao received her B.S. degree in computer science and technology from Xi’an University of Finance and Economics, Xi’an, China, 2016. She is currently pursuing an M.S. degree in modern education technology at Qiannan Normal University for Nationalities in Guizhou Province, China. His research interests include the application of big network data, Regional economic development. Please refer to https://doi.org/10.3390/fi13050120 for more information about her publications.
Junke Li
Junke Li received the B.S. degree in engineering from Henan Polytechnic University. In 2013, he received the M.S. degree in Computer Application Technology from Southwest University. In 2017, he received his ph. D. degree in Computer Application technology from Sichuan University. He is now the Professor of Computer and Information College of Qiannan Normal University for Nationalities. his research interests include big data applications, embedded systems and high performance computing.
Kai Liu
Kai Liu is a lecturer at the School of Education Science, Qiannan Normal University for Nationalities. Her main research interests include applying big data in related fields, Regional economic development, and intelligent analysis.
Jiang’e Wang
Jiang’e Wang received her B.S. degree in information management and information system from Qiannan Normal University for Nationalities in Guizhou Province, China. She is currently pursuing an M.S. degree in modern education technology at Qiannan Normal University for Nationalities, Guizhou, China. Her current research interests include developing programming and the network’s extensive data application.
References
- Air Quality in China 0000. https://www.aqistudy.cn/historydata
- Alexis Sagastume, G., M. Fandiño Jorge M, and C. Eras Juan J. 2021. “Alternatives of Municipal Solid Wastes to Energy for Sustainable Development. The Case of Barranquilla (Colombia)[j].” International Journal of Sustainable Engineering 14 (6): 1809–1825. doi:10.1080/19397038.2021.1993378.
- Baidu Index 0000. http://index.baidu.com
- Chang, Q., L. Hongwei, Z. Bin, H. Mengzheng, and L. Yang. 2021. “Study on Temporal and Spatial Characteristics and Socio-economic Factors Influencing Air Quality in Major Cities along the Yellow River [J].”Ecological Economy 367 (7) 183–189 v.37;No
- Changzheng, Z., and Z. Liang. 2018. “Urban Comparison of the Impact of Logistics Industry Agglomeration on the Regional Economy [J].” Business Economic Research 757 (18): 99–101.
- China Energy Statistical Yearbook 2015-2020 https://data.cnki.net/trade/Yearbook/Single/N2021050066?z=Z024
- China Housing Development Report (2019-2020) http://www.cssn.cn/jjx_yyjjx/yyjjx_gzf/201912/t20191217_5060652.html
- China Housing Development Report (2020-2021) http://www.cssn.cn/zx/bwyc/202012/t20201222_5235452.shtml
- China statistical yearbook 2015-2020, 0000. http://www.stats.gov.cn/tjsj/ndsj/
- Feihong, S. 2020. “Research on the Impact of Knowledge Production Sector on the National Economy – Based on Input-output Analysis [J].” Macroeconomic Research 265 (12): 109–120. doi:10.16304/j.cnki.11-3952/f.2020.12.011.
- František, D., and G. Florian. 2021. “Technological Development and Its Effect on IT Operations Cost and Environmental Impact[J].” International Journal of Sustainable Engineering 14 (3): 190–201. doi:10.1080/19397038.2020.1862342.
- Gang, J., and W. Liguo. 2019. “Research on the Impact of Real Estate Investment on China’s Economic Growth – Based on the Panel Data of 31 Provinces and Cities [J].”Investment Research 38 (4) 80–92 422
- Guanghua, X., H. Danni, H. Ying, and C. Hengyu. 2020. “Government Subsidies, Capital Investment, and Quality of Economic Growth [J].”Journal of Management Science 191 (5) 24–53 v.23;No
- Guo, L., Z. Tianfeng, and S. Qinghua. 2019. “Empirical Study on the Impact of China’s Sports Industry on National Economic Development [J].”Journal of Shenyang Institute of Physical Education 178 (2) 36–42 38
- Hao, W., C. Chunhui, M. Jun, L. Yi, and L. Zhen. 2020. “Estimation Method and Application of Urban Flood Emergency Material Demand Based on Baidu Big Data [J].” Journal of Safety and Environment 119 (5): 1829–1835. v.20;No 10.13637/j.1009-6094.2019.1182.
- Hou, N., S. Jinmei, and L. Zhanjiang. 2017. “Analysis on Key Influencing Factors of Economic Development in Inner Mongolia [J].” Inner Mongolia Statistics, no. 3: 10–15. doi:10.19454/j.cnki.cn15-1170/c.2017.03.007.
- Hua, T., L. Hui Min, and Z. Tao. 2011. “Research on Xi’an Real Estate Market and National Economy Based on Spectral Analysis[J].” Advanced Materials Research 368-373: 3083–3087.
- Jianglin, L., and L. I. Y. Chen Hui. 2014. “Regional Economic Development Level, House Price, and Economic Growth: A Study Based on Panel Threshold Model [J].” Jiangxi Social Sciences 34 (7): 64–68.
- Jianxun, D., and L. Yixiao. 2020. “Capital Allocation Embodied Technological Progress and High-quality, Sustainable Growth of China’s Economy [J].” Journal of Guizhou University of Finance and Economics 206 (3): 1–11.
- Jie, Z. 2020. Study on the relationship between spatial factors and population contraction in coal resource exhausted cities[D]. Harbin University of Technology. doi:10.27061/d.cnki.ghgdu.2020.003407
- Kewei, M. 2021. “VAT Reduction, Economic Output, and Income Distribution – Analysis Based on the Connection Model between Input-output and National Income Flow [J].” Journal of Shanxi University of Finance and Economics 344 (6): 29–39. v.43;No. 10.13781/j.cnki.1007-9556.2021.06.003.
- Long, X., and M. Gan. 2018. “Analysis on the Role of Big Data in the Monitoring of Collective Land Property Rights Transfer: A Case Study of Baidu’s Big Data Search [J].” Journal of Northeast Normal University (Philosophy and Social Sciences) 291 (1): 177–182. doi:10.16164/j.cnki.22-1062/c.2018.01.028.
- Tan, M. Tan, Y. Chen, Y. Su, B. Duan, et al. 2019. “Simulation Planning of Power Supply Capacity: An Approach to Optimal Industrial Microgrid Operation with Carbon Emission permits[J].” International Journal of Sustainable Engineering 12 (5): 303–311. DOI:10.1080/19397038.2018.1547331.
- Meitao, Z. 2019. “Research on the Spatial Effect of Knowledge Spillover on China’s Regional Economic Growth – Based on the Spatial Econometric Model [J].” Journal of Guizhou University of Finance and Economics 201 (4): 23–30.
- Meng, D., L. Feng, and C. Yuanyuan. 2021. “Empirical Study on the Impact of Residents’ Real Estate Tax Reform on the National Economy [J].” Exploration of Economic Problems 464 (3): 53–60.
- Min, S., and C. Yixin. 2019. “The Impact of Comprehensive Transportation Efficiency of Urban Agglomeration on Economic Growth – A Comparative Study Based on the Yangtze River Delta and the Great Bay Area of Guangdong, Hong Kong, and Macao [J].” Urban Issues 290 (9): 45–53. doi:10.13239/j.bjsshkxy.cswt.190906.
- Ming, H., and L. Xiuwen. 2021. “Research on the Correlation between Technological Innovation and Industrial Economic Development in Western China [J].” Commercial Economics Research 1 (23): 150–152.
- Mingdong, J., Z. Hao, and Q. Wang. 2022. “Research on the Impact of Ecological Environment Quality on Urban Economic Efficiency [J].” Urban Problems, no. 1: 15–22. doi:10.13239/j.bjsshkxy.cswt.220102.
- Minxue, G., L. Yukun, and L. Jingping. 2019. “Research on the Relationship between China’s Cargo Transportation and Economic Growth from the Perspective of Coupling and Decoupling[J]. Economic Theory and Economic Management 1 (05): 75–87.
- Qianying, W., L. Zhiqiang, and H. Chengsheng. 2016. “Bootstrap Hausman Test for Personal Effects in a Partially Linear Panel Data Model [J].” Journal of Beijing University of Chemical Technology (Natural Science) 43 (1): 122–127. doi:10.13543/j.bhxbzr.2016.01.020.
- Renfu, P., Q. Zuze, and Z. Zemin. 2019. “What Is the Social Concern of Vocational Education – Big Data Analysis Based on Baidu Index [J].”Vocational and Technical Education 937 (15) 39–44 v.40
- Santosh Singh, R., and A. Rajesh. 2020. “Design and Economic Analysis of a Stand-alone Hybrid Photovoltaic Energy System for Remote Healthcare centre[J].” International Journal of Sustainable Engineering 13 (5): 360–372. doi:10.1080/19397038.2019.1629674.
- Slobodan, C., P. Andrea Andrejević, and K. Aleksandar. 2021. “National Innovation Capacity and Economic Progress of Countries[J].” Economic Themes 59 (3): 297–314. doi:10.2478/ethemes-2021-0017.
- Suping, Z., and G. Ming. 2015. “Analysis on the Impact of China’s Agriculture on the National Economy and Its Macroeconomic Effects – Based on China’s Input-output Tables in 2005 and 2010 [J].” Jiangsu Agricultural Science 43 (6): 477–480. doi:10.15889/j.1002-1302.2015.06.151.
- Tao, G., and L. Rui. 2020. “Impact of Epidemic Impact on National Economic Operation: Mechanism, Evidence, and Strategy [J].” Shanghai Economic Research 384 (9): 67–77. doi:10.19626/j.cnki.cn31-1163/f.2020.09.006.
- Tianyu, H., and M. Jie. 2017. “Analysis of the Impact of the Big Data Industry on Xinjiang’s Economic Development Based on the Input-output Table [J].” Foreign Trade and Economic Cooperation 276 (6): 71–75+102.
- Weibin, L., and W. Jiayi. 2021. “Three Trends of China’s Energy Transition under the Carbon-neutral Vision [J/OL].” Price Theory & Practice 445 (7): 21–23+114. doi:10.19851/j.cnki.cn11-1010/f.2021.07.89.
- Xiangang, Z., and R. Fangfang. 2020. “China PM_ (2.5) National Economic Impact Analysis of Pollution Health Effects [J].” China Environmental Science 40 (7): 3228–3238. doi:10.19674/j.cnki.1000-6923.2020.0361.
- Xiaofan, L., and J. Lingduo. 2020. “The Construction of the “One Belt, One Road” Construction, the Midwest Opening Up, and Regional Economic Development [J].“ World Economy v.43 43(10): 3–27.
- Yihong, L. 2019. “Analysis of the Mechanism of ICT Such as Big Data Artificial Intelligence Blockchain to Promote the High-quality Development of the Digital Economy [J].” Guizhou Social Sciences 360 (12): 122–132. doi:10.13713/j.cnki.cssci.2019.12.018.
- Yong, L., L. Qin, Z. Xiuge, B. Yun, and T. Yan. 2021. “Effects of PM_(2.5) Pollution on Health Burden and Economic Loss in China [J].” Environmental Science 42 (4): 1688–1695. doi:10.13227/j.hjkx.202008313.
- Yuping, X., and J. Ruizhi. 2021. “Transportation Efficiency, Traffic Structure and Economic Development [J].” Enterprise Economics 40 (5): 142–150. doi:10.13529/j.cnki.enterprise.economy.2021.05.016.
- Zahid, H., Cuifen, M., Zhihao, Z., Yingxuan, W., et al. 2022. “Nexus between Economic Efficiency, Healthcare, and Environmental Expenditures: A Perspective of BRI Countries [J].” Frontiers in Public Health 10: 842070–842070.
- Zhang, L. 2015. “Scientific and Technological Progress, Human Capital and Rural Poverty Alleviation in Western China – An Empirical Study Based on Provincial Panel Data [J].”Science of Science and Technology Management 402 (3) 172–180 v.36