
 ?Mathematical formulae have been encoded as MathML and are displayed in this HTML version using MathJax in order to improve their display. Uncheck the box to turn MathJax off. This feature requires Javascript. Click on a formula to zoom.
ABSTRACT
Solid oxide fuel cells powered by renewable fuels will be a panacea for our current challenges to meet the global energy demand and mitigate climate changes stemming from the widespread use of carbon-rich fuels. Accordingly, this numerical investigation has examined the geometrical shape effects of reactant gas ducts, and the thickness of electrodes on solid oxide fuel cell performance. The model was also validated using the experimental result of a rectangular shape gas flow duct conducted at Dr. T. Nejat Veziroğlu Clean Energy Research Center of Niğde Ömer Halisdemir University in Türkiye. Thus, the finding of this work disclosed that the semicircular gas flow duct has outstanding performance following rectangular, trapezoidal and triangular geometrical shapes. The additional remarkable results of this work are that the shape of the reactant gas flow channel and the thickness of the cathode have more substantial effects on airflow than fuel flow under identical electrolyte thickness. The finding also revealed that a peak power density has been achieved when the thickness of an anode gets thicker up to a certain limit then it is sharply decreasing. On the contrary, the performance of the model is increasing as the thickness of the air electrode is increasing. 9 Solid oxide fuel cells powered by renewable fuels panacea for our current challenges to meet the global energy demand and mitigate climate changes stemming from the widespread use of carbon-rich fuels rectangular shape gas flow duct conducted at Dr. T. Nejat VeziroğluNiğdeHalisdemir peak power density has been achieved when the thickness of an anode gets thicker up to a certain limitis decreasingincreasing.
1. Introduction
According to different studies, more than 23% of global CO2 emissions are released from vehicles running on fossil fuels (Lan, Irvine, and Tao Citation2012). This is because energy is one of the pivotal preconditions to attaining sustainable economic development and enhancing the life quality of human beings. A few decades ago, speedy industrialisations, the growth of inhabitants, and swift urbanisations have huge pressure on carbon-rich fuels, which is finite. Consequently, fossil fuel consumption is rapidly snowballing which leads to rapid fossil fuel reserve depletion. Moreover, they are the prime source of greenhouse gases leading to a harmful impact on the surroundings. For these reasons, finding green and clean alternative energy, advancing their efficiency, and diminishing environmental obliteration is unquestionable responsibility for a researcher.
Today, the most decisive challenges we are fronting are clean energy making and battling climate change. In line with this, the operation of renewable energy is a holistic solution to climate change as it can be explored elsewhere(El Haj Assad, Alhuyi Nazari, and Rosen Citation2021). Renewable energy can be a panacea for environmental and energy needs for many reasons. This is because the use of carbon-rich fuels as a primary energy source is the major source of global warming. Hydrogen, produced mainly using clean energy sources, has abundant advantages in stationary, mobile, and transport uses, and has an irreplaceable role in the de-fossilisation of the transport sector. Hydrogen-driven SOFC is a revolutionary clean technology that makes a significant contribution to overwhelming problems related to current energy demands and the environment. This is due to using hydrogen-powered fuel cells to power electric vehicles are carbon-free emissions for the end user. This is the fact that the final emission of hydrogen fuel is only water.
Solid oxide fuel cells are one types of electrochemical device that transforms the fuel’s chemical energy into electricity without intermediate products by combining numerous fuels (gaseous or gasified, liquid) with an oxidant mainly air (Kakaç, Pramuanjaroenkij, and Zhou Citation2007; Wojcik et al. Citation2003). They are the most efficient electrochemical devices yet invented, and developed (Ke An Citation2003; Ricardo De la Torre García Citation2011; Singhal Citation2002; Su et al. Citation2016) that worked at higher temperatures mainly from 500 to 1000οC(Atkinson et al. Citation2004; Etemadi et al. Citation2016; Mench Citation2008; Walther and Ahn Citation2011). It is evident that both the average cell power density and the polarisation curve increase with increasing temperature, thereby enhancing the performance of the SOFC. This is because the conductivity of the electrolyte is increasing, while the ohmic resistance drops significantly at high temperatures. However, considering the challenges faced by PEN materials, such as current leakage through the electrolyte, thermal shock (thermal instability), and side reactions of the material at higher temperatures (chemical instability), 800°C was used in this study. Besides, they are also distinguished as ceramic oxide electrolytes with better fuel adaptability, and essay scalability(Jiang et al. Citation2006; Su et al. Citation2015). It also provides high-quality waste heat that can be recovered via cogeneration(S.C Singhal Citation2000) with zero or minimal pollutants even using carbon-rich fuels. SOFCs are quiet solid-state devices that have vibration-free with minimal NOx and SOx emissions compared with traditional energy conversion technologies(Singhal Citation2002). For these reasons, they have obtained the critical attention of various scholars and governments.
Further, because of having high operating temperatures, some hydrocarbon fuels like natural gas can be reformed within the cell stack. As a result, they are eliminating the need for expensive external reformers (An Citation2003; Ricardo De la Torre García Citation2011; Singhal Citation2002; Singhal and Kendall Citation2003). Besides, SOFCs can be integrated with conventional heat engines like gas turbines to reuse the waste heat from exhausted gases (An Citation2003; Xiurong Fang, L, and Cell Citation2018). According to Singhal (S.C Singhal Citation2000) and Chan et al., (Chan et al., Citation2001), the efficiencies of hybrid SOFC-gas or steam turbine power systems are estimated to be 70%. However, recent studies indicate that the efficiency of SOFCs combined with gas turbines is above 90%, with zero GHGs (Choudhury, Chandra, and Arora Citation2013; Siddiqui and Dincer Citation2018; Singhal Citation2002; Su et al., Citation2016). This is because the exhaust is only water when fuel cells run with hydrogen or carbon-free fuel.
Nowadays, different design of SOFC is available in the open literature (Fang, Zhu, and Lin Citation2018; Ilbas et al., Citation2020; Minh Citation2004; Molla and Ilbas Citation2020; Yu et al., Citation2016). Yet, the planar design obtained remarkable attention because of having supreme power. Connected with this, plenty of numerical and experimental studies are available on planar SOFC (P-SOFC) feed with different fuels. Dang et al., performed numerical studies on electrochemical reactions, gas flow, mass, and heat transfer in SOFCs. The study also considered the effect of the porosity, the rib width, and the inlet flow rate of the cathode on the SOFC performance. Their findings suggest that the inlet flow rate of the cathode plays an important role in increasing the current density of the fuel cell. It was also found that the rib width should be reduced as much as possible to optimise the operating performance of the cell. Fu et al., (Fu et al., Citation2021) studied a novel interconnector design (groove and rib-finned) to enhance the performance of solid oxide fuel cells supported by an anode electrode. The findings demonstrate that the interconnector plays an important role in reducing the concentration and activation loss, resulting in improved electrical performance of the stack compared to conventional interconnectors. Likewise, the grooved and finned interconnects increased velocity and vortices by 2.4 and 6 times that of straight channel interconnects.
Jha, Surasani, and Krishnamurthy (Jha, Surasani, and Krishnamurthy Citation2021) have developed a 3D mathematical model of SOFC to study the influence of different geometrical parameters under various flow conditions. The simulation results show that the performance of the SOFC is improved at higher cathode-to-anode thicknesses. The study also revealed that when the rib width is increased, the performance of the cell and the current decreases due to the increased contact resistance. Lee et al., (Lee et al., Citation2022) investigated the effect of different flow modes (co-, counter-, and cross-flow) on the operating temperature distribution and performance of solid oxide fuel cells. Their findings show that the temperature distribution is evenly distributed in the counter-flow configuration, so maximum power is obtained in this flow mode. The influence of airflow and its flowing direction on the thermal stress of SOFC has been studied (Yuan and Liu Citation2022). The results show that increasing the inlet flow rate of air and changing the direction of airflow drops the thermal stress of a SOFC without affecting the power generation of the cell. It is known that the current density is strongly a temperature-dependent function. This is because the electrochemical reaction is faster at higher operating temperatures. The convective and diffusive heat, mass, and species transport are also a function of duct geometrical shape because they influence the flow regime. Yet, the effects of fuel and airflow duct shape are not studied. And also, the effects of PEN have been studied yet are not sufficient. Thus, the influence of semicircular, triangular, trapezoidal, and rectangular geometrical shapes of reactant gas flow conduits has been investigated on the performance of the model. The numeral simulation has been performed at the constant area of the gas flow duct and active PEN. As well, the performance of the cell has been examined using different thicknesses of electrodes at the same electrolyte thickness. Yet, initially, the model has been simulated and analysed under a similar thickness of PEN then after their thicknesses have been changed alternatively. Thus, the central goal of this study is to investigate the influence of the different geometrical orientations of reactant gas flow ducts and electrode thickness on H2- P-SOFC performance. As the knowledge of the author, this model is novel and will be used as a cornerstone for understanding the influence of duct shapes on cell performances.
2. Numerical investigation of solid oxide fuel cell
Mathematical simulations are the basis for studying the performance of SOFCs for clean energy generation. This is because numerical simulation is a viable means to ensure the practicability of SOFC before experimental work. In addition, the experimental work requires a lot of cost and time. Not only that, it is difficult to analyse what is going on inside the cell using an experimental study. Thus, in this numerical study, the commercial finite element-based COMSOL Multiphysics software 5.5 has been used for 3D hydrogen feed SOFC model development and numerical simulation analysis. The rectangular geometrical dimensions have been adopted from https://www.comsol.com/model, including electrolyte, fuel and air electrodes, and their gas flow conduits, as shown in . Yet, the semicircular, triangular, and trapezoidal dimensions of gas flow channels are developed using a constant area of the gas flow channel and PEN thickness. For all geometrical structures, a co-flow of reactant gases has been used. This is because the co-flow temperature of the anode and cathode gas outlets is higher than the maximum temperature of the stack, which is not possible with other flows, so there are fewer parasitic losses in the gas fan, allowing for lower heat exchangers and internal stress. This maximises the cooling efficiency of the cathode and anode gases. show the cross-sectional view and geometry of the developed model coupled to the mesh, respectively. The basic operating and fitting parameters are also displayed in .
Figure 1. A cross-sectional view of the SOFC model with different reactant gas channel ducts.
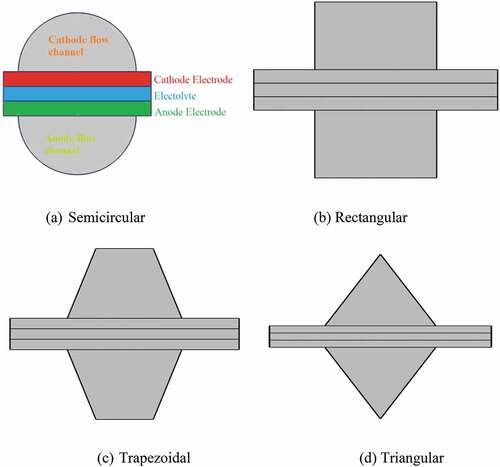
Figure 2. Schematic drawing of solid oxide fuel cell.
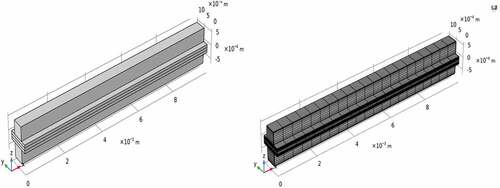
Table 1. Geometrical dimensions.
Table 2. Input variable and operating conditions.
2.1. Assumptions and boundary conditions used for model development
The main assumptions applied in this numerical study are that the temperature distribution is isothermal, the velocity and partial pressure of the fluid are average and uniform, and the viscosity of the fluid in each subsystem is the same. As well, during fuel and airflow via the systems, the density of the gas is constant, chemical reactions do not occur in both conduits and are operated at a steady state. Boundary conditions are also formulated to solve different coupled partial differential equations. Accordingly, some of the working circumstances were considered nonslip conditions, which means the velocity of the boundary and fluid are identical, the boundary layers for gas flow are negligible, and the partial derivative of the variable at the boundary is zero since it is considered as well insulated, the uniform potential at the electrode or gas channel interface, and the flux is zero at the end of electrodes and electrolyte.
2.2. Electrochemical modelling
An electrochemical reaction is an oxidation-reduction reaction of a fuel and oxidant mainly air taken apart in a fuel cell. It constituted a source term coupled with transport equations of charge transfer, energy, mass, and momentum. In this modelling, moist hydrogen and air are fed into the anode and cathode electrodes, respectively. Accordingly, the anticipated oxidation-reduction electrochemical reaction of hydrogen-fuelled SOFC using O−2 transfer is expressed as follows.
The electrochemical performance of a fuel cell is investigated as a function of polarisation and power density plots to identify the effect of the embedded current collector. The ideal voltage (1.2 V) is determined at standard conditions yet the fuel cell is always running above it. The voltage variation is more perceptible in cells that run at elevated temperatures. Alongside, the current is not flowing outside of the cell unless connected to an external load. As a result, the operating voltage is equal to the open-circuit voltage (VOC). Nernst voltage is the same as the equilibrium voltage at the air electrode estimated by the formulas(Cheddie Citation2013).
Here, P (H2), P (H2O) ,and P (O2) are the partial pressure of hydrogen, water vapour, and oxygen at the anode and cathode-electrolyte interface, respectively.
Further, the cell voltage (Vcell) is plummeting because of internal charge transfer, conduction, and diffusion losses. As a result, Vcell is always lower than Nernst voltage as shown in Equationequation (5)(5)
(5) . These losses are independently characterised as activation, concentration, and ohmic polarisation. They are prevailing factors that determine the Vcell and are collectively considered voltage losses (Vloss). Consequently, Vcell can be expressed as:
And
where, ηact,ηohm ,and ηcon are activation, ohmic and concentration loss at the anode and cathode.
Besides, for this numerical study, the Maxwell-Stefan diffusion and convection model is also applied for mass and species balance in gas channels and porous electrodes regarding the substantial difference between the molecular weight of species. This is because the transport of mass is primarily motivated by diffusion and convection. As well, the Brinkman equation is used for momentum balance through the porous media to solve the pressure and velocity field. Ohm’s law is also used to determine the transfer of charge between ionic and electronic conductors and conductive phases. Accordingly, the rudimentary governing equations for charge carriers, species, momentum, energy, and mass conservation are summarised in . The molecular diffusion of gases is also determined using Fuller’s correlation where M is the molecular weight in kg/mol, υ is the special Fuller’s diffusion volume as expressed below;
Table 3. Governing equation.
Likewise, during the electrochemical reaction, the rate of hydrogen and oxygen consumption and production of water as a byproduct of the reaction is given as follows.
3. Results and discussion
Today, the performance of fuel cells has been tried using different fuels (hydrocarbons, hydrogen, natural gas, biogas, methanol, ethanol, etc.). Among them, from the perspective of energy density and environmental benefits, hydrogen is the perfect fuel choice to solve the problem of global warming caused by the burning of fossil fuels. However, hydrogen storage and distribution systems require further research, which is beyond the scope of this work. Hence, in this numerical work, a 3D hydrogen-fuelled P-SOFC model has been developed and its performance has been evaluated using different shapes of reactant gas flow channels under similar operating conditions and active areas. In addition to this, a parametric sweep analysis has been studied to examine the effects of electrode thickness under similar electrolyte thickness. Many runs were conducted at cell voltage range from 0.95 V to 0.2 V in step down of 0.05 V through a parametric model to generate a complete polarisation curve as a function of voltage and current density. A parametric nonlinear stationary with a direct linear system solver (MUMPS) has been used to linearise the PDEs at a convergence relative tolerance of 0.001.
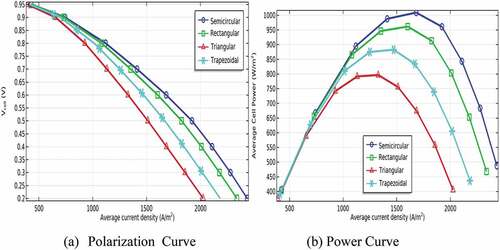
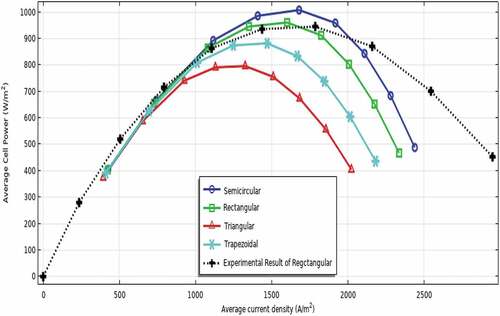
In this numerical modelling, the fuel cell ducts are changed from rectangular to semi-circular, triangular, and trapezoidal geometrical designs under similar working conditions and active areas. Among them, a semicircular gas flow duct outperforms succeeding rectangular, trapezoidal, and triangular as displayed in . As well, the shape of the duct has a greater effect on the cathode electrode. Therefore, the findings of this work suggest that the geometry of the reactant gas flow channel plays a positive role in the performance of the fuel cell. The polarisation curve determines the performance of the fuel cell, indicating the electrochemical efficiency at any operating current. The maximum voltage output is achieved at an open circuit when there is no current flow. As can be seen in the figure, the voltage output decreases when the current surges due to different potential losses. The graph also illustrates the maximum power densities of 1008.91, 961.32, 882.51, and 796.3 W/m2 at a cell voltage of 0.6 V when the shape of the reactant gas channels are modelled as semicircular, rectangular, trapezoidal, and triangular, respectively. This is due to the smooth and uniform input gas flow resulting from the more efficient fuel transport with low gas diffusion resistance, and the chemical reaction in the downstream semi-circular gas flow tube shape reducing the local current strength. In other words, as fuel transport increases and chemical reaction efficiency increases, more hydrogen is consumed, so fuel cell performance will improve. Furthermore, the most serious challenge is the inability to achieve hermetic seals between the compartments, allowing gas to escape and eventually damage the stacked cells, especially in other arrangements. Therefore, the use of a semicircle solves the key challenge of encapsulant requirements.
Figure 3. The performance of the developed model as a function of different gas flow duct shapes at a cell voltage of 0.6 V.
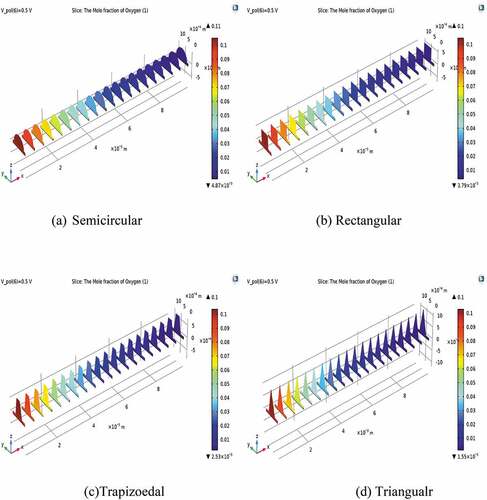
The spatial distribution of the oxygen mole fraction in the air electrode and its flow channel is shown in . The depletion of oxygen is slowly declining along with the main flow channel directions and reaches almost null close to the outlet from its initial value of 0.11. Significant depletion of oxygen was observed in all geometric conduits but was more pronounced in semicircular conduits. This is because the relative reduction of electrochemical reaction and diffusion of oxygen is slower than that of hydrogen fuel.
Figure 4. The distribution of oxygen mole fraction at different shapes of gas flow ducts with a cell voltage of 0.5 V.
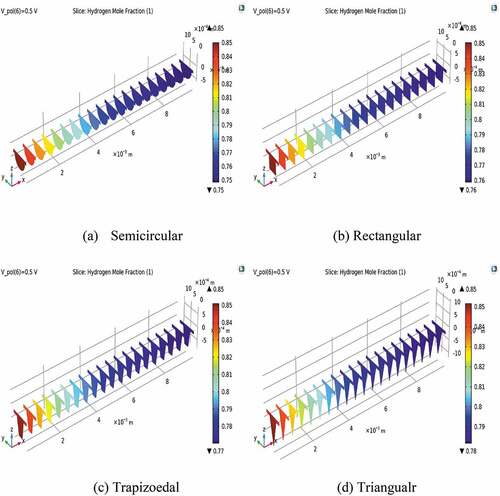
shows the distribution of hydrogen inside the fuel flow duct and at the anode electrode. As illustrated in the figure, the mole fraction of hydrogen cascades from 0.85, which is an initial value for all types of reactant flow ducts to about 0.75, 0.76, 0.77, and 0.78 at the outlet of semicircular, rectangular, trapezoidal, and triangular ducts, respectively. The amount of hydrogen at the fuel electrode has also declined along with the flow channel directions. Yet, the depletion of hydrogen is not noticeable like that happing at the air electrode.
Figure 5. The distribution of hydrogen mole fraction at the different shapes of gas flow ducts at a cell voltage of 0.5 V.
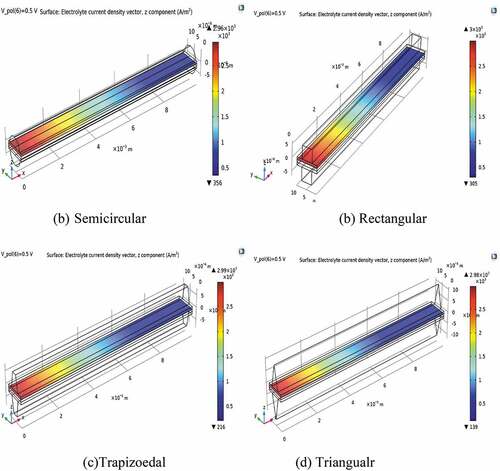
displays that the distribution of electrolyte current density at the side of the air electrode is non-uniform, underprivileged, and almost nil at the cathode outlet because of oxygen depletion. Relatively, the distribution of current is good in semicircular reactant gas flow channels that supply uniform gas distribution. Consequently, the primary solution to boost the performance of SOFC is increasing the flow rate of the cathode, which facilitates oxygen mass transfer.
Figure 6. Electrolyte current density at various shapes of gas flow ducts at a cell voltage of 0.5 V.
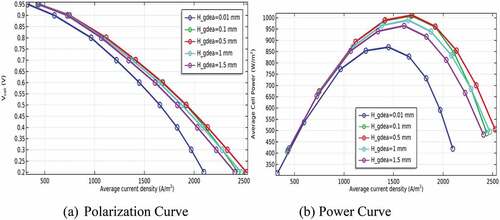
Besides, the performance of P-SOFC has been studied numerically as a function of electrode thickness. The simulation has been conducted using a semicircular duct that gives a maximum power density. Accordingly, the thickness of the anode has been simulated at values of 0.01, 0.1, 0.5, 1, and 1.5 mm under similar electrolyte thickness (0.1 mm). Then, the performance of the model has been evaluated when the cathode electrode thickness has been changed from 0.01 to 1.5 mm using the anode thickness that gives peak power density. The simulation result unveils that air electrode thickness has a more considerable effect on cell performance than that of the anode as can be seen clearly in . Connecting with this, a deprived performance has been observed at thinner cathode electrodes. The expected reason related to this is the relative diffusion of oxygen to the anode and its electrochemical reactivity is slower than hydrogen. Alongside, the chance of supplying a sufficient quantity of air declined to result in severe oxygen depletion. In contrast, the model performance is declining as the anode electrode is going to be thinker, especially above 0.5 mm because of having substantial fuel diffusion resistance as illustrated in . Yet, the finding also disclosed that the performance of the model is improved when the anode electrode gets thicker up to 0.5 mm. This is because the diffusion of gases is augmented when the thickness of the anode electrode increases up to a certain limit. Accordingly, the maximum power density is observed at a cathode thickness of 1.5 mm, and an anode thickness of 0.5 mm. This is because the diffusion potential loss decreases significantly as the anode thickness becomes thinner. As a result, the overall cell performance is improved.
Figure 7. The performance of the developed model as a function of air electrode thickness.
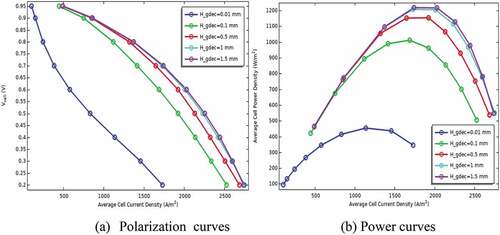
Figure 8. The performance of the developed model as a function of fuel electrode thickness.
Further, the model is validated using experimental results of the rectangular duct shape of P-SOFC that have been performed at the Dr. T. Nejat Veziroğlu Clean Energy Research Center of Niğde Ömer Halisdemir University, Türkiye. It is found that the experimental results are in good-looking agreement with the numerical simulation results of the study using a rectangular gas flow channel as can be understood from . Yet, the semicircular ducts have higher performance than the experimental results of rectangular shapes. The main reason for using rectangular duct shapes for model validation is the fact that semicircular duct shapes of P-SOFC are not available at the laboratory of Niğde Ömer Halisdemir University. Therefore, to minimise the validation errors, numerical and experimental work having similar gas flow ducts should be conducted simultaneously in the future, which plays an important role to have more acceptable and accurate results.
Figure 9. Model validation between the numerical simulation results and experimental data.
4. Conclusion
A three-dimensional P-SOFC model has been developed and simulated numerically to investigate the effect of flow channel shape and electrode thickness on cell performance. The developed model has also been validated using the rectangular gas flow duct shape of P-SOFC and found as a good agreement. Accordingly, the finding of the study disclosed that a maximum power density of 1008.91 W/m2 was recorded when the reactant gas channel is constructed in semicircular following rectangular (961.32 W/m2), trapezoidal (882.51 W/m2) and, triangular (796.3 W/m2) shape. In addition, the electrode thickness analysis confirmed that the air electrode has a more substantial influence on model performance than that the anode. The finding also disclosed that the performance of the model is improved when the anode electrode gets thicker up to 0.5 mm but it is sharply decreasing beyond 0.5 mm because of having substantial fuel diffusion resistance. Accordingly, the maximum power density is observed at a cathode thickness of 1.5 mm, and an anode thickness of 0.5 mm. On the contrary, a deprived performance has been observed at a thinner cathode electrode of 0.01 mm compared with an anode at a similar thickness due to higher oxygen depletion and the relative oxygen diffusion towards the anode and its electrochemical reactivity is slow compared with hydrogen.
Nomenclature
Table
Acknowledgments
This paper has been successfully completed with the support of Dr. T. Nejat Veziroğlu Clean Energy Research Center of Niğde Ömer Halisdemir University and the Energy Systems Engineering Department of Gazi University. Hence, I am eager to acknowledge them.
Disclosure statement
No potential conflict of interest was reported by the author(s).
Additional information
Notes on contributors
Molla Asmare
Molla Asmare has a B.Ed in Chemistry, MSc. In Sustainable Energy Engineering and Ph.D. In Energy Systems Engineering. Currently, he is an assistant professor of energy systems engineering in the department of Sustainable Energy Engineering at Bahir Dar University. He has several publications in renewable energy and environmental issues.
References
- An, K. 2003. Mechanical Properties and Electrochemical Durability of Solid Oxide Fuel Cells. USA (2003): Virginia Polytechnic Institute and State University.
- Atkinson, A., S. Barnett, R. J. Gorte, J. T. S. S. Irvine, A. J. Mcevoy, M. Mogensen, S. C. Singhal, and J. Vohs. 2004. “Advanced Anodes for high-temperature Fuel Cells.” Nature Materials 3: 17–27. doi:10.1038/nmat1040.
- Chan, S. H., K. A. Khor, and Z. T. Xia. 2001. “A Complete Polarization Model of A Solid Oxide Fuel Cell and Its Sensitivity to the Change of Cell Component Thickness.” Journal of Power Sources 93: 130–140. doi:10.1016/S0378-7753(00)00556-5.
- Cheddie, D. F. 2013. “Modeling of ammonia-fed Solid Oxide Fuel Cells.” Materials and Processes for Energy: Communicating Current Research and Technological Developments 504–511.
- Choudhury, A., H. Chandra, and A. Arora. 2013. “Application of Solid Oxide Fuel Cell Technology for Power Generation - A Review.” Renewable and Sustainable Energy Reviews 20: 430–442. doi:10.1016/j.rser.2012.11.031.
- El Haj Assad, M., M. Alhuyi Nazari, and M. A. Rosen. 2021. “Applications of Renewable Energy Sources.” Design and Performance Optimization of Renewable Energy Systems 1–15. doi:10.1016/B978-0-12-821602-6.00001-8.
- Etemadi, A., S. Ghorbani, M. Masoumpour, and M. Dadkhah. 2016. “The Numerical Analysis of an anode-supported high-temperature DIR- PSOFC Operating Conditions with considering the Maximum Allowable Temperature Difference.” Journal of Heat and Mass Transfer Research 1 (2): 15–25.
- Fang, X., J. Zhu, and Z. Lin. 2018. “Effects of Electrode Composition and Thickness on the Mechanical Performance of a Solid Oxide Fuel Cell.” Energies 11 (1735): 1–13. doi:10.3390/en11071735.
- Fu, Q., Z. Li, W. Wei, F. Liu, X. Xu, and Z. Liu. 2021. “Performance Enhancement of Planar Solid Oxide Fuel Cell Using a Novel Interconnector Design.” International Journal of Hydrogen Energy 46 (41): 21634–21656. doi:10.1016/j.ijhydene.2021.04.001.
- Ilbas, M., B. Kumuk, M. A. M. A. Alemu, and B. Arslan. 2020. “Numerical Investigation of a Direct Ammonia Tubular Solid Oxide Fuel Cell in Comparison with Hydrogen.” International Journal of Hydrogen Energy 45 (60): 35108–35117. doi:10.1016/j.ijhydene.2020.04.060.
- Jha, V., V. K. Surasani, and B. Krishnamurthy. 2021. “Three-dimensional Mathematical Model to Study Effects of Geometrical Parameters on the Performance of Solid Oxide Fuel Cell.” Journal of Electrochemical Science and Engineering 11 (4): 291–304. doi:10.5599/jese.1097.
- Jiang, W., R. Fang, J. A. Khan, and R. A. Dougal. 2006. “Parameter Setting and Analysis of a Dynamic Tubular SOFC Model.” Journal of Power Sources 162 (1): 316–326. doi:10.1016/j.jpowsour.2006.06.086.
- Kakaç, S., A. Pramuanjaroenkij, and X. Y. Zhou. 2007. “A Review of Numerical Modeling of Solid Oxide Fuel Cells.” International Journal of Hydrogen Energy 32, 761–786. doi:10.1016/j.ijhydene.2006.11.028.
- Lan, R., J. T. S. Irvine, and S. Tao. 2012. “Ammonia and Related Chemicals as Potential Indirect Hydrogen Storage Materials.” International Journal of Hydrogen Energy 37 (2): 1482–1494. doi:10.1016/j.ijhydene.2011.10.004.
- Lee, H. L., N. G. Han, M. S. Kim, Y. S. Kim, and D. K. Kim. 2022. “Studies on the Effect of Flow Configuration on the Temperature Distribution and Performance in a High Current Density Region of Solid Oxide Fuel Cell.” Applied Thermal Engineering 206 (December 2021): 118120. doi:10.1016/j.applthermaleng.2022.118120.
- Mench, M. M. 2008. “Fuel Cell Engines.” Fuel Cell Engines. doi:10.1002/9780470209769.
- Minh, N. Q. 2004. “Solid Oxide Fuel Cell Technology - Features and Applications.” Solid State Ionics 174 (1–4): 271–277. doi:10.1016/j.ssi.2004.07.042.
- Molla, A., and M. Ilbas. 2020. “Direct Ammonia Fueled Solid Oxide Fuel Cells: A Comprehensive Review on Challenges, Opportunities, and Future Outlooks.” International Journal of Energy Technology 2 (June): 70–91. doi:10.32438/IJET.203011.
- Ricardo De la Torre García, U. O. T. I. 2011. “Production of Micro-Tubular Solid Oxide Fuel Cells.” University of Trento, Italy, April.
- S.C Singhal. 2000. “Advances in Solid Oxide Fuel Cell Technology.” Solid State Ionics. 135 (1–4): 305–313. www.elsevier.com/locate/ssi-10.1016/S0167-2738(00)00452-5
- Siddiqui, O., and I. Dincer. 2018. “A Review and Comparative Assessment of Direct Ammonia Fuel Cells.” Thermal Science and Engineering Progress 5 (August 2017): 568–578. doi:10.1016/j.tsep.2018.02.011.
- Singhal, S. C. 2002. “Solid Oxide Fuel Cells for Stationary, Mobile, and Military Applications.” Solid State Ionics 152– 153: 405–410. doi:10.1016/S0167-2738(02)00349-1.
- Singhal, S. C., and K. Kendall. 2003. “High-temperature Solid Oxide Fuel Cells: Fundamentals, Design, and Applications.” High-temperature Solid Oxide Fuel Cells: Fundamentals, Design, and Applications. doi:10.1016/B978-1-85617-387-2.X5016-8.
- Su, S., X. Gao, Q. Zhang, W. Kong, and D. Chen. 2015. “Anode-versus cathode-supported Solid Oxide Fuel Cell: Effect of Cell Design on the Stack Performance.” International Journal of Electrochemical Science.
- Su, S., Q. Zhang, X. Gao, V. Periasamy, and W. Kong. 2016. “Effects of Changes in Solid Oxide Fuel Cell Electrode Thickness on Ohmic and Concentration Polarizations.” International Journal of Hydrogen Energy 41 (36): 16181–16190. doi:10.1016/j.ijhydene.2016.04.221.
- Walther, D. C., and J. Ahn. 2011. “Advances and Challenges in the Development of power-generation Systems at Small Scales.” Progress in Energy and Combustion Science 37: 583–610. doi:10.1016/j.pecs.2010.12.002.
- Wojcik, A., H. Middleton, I. Damopoulos, J. Van Herle, and J. Van. 2003. “Ammonia as a Fuel in Solid Oxide Fuel Cells.” Journal of Power Sources 118: 342–348. doi:10.1016/S0378-7753(03)00083-1.
- Xiurong Fang, J. Z., Z. L, and F. Cell. 2018. Effects of Electrode Composition and Thickness on. doi:10.3390/en11071735.
- Yuan, P., and S. F. Liu. 2022. “Effect of Air Flow Rate Distribution and Flowing Direction on the Thermal Stress of a Solid Oxide Fuel Cell Stack with cross-flow Configuration.” International Journal of Hydrogen Energy 47 (10): 6799–6810. doi:10.1016/j.ijhydene.2021.12.014.
- Yu, Z., S. Liu, F. Zheng, and Y. Ding. 2016. “Effects of the Different Supporting Structures on Tubular Solid Oxide Fuel Cell Performance.” International Journal of Electrochemical Science 11 (12): 10210–10222. doi:10.20964/2016.12.53.