
 ?Mathematical formulae have been encoded as MathML and are displayed in this HTML version using MathJax in order to improve their display. Uncheck the box to turn MathJax off. This feature requires Javascript. Click on a formula to zoom.
ABSTRACT
The growing diversity and volume of e-waste products are emerging as significant and complex challenges from environmental, economic, and recycling perspectives. This surge not only hampers the effective management and conservation of precious resources and strategically important materials (SIMs) but also intensifies the problem. Addressing this pressing global issue necessitates a holistic and intelligent decision-making model capable of effortlessly handling the vast variety and volume of e-waste products. This paper introduces a novel multi-criteria decision support system (DSS) that combines AI visual recognition with a multi-fuzzy model to precisely determine the optimal End-of-Life (EoL) recovery route. Additionally, the functionality of the proposed DSS is showcased through a pilot implementation and case study examples, emphasising the advantages of a fully automated, reliable, and efficient EoL management for e-waste.
Introduction
The proliferation of manufactured digital and non-digital artefacts in the 21st century has led to significant over-extraction and depletion of natural resources. Simultaneously, the dismantling and decomposition of these products have become increasingly challenging due to their varied shapes, sizes, and complexities. To ensure the preservation of our planet for future generations, while also supporting economic growth and innovative production, a circular approach to material usage was introduced in the 1970s as an alternative to traditional linear concepts and has evolved since then (Andersen Citation2007).
Several countries and regional treaties, including the European Union Commission (European Commission Environment Citation2011), have advocated for the circular economy model as a critical method to preserve all materials, including rare and precious elements. Nevertheless, rules and regulations alone cannot address the challenges of e-waste recycling. Enabling technologies, such as robust decision-making tools and reliable automation, are essential (Saidani et al. Citation2020).
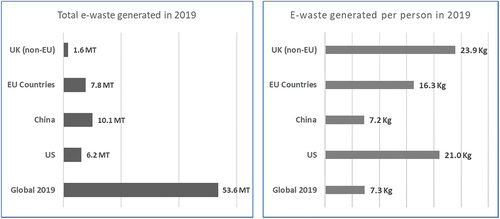
Derived from data in a report by the United Nations (Forti et al. Citation2020), reveals that over 53.6 million tonnes of e-waste were generated globally in 2019. Of this staggering amount, Europe alone produced 12 million tonnes, equating to an average of 16.2 kg per person. Intriguingly, while Europe is home to less than 10% of the world’s population, it accounts for 28% of the total e-waste. What’s even more alarming is that current data indicate that less than 35% of e-waste is collected and recycled in Europe (Eurostat Citation2021)
Figure 1. Total amount of e-wastes generated (left) and e-wastes generated per person (right) in 2019 within regions and global scale, derived from data published by UN report (Forti et al. Citation2020).
The primary barriers to achieving a closed-loop material flow are the absence of effective collection programmes and the requisite advanced technological infrastructure for precise separation and recycling (Parajuly et al. Citation2016). While the ramifications of the fourth industrial revolution and other digital transformation initiatives on resource management remain ambiguous, embedding sophisticated electronic systems in nearly every domestic and industrial product could inflate manufacturing costs and exacerbate the depletion of essential resources (Schwab Citation2015). The pressing issue now is how to efficiently recycle the multitude of electronic products that have reached, or will soon reach, their End of Life (EoL). Current recycling methods lack the capability and quality needed to consistently retain precious metals (Herrmann et al. Citation2012).
The idea of enhancing the concentration of Strategically Important Materials (SIMs) before large-scale fragmentation of e-waste has been presented and refined with the development of various tools and technologies (Jie, Barwood, and Rahimifard Citation2015). However, the stark reality of today’s e-waste management is that neither manual (traditional) nor robotic (modern) methods are individually sufficient to handle the vast volume and diverse nature of e-wastes. Using a real-world scenario for context, consider the manufacturing of Electric Vehicles (EV). One of the primary constraints is resource depletion, which is why EV production currently represents only a small percentage of total vehicle output. By ensuring efficient and automated SIM concentration and recovery across all e-waste types, we can address this break in resource management and avert material exhaustion. This, in turn, can pave the way for more sustainable EV manufacturing (Li, Barwood, and Rahimifard Citation2018).
In light of these challenges, this paper introduces an AI-driven decision support system, aiming to showcase the potential of improved recovery and recycling strategies for future urban mining from e-waste products. We commence with a review of pertinent literature and an exploration of the AI-based decision support system’s foundational concepts. Subsequent sections detail a pilot implementation of the proposed system, followed by a case study. Together, these sections converge on key insights and highlight avenues for future research.
Background
Recent studies have underscored the potential of innovative technologies and tools for End-of-Life (EoL) management of e-wastes. These encompass a range, from automation solutions, pre-planning, and redesigning products for improved environmental impact, to the use of robotics and AI for product disassembly and disintegration.
In the realm of recycling automation, the proposed solutions often depend upon the specific products analysed in case studies. For instance, Kim et al. (Citation2009) put forward a fully automated robotic cell featuring mobile robots and a multi-agent system. Meanwhile, the interplay between human-robot collaboration in disassembly tasks, covering areas such as ensuring a safe environment, establishing communication protocols, and sharing algorithms, has been the subject of exploration by several researchers (Bogue Citation2019; Kopacek Citation2005; Vongbunyong, Vongseela, and Sreerattana-Aporn Citation2017). In a semi-automated collaborative approach proposed by Ullah and Sarkar (Citation2020), RFID and barcode tags are employed to bolster the tracking and control of the disassembly process, thus minimising the chances of e-wastes (or other wastes) being lost amongst other disposables. However, the practicality and reliability of such approach, especially in semi or fully destructive de-manufacturing contexts, remain underexplored. The question of whether these tracking systems can endure throughout a product’s life also hangs in the balance. In a distinct study by Liu et al. (Citation2019), the dynamic between humans and robots within a disassembly cell was probed, utilising an array of Kinect cameras and computers to synchronously analyse and predict human and robot movements in real-time. Turning attention to robotic disassembly for SIM concentration in Electric Vehicles (EVs), pivotal work is commonly linked to Li et al. (Citation2018). They described the current vehicle recycling processes as basic, largely ineffective in identifying and extracting valuable materials due to informational voids and physical limitations. Their proposed methodology leverages detailed product design information to guide disassembly planning, thereby enhancing prospects for more automated operations.
Other studies have taken a different angle, presenting mathematical solutions for disassembly sequencing and planning (Bentaha, Battaiä, and Dolgui Citation2015; Tumkor and Senol Citation2007; Zhu and Roy Citation2015). Behdad et al (Citation2012, Citation2014). delved into mathematical modelling for disassembly sequencing in the early design stages. They used a stochastic programming model to determine sequence and disassembly time, taking into account potential damage to parts as a primary uncertainty factor. In a shift from these approaches, Yeh and Wei (Citation2013) proposed parallel disassembly over traditional sequential methods for managing End-of-Life waste products. Several researchers have explored disassembly sequencing, design for reuse, and design for disassembly, often assuming that disassembly simply mirrors the assembly process (de Almeida, Borsato, and Lie Ugaya Citation2017; Jin and Tian Citation2012; Radaschin et al. Citation2012; Yi et al. Citation2008; Zülch and Hrdina Citation2010; Zülch and Schwarz Citation2008). The non-destructive removal of screws, nuts, and bolts is another approach that’s been explored by some authors, though their focus has mainly been on specific models or case study products (Friedrich, Lechler, and Verl Citation2016; Vongbunyong, Pagnucco, and Kara Citation2016).
The fuzzy decision-making technique has largely been used to study the management of e-waste reverse logistics (before disassembly) or at the material recycling stage (after disassembly). This approach aims to lessen environmental impacts and bolster economic viability (Grimes and Maguire Citation2020; Kinoshita et al. Citation2020; Shumon, Ahmed, and Ahmed Citation2016). Zhang et al. (Citation2014) suggested a combination of parallel disassembly sequencing and fuzzy rough sets for non-destructively disassembling complex products. Likewise, fuzzy clustering has been employed to create cost models for disassembly (Ziqiang et al. Citation2015). In this approach, a mathematical model employs a fuzzy set to frame the issue, subsequently evaluating the implications of disassembly costs through case studies.
Regarding the application of AI in End-of-Life management, several academic publications have identified AI and visual recognition as pivotal tools in e-waste recycling operations (Mao et al. Citation2021; Vongbunyong, Kara, and Pagnucco Citation2013). This includes using a single contour in the sorting processes of e-waste recycling (Laszlo et al. Citation2019), where the recommended system employs a visual recognition system to separate PC motherboard components that have been manually taken apart. In another piece of research, the soar cognitive architecture was utilised to identify and extract screws from various laptops (Difilippo and Jouaneh Citation2019).
Despite the multitude of publications discussing robotic and automated processing of wastes, the industry has been slow to adopt these innovations. One major limitation stem from a general, yet flawed assumption within much of the research: that End-of-Life (EoL) products can be approached as if they were brand new. However, the reality is that disassembly of used products is far from being a mere reverse of the assembly process during manufacturing. Throughout their use phase, and even during collection and handling, most EoL products undergo a range of physical damages. They exhibit changes in their original characteristics, endure unpredictable wear and tear, and generally present conditions vastly different from those of new products. These variations complicate their processing and disassembly, demanding a more nuanced and adaptive approach than what many current methodologies offer. The true challenge lies in developing an innovative solution tailored to the unique challenges of used products.
Problem definition
The review of related publications underscores the pivotal role that enhanced automation, decision-making, and visual recognition systems play in optimising material recovery from e-waste. This research introduces an AI-based decision support system that uses visual recognition to strengthen material concentration before e-waste undergoes the fragmentation process, aiming to boost the quality of recovered materials.
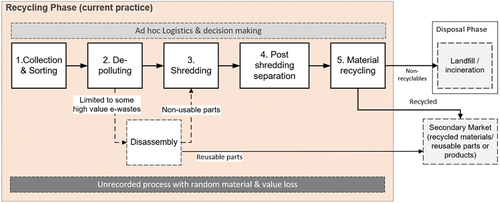
Present-day e-waste processing falls short, mainly due to a lack of a coherent strategy and a robust decision-making system. These systems are needed to identify the most suitable recovery options when products reach their EoL. As depicted in , current procedures for managing the end-of-life of e-wastes are largely non-automated, relying heavily on the judgement of low-skilled workers. The rapid proliferation of digital products renders this manual approach ineffective. The vast amounts of e-waste accumulating in treatment centres, paired with the digital industry’s challenges in accessing essential raw materials, spotlight an ineffective material recycling loop. This issue is further intensified by an over-reliance on shredding as a one-size-fits-all solution for all recycling problems (shown in ). Moreover, today’s e-waste assessment methods, predominantly manual and performed on the spot by less-skilled workers, are slow and fall short of 21st-century standards.
Figure 2. Current material flow from raw to parts and products back again to raw/energy.
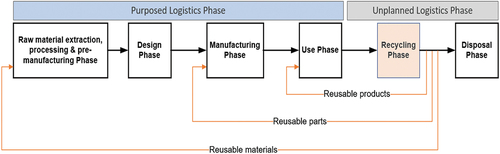
Figure 3. Material flow within recycling phase (magnified from ).
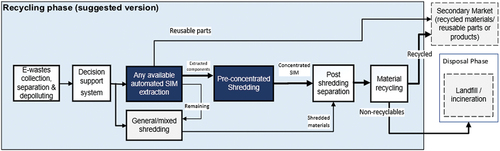
The proposed AI-based decision support system, detailed in , promises a structured methodology. It will utilise state-of-the-art automation to improve SIM concentration before fragmentation. This strategy ensures e-waste items are sorted by their material content and recovery value before processing. This study operates under the assumption that e-wastes have already been transported to treatment facilities, without prior sorting or labelling. It’s also based on the premise that a variety of EoL treatments are available at these facilities. Such an assumption provides the decision system with the flexibility needed to handle different e-waste types. It’s crucial to note that this system primarily aims to recover high-value e-waste. Remaining and lesser value products can still be processed via traditional recycling methods, including shredding.
Figure 4. Brief overview of proposed material flow in connection with other recycling entities (to replace the process shown in ).
AI-Based decision support system to enhance EoL management of e-wastes
Disassembly processes, unlike their assembly and manufacturing counterparts, confront the uncertainties and unpredictability of End-of-Life products. This encompasses challenges like varying product conditions, the unpredictable availability of valuable parts, and discerning the most efficient extraction methods. Decision-making in these uncertain environments requires a detailed evaluation of numerous scenarios, where each action could lead to a spectrum of outcomes, thereby assessing the risks (Nascimento Citation2019; Polat, Capraz, and Gungor Citation2018). In contrast, during manufacturing, every component and subassembly is systematically labelled, tagged, and maintained in peak condition. They are precisely timed and positioned into the production line, minimising uncertainty, and the risk of errors. This meticulous process means that surprises or unplanned events are rare in manufacturing. However, recycling, especially e-waste recycling, doesn’t have this luxury. Often, it’s nearly impossible to predict the type, condition, or the timing of items being sent for recycling, making the task of pre-planning for material recovery complex.
To address this challenge, we’ve crafted a flexible and automated decision support system. Named VEIDD (standing for Visual recognition of parts, Evaluation of estimated recovery value, Intactness analysis, Difficulty assessment in processing, and support for final recovery Decisions), this system harnesses AI to streamline and enhance the material recovery process. VEIDD aims to bolster the efficient retrieval of Strategically Important Materials (SIMs) from e-wastes, tapping into the prowess of advanced techniques, like robotic disassembly, all in alignment with circular economy principles.
The standout component of VEIDD is its AI-driven visual recognition system. This tool is specifically designed to pinpoint the exact type and model of e-waste products. After this identification step, the broader VEIDD framework takes over. It delves into a detailed evaluation of the product, scrutinises its current state of intactness, and estimates the complexity of extracting valuable components. This estimation considers elements like product design and how closely its parts are assembled.
provides a visual representation of VEIDD’s functionalities and how its sub-systems interplay. What sets VEIDD apart is its inherent flexibility and its adaptability across various recycling processes. It offers a fresh, more efficient approach compared to traditional, labour-heavy recycling methods. VEIDD encompasses four main interconnected sub-systems, all functioning within an overarching automatic platform. Once the product is recognised by the AI system, a user-established e-waste database, which is continuously updated via online bots, calculates the potential value embedded within the e-waste. This valuation is a crucial step, paving the way for determining the most economical recovery approach. The system further gauges the intactness of the product by weighing it, which helps detect missing components, and if the batteries are still connected. The next step assesses potential processing challenges, factoring in the product’s size and the intricacy of its design. Gathering insights from each of these evaluations, VEIDD then consolidates this data to inform the final decision on the optimal e-waste management strategy.
Figure 5. VEIDD overview: (top) visual decision support system environment; (bottom) detailed decision system highlighting visual recognition and its subsequent inputs leading to a final decision.
Following this overview, the subsequent subsections delve deeper into the intricacies of VEIDD’s individual sub-systems. Each segment offers detailed insights into their operational mechanics, functionalities, and roles within the broader framework providing comprehensive understanding of how these sub-systems synergise, ensuring VEIDD’s capabilities in e-waste management.
Multi-criteria and fuzzy system selection
The VEIDD system stands out largely due to its distinct approach to multi-criteria selection, designed to seamlessly integrate with a broad spectrum of e-waste. An underlying principle of this system’s design is its independence from any specific manufacturer’s data. This design principle is crucial, as in the real-world landscape of e-waste management, discarded products might have been on the market for an extended period, or they may originate from manufacturers who have since ceased operations or changed product specifications frequently.
In this study the fuzzy inference system with desirable predefined outputs has been initially built with empty framework and unknown rules and membership functions. Then key parameters from e-wastes characteristics for material extraction that could be extracted easily, have been identified to systematically sculpt the fuzzy inference system (reverse engineered). Extracted criteria: Evaluation, Intactness, Difficulty, and final Decisioning then integrated into the fuzzy inference system and configured to incorporate the primary VEIDD system.
Beginning with ‘evaluation’, it serves as a practical metric to ascertain the inherent recycling potential or value of a product at the time of supply. Instead of needing intricate manufacturer details or product blueprints, this criterion provides a direct gauge of how worthwhile a product is in the recycling context. The ‘intactness’ measure further simplifies the assessment by offering a clear, representation of the product’s current state, capturing any wear, damages, or missing components by simply measuring product weight. The true ingenuity, however, lies in the ‘difficulty’ assessment. Instead of delving into a myriad of complex variables, the system relies on three primary, easily determinable factors: the product’s outer shell material, its weight, and its overall dimensions. Three corresponding data, widely available for any product released to any market. Such an approach ensures that the product’s disassembly complexity is easily understood.
It’s essential to emphasise that the selection of these criteria is not arbitrary. Their universality and straightforward nature cater to the diverse challenges e-waste presents. Whether an operator is highly trained or relatively new, the criteria provide a structured yet simple framework to decide on the optimal recycling pathway. Subsequent sections will delve deeper into the intricacies of each criterion. However, it is imperative at this stage to underscore the significance of their strategic alignment in enhancing the comprehensiveness and functionality of the VEIDD system.
The VEIDD framework embraces the adaptability of fuzzy logic, particularly in its decision-making processes following visual recognition. In e-waste management, where a myriad of variable factors intersects, deterministic outcomes can be elusive. Fuzzy inference systems come to the forefront in such scenarios, interpreting human-rationalised rules over abstract mathematical representations. Given the intricate nature of e-waste end-of-life management, this approach offers significant advantages in navigating the less-defined mechanisms and circumstances.
A noteworthy advantage of the VEIDD framework, besides its current deterministic pathways for material extraction, is its future-proofing potential. The system is inherently designed to be adaptable, making it capable of accommodating emerging technologies, innovative methods, and evolving strategies in e-waste management as they arise. This ensures that VEIDD remains relevant and efficient in addressing both current and forthcoming challenges in the field.
E-waste products’ visual recognition
The AI-based visual recognition stands as a crucial component of the automated SIM concentration and recycling process. Without such rapid and reliable product recognition, navigating the rising volume and diversity of e-wastes would be an insurmountable challenge in automated recycling. Designed to demonstrate VEIDD’s capabilities in a lab environment, our visual recognition system (as depicted in ) incorporates three cameras and utilises a transferred learning version of the pre-trained AlexNet for product recognition, all housed on the MATLAB platform.
Figure 6. (a) Designed visual recognition system embedded with robot operation rig. (b) Actual image of developed visual recognition system while testing classification of a subject.
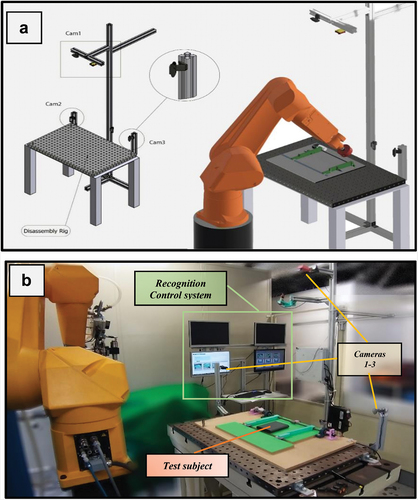
For the visual recognition setup, we utilised three distinct cameras, each feeding into the AlexNet on the MATLAB platform. The topmost Camera 1 captures a bird’s eye view, while the side views are provided by Cameras 2 & 3. Each camera’s output is channelled independently into the AlexNet, which has been trained to recognise and classify products based on varying perspectives. This configuration, leveraging multiple cameras input and classifications based on single network, adeptly handles the variations in how a product may be presented, accounting for all possible orientations. While our study employed AlexNet (Deep Learning Toolbox Model for AlexNet Network ver. 19.1.0) for visual recognition of a small product sample set, the system’s architecture isn’t confined to a specific machine learning algorithm or recognition approach.
Post-classification, the recognition results undergo a validation process against an e-waste designated database. This validation becomes paramount when transitioning to physical operations, like robotic disassembly. The efficacy of the decision-making process and subsequent actions hinges crucially on the accurate classification of the e-waste’s type and model. It’s worth noting that, while our setup was designed for laboratory demonstrations, the envisioned real-world application assumes this system would be integrated with a conveyor belt system, swiftly recognising products as they move along.
The classification output of our proposed system undergoes a validation process to ensure it remains within acceptable limits. The inherent nature of supervised AI classification involves comparing the input image with all trained images across predefined categories and subsequently providing a probability score. This score ranges from 0 to 1.0, where 1.0 indicates a perfect match and 0 suggests no similarity.
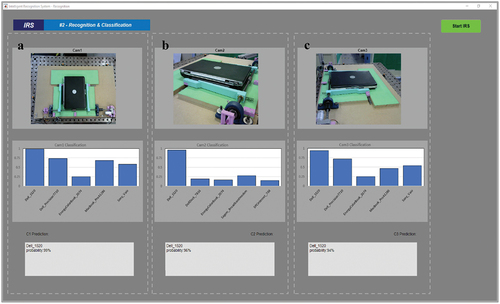
During validation, if the recognition probability from the top camera, termed as Prec (top) is 0.98 or higher, the system confidently categorises the product as recognised. Conversely, if Prec (top) is 0.95 or lower, the product is marked as ‘unknown’. This indicates that the network might require new or augmented images of the unclassified product, necessitating a retraining of the sub-system. In scenarios where Prec (top) is between 0.95 and 0.98, the result from the top camera is cross verified against the classifications from the side camera images. If the combined classification scores from all three cameras surpass 0.95, the product is categorised as recognised. However, if the combined score falls below 0.95, the item is set aside for additional imaging and potential network retraining. depicts this entire process, illustrating the initialisation, classification, and result matching stages, using an e-waste sample (for instance, a Dell 1520 laptop).
Figure 7. Visual recognition and validation for e-waste sample, dell-1520: (a) Top view, Cam1, 98% likelihood; (b) Side view, Cam2, 96% likelihood; (c) Another side view, 94% likelihood; average confirmed likelihood 96%.
offers a detailed depiction of the product recognition system integrated within our proposed automated material recovery framework. To simulate a real-world setting where end-of-life products arrive via a specifically designed, electronically controlled conveyor, three strategically positioned cameras in the lab were set up to mimic this conveyor system. These cameras capture instantaneous images from various angles, ensuring the desired accuracy is achieved, thereby laying the groundwork for creating a dataset integral to image recognition. This strategic arrangement enabled the capture of varied images of each of the 12 nominated e-waste products, which then served as foundational training material for refining the AI network’s recognition capabilities.
Figure 8. Workflow of the AI-Driven Product Recognition System in the automated material recovery framework.
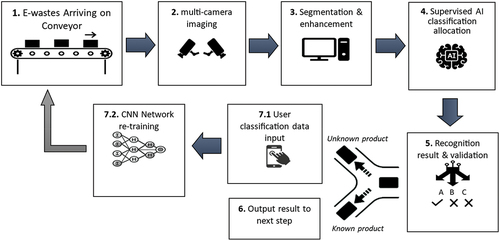
Following this setup, actions 3–5 detail the subsequent image preparation stages, encompassing segmentation, cropping, and enhancement, leading to AI-driven recognition and supervised classification. The AI recognition’s classification outcome operates on a probabilistic basis. If a result or the average of results surpasses a pre-set threshold, it’s accepted (as denoted in action 6 in ), designating such products as ‘identified products’. Conversely, if the classification output is uncertain or below the predetermined threshold, the system marks the product as a ‘new entry’. This delineation prompts the need for user (operator) input and further training for the recognition system, as illustrated in actions 7.1 and 7.2 of .
E-waste allocated database
For VEIDD to operate effectively as a decision support system for de-manufacturing high value and high-volume e-wastes, an extensive database is indispensable. Whilst the neural network behind VEIDD’s visual recognition requires snapshots from various angles of the initial products, it’s the e-waste database that serves as the primary reservoir of crucial data pertaining to the products.
This e-waste database, tailored for VEIDD, holds key information regarding the initial value and characteristics of products. Such details, even though not directly obtained from manufacturers, can be sourced from product datasheets available online or simply gathered through automated bots or manually entered by operators after a brief inspection. For instance, whilst the weight of a product can be automatically gauged and logged into the database, specific visual features such as external shell material or certain other data points might necessitate human intervention during system training.
Despite the current lack of a comprehensive, uniform database for e-waste similar to IDIS for end-of-life vehicles (IDIS Citation2021), we’ve designed a user-friendly database, built using MATLAB software, to suit VEIDD’s unique requirements. As shown in , this platform facilitates easy data entry and retrieval. The user can select a product category from a dropdown list with predefined options and enter specifics like the product model, original weight, manufacturing year, and relative price. In scenarios involving older products with inaccessible information and evaluation, estimated values can be provided. For instance, product valuations might be categorised as High value for items priced £500 and above, Medium value for those between £50–499, and Low value for items below £50. Product age is similarly categorised, and for dimensions, most e-wastes, being assumed to have a cuboidal form by general perception, have fields to input length, width, and height values.
Figure 9. Overview of developed front in MATLAB to obtain required data for classification and decision support system to be stored in database. (a) product categories (c) product initial price (c) age of product (d) near cuboidal size of the product (e) shell material (f) product nominal weight & battery weight.
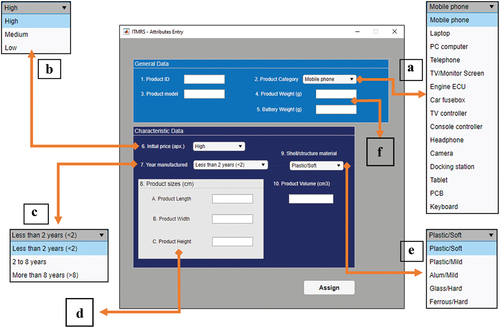
However, the adoption of legislative frameworks like the European Integrated Product Policy (IPP) directive (European Commission Environment Citation2011) has signalled a shift towards more responsible environmental practices. This directive mandates manufacturers to disclose specific product information before its market release. Such transparency is invaluable, particularly for e-waste management, as it provides the exact kind of data essential for populating our VEIDD database. This ensures a streamlined approach to recycling and underlines a shared dedication to sustainable e-waste practices within the industry.
Evaluation estimation
Evaluating a digital product for recycling, especially in the rapidly evolving world of electronics, is undeniably intricate. The sheer complexity arises not only from the vast array of components and materials hailing from global supply chains but also from the ever-changing nature of technological advancements. This dynamism means that even manufacturers themselves might be hard-pressed to provide a comprehensive inventory of every raw material embedded within their products. Given that some essential details are often withheld under the banner of ‘trade secrets’ or confidentiality, access to a complete material composition becomes a lofty aspiration for recyclers.
Against this backdrop of uncertainty, the VEIDD system’s approach – leveraging an indirect evaluation method rooted in a product’s initial price and its manufacturing year – emerges as a pragmatic solution. While this might seem like a simplistic pivot, it holds profound merit. Detailed information, often crucial for precise e-waste management, is scarce, making it essential to devise strategies that can draw reliable inferences from available data. (considering 2022 as the reference year) encapsulates this approach through the Generic Fuzzy evaluation method.
Figure 10. Fuzzy evaluation estimation of e-waste products based on their characteristic’s parameters.
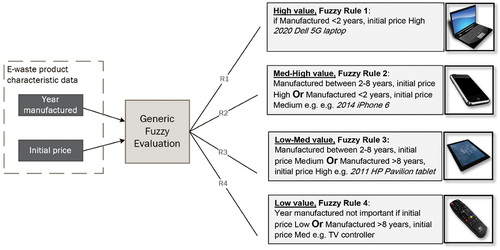
By assigning categories like ‘High value’ to products manufactured recently with a high initial price, we acknowledge the evolving consumer market. Such products, with their contemporary tech and components, often carry a significant potential for reuse, refurbishment, or remanufacturing. This also implicitly recognises that newer products tend to adopt eco-friendlier materials, in line with contemporary environmental standards, making them prime candidates for sustainable recycling. However, this method is not just about identifying the high value; it’s about casting a net over the vast sea of e-wastes. The categories, ‘Med-high value’, ‘Low-Med’, and ‘Low value’, serve to segment products, providing actionable insights even in the absence of exact material data.
This approach becomes all the more invaluable when we consider its adaptability. While designed in the present context, it harbours the flexibility to accommodate future developments in e-waste management, ensuring that the VEIDD system remains relevant and effective. Nonetheless, we must acknowledge the method’s natural limitations, such as the occasional need for user intervention and its lack of pinpoint accuracy in tracking specific material quantities. Yet, in a domain clouded with unknowns and rapid shifts, this estimation method stands out as a beacon, guiding efficient e-waste management.
Product intactness analysis
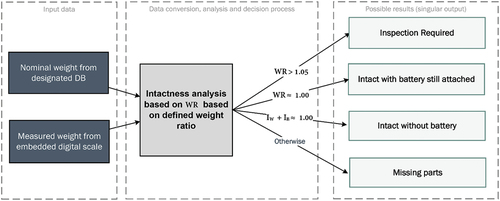
To ascertain product intactness, this study draws a comparison between a product’s measured weight and its original nominal weight, serving as an indicator of its potential recoverable quality at end-of-life. The nominal weight of each product can be sourced from its specification list, which is systematically archived in the VEIDD database. As the product moves through the SIM concentration process, its weight is easily determined. With advanced weight measurement technologies on the market, particularly those tailored for online retailers such as Amazon, this study omits the intricacies of creating a new weight measurement system, instead presuming the product’s weight is already documented in the database. Often, for safety considerations, batteries within e-waste products are extracted prior to processing. Hence, the ‘WR’ or weight ratio reflects the product’s intactness. This ratio is derived from the measured weight over the nominal weight, augmented by the battery weight if ascertainable, as detailed in the following equation:
Where:
Wm = Measured weight of e-waste product
Wn = Nominal weight of e-waste product (without battery)
Wb = Battery weight of e-waste product
delineates the potential values for WR, based on measured weight. When the intactness ratio (WR) sits within 1.0 ± 5%, it indicates a product ready for recovery procedures. A WR exceeding 1.05 signals the product’s weight surpasses its nominal weight, prompting an inspection for anomalies before further processing. Conversely, a WR falling below 0.95 hints at two potential scenarios: either the product remains intact but lacks its battery, or the WR’s diminished value, unaccounted for by battery weight removal, suggests the product has undetermined missing parts. This may compromise its suitability for streamlined SIM concentration or recovery. However, the conclusive course of action is steered by the Fuzzy DSS system, incorporating comprehensive data from all VEIDD subsystems.
Figure 11. Intactness analysis process of e-waste product based on embedded weight measurement mechanism.
Difficulty assessment of recovery process
The objective of this section is to employ a methodical quantitative approach to determine the difficulty of the material recovery process. In this evaluation, we lean on two primary parameters: Shell Material (SM), which identifies the type of material the e-waste product is crafted from, and Overall Density (OD), calculated by dividing the measured weight by the product’s computed cuboid volume. Essential data for these evaluations are already catalogued in the VEIDD database, ready for the ensuing decision-making process.
Building on the criteria defined by the SM and OD parameters, we have established four Fuzzy rules. These rules, elaborated in , classify the material recovery process into three distinct difficulty tiers: Normal, Hard, and Challenging. For instance, a recovery process is deemed ‘Normal’ if the OD lies between 1.0 and 0.5 and the product’s exterior is made of softer materials like Aluminium or plastics. In contrast, a ‘Hard’ label is applied when the OD exceeds 1.0, and the shell isn’t composed of tougher materials like glass or ferrous metals. This typically signals that the e-waste product possesses a certain level of compactness or intricacy. If the OD dips below 0.5 and the shell avoids the inclusion of sturdier materials, the recovery process is labelled ‘Challenging’, pointing to the product’s significant weight or size. Furthermore, products with shells primarily made of hard materials, such as glass or ferrous metals, are automatically categorised as ‘Challenging’ due to the challenges their dense or brittle shells introduce. provides a comprehensive visual representation of the inputs and potential outputs considered in this difficulty assessment for the recovery process.
Figure 12. Difficulty assessment of recovery process prior to SIM concentration operation.
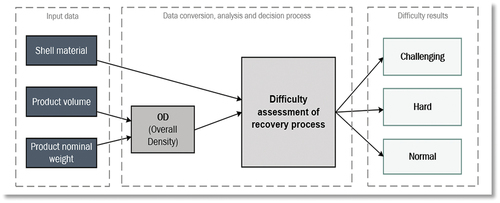
Table 1. Fuzzy rules for SIM concentration process difficulty assessment.
Fuzzy decisioning & chronological order of decision making
illustrates the integrated approach of the VEIDD system, where results from individual sub-systems – encompassing visual recognition, value estimation, product intactness, and process difficulty assessment – converge to support the identification of the optimal end-of-life (EoL) treatment for specific e-waste items. These results are assimilated within VEIDD’s culminating decision framework.
Figure 13. Chronological order of informed decision making for optimum end of life management of e-waste.
The figure further elucidates the layered and sequential architecture of the Fuzzy decision support mechanism. It underscores the interplay between data manually input by users and the output furnished by the VEIDD subsystems, ensuring a judicious EoL pathway determination for the e-waste in question. The initial level leans on direct measurements and observations, the succeeding stage extracts data from the database post the affirmation of visual recognition, while the third and fourth layers are rooted in multi-Fuzzy decision-making, converging to a single output in the fifth layer. This intricate framework was sculpted using the MATLAB software package (MATLAB ver. R2019b), complemented by the Fuzzy Logic Toolbox (ver. 2.5) to streamline the fuzzification and decision processes.
The design of a multi-layered Fuzzy system within VEIDD is not arbitrary but a deliberate attempt to ensure incremental refinement in decision-making as one progresses through each layer. At its core, the system embraces the philosophy of breaking down complex decisions into more digestible, manageable components. Each layer is tasked with a specific role, effectively handling distinct subsets of information. The layered approach also offers an additional advantage: the ability to meticulously fine-tune each level separately, ensuring precision and minimising potential errors. Moreover, by partitioning the decision-making process, the system can dynamically adapt to changes in one layer without destabilising the others.
Case study
After the successful development of the necessary hardware and software, 12 case study products were chosen to validate the practical viability of the proposed VEIDD system and its EoL decisions. Data for these products was sourced from manufacturers’ datasheets. Notably, for mobile phones and laptops, a range of product generations and specifications from recent years were included. Following the construction of decision system inputs and outputs, fuzzy rules were defined to characterise the system’s overarching behaviour. outlines eight dynamically constructed rules designed for the system to automatically adhere to. Crafting concise yet comprehensive rules is essential for the system’s expedient decision-making. These chosen rules encapsulate all potentialities in a deterministic decision framework. It’s worth noting that to maintain clarity, any outliers are addressed outside the Fuzzy system.
Table 2. Dynamically constructed fuzzy rules for intelligent recycling with four possible outputs.
Prior to testing the VEIDD, chosen Convolutional Neural Network (CNN) based on AlexNet model trained with a dataset composed of images from 12 distinct e-waste products. These products were meticulously photographed by our setup rig, equipped with three cameras, each capturing the products from different angles and under constant lighting conditions. This comprehensive dataset was pivotal for training the network to recognise and differentiate unique features specific to each product. The aim was to empower the CNN to identify each e-waste item with high accuracy during the testing phase of the VEIDD system.
Over the course of this study, seven training iterations were undertaken with tailored modifications to hone the network for optimal performance. The essence of these training iterations was to adjust the network’s weight, ensuring that given inputs corresponded accurately with expected outputs. While the retrained network could classify all training images accurately, its true test was its performance on new, previously unseen images, a critical step to validate the network’s learning capability. Out of the 194 images from 12 e-waste products stocked in the VEIDD dataset, a random 90% (177 images) were utilised for training, and the remaining 10% (17 images) were reserved for post-training validation.
presents the outcomes of the final chosen training iteration. This visualisation captures the progressive enhancement in accuracy as the training advanced. The various features of this deep learning training progress are showcased in the . It comprises the training accuracy trajectory, which concluded at 100%, and the training loss, which gradually minimised to an approximate zero. To validate the training’s effectiveness, a subset of randomly chosen e-waste product images from the testing set was used, and the results were consistently accurate, underscoring the network’s effectiveness. A confusion chart, integral for understanding classification performance, revealed no misclassifications as a evidence of reliability.
Figure 14. Detailed result of last stage CNN transfer learning.
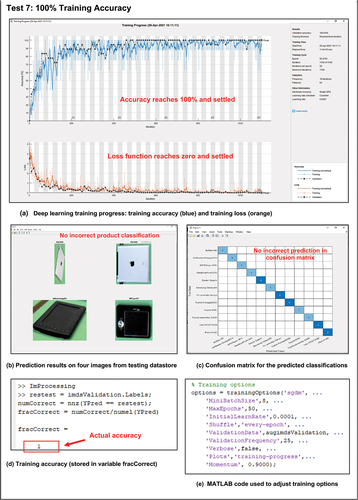
It’s important to highlight that deliberately overfitting the network serves a strategic purpose. The intentional overfitting is implemented to reinforce the VEIDD system’s capacity to handle e-wastes with the utmost precision and safety. By fine-tuning the network to an exceptionally high level of accuracy, we ensure that the system can make well-informed decisions during end-of-life management processes. This approach enhances the VEIDD system’s capability to perform tasks with a high degree of accuracy and confidence, particularly in the context of future robotic operations. The deliberate overfitting is a crucial feature that empowers the system to excel in its mission of efficient and precise e-waste handling.
When overfitting occurs, an e-waste product that has significant damage, altered appearances, or modifications may not initially be recognised as the same type of e-waste by the system. However, by capturing new images from various angles and retraining the network, it can then be identified as a subcategory of the original product, albeit with a different appearance. This approach offers adaptability, allowing the system to recognise even modified or damaged products. By enabling a more sensitive classification, it reduces potential errors and ensures comprehensive coverage through multi-angle imaging. Furthermore, the continuous learning nature of the method enhances its reliability over time, making it versatile for diverse e-waste types and promoting a generalisable system.
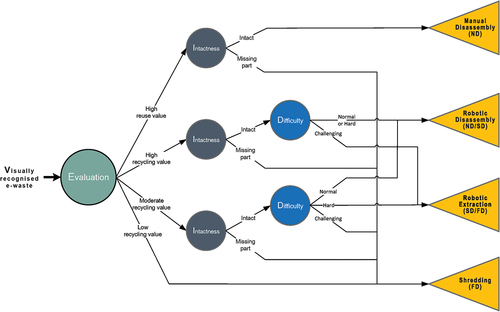
As delineated in , the defined fuzzy rules lead to a visually represented decision tree, mapping all potential decision routes. When solely accounting for the four possible system outputs, the resultant decision tree becomes notably intricate. The four hypothesised outputs (EoL operation paths) under evaluation include: manual disassembly (a standard solution for SIM concentration), robotic disassembly (details found in Li et al. (Citation2018) regarding semi-destructive robotic disassembly), robotic extraction (assumed akin to robotic disassembly but more aggressive and targeted), and whole shredding. Given varying automation levels, machinery availability, and precision needs, the current system boasts the flexibility to handle an expanded set of future output possibilities. Besides these four outputs, three decision system inputs have been previously discussed. Theoretically, the decision-making occurs in mere moments, and the sequencing or arrangement of input data bears no tangible impact on the system’s function or chosen output. Nevertheless, for consistency’s sake, the outlined VEIDD order remains unchanged.
Figure 15. Visualised constructed deterministic decision tree with all developed inputs and considering four outputs for the end-of-life operation path.
Regarding tangible development, in an ideal scenario, e-waste products would traverse a designated location on or at a conveyor belt’s end, equipped with cameras and weight-measuring sensors, thereby enabling real-time recognition. Post-recognition and weight assessment, the DSS will promptly dictate the best EoL pathway, guiding each product accordingly. In our study, spatial constraints necessitated a stationary setup for product recognition, weight measurement, and decision-making. It was still presupposed that all four EoL operations were available for system selection. The outcomes from the visual recognition system, with transferred learning and a compact sample size, were thoroughly validated without significant anomalies.
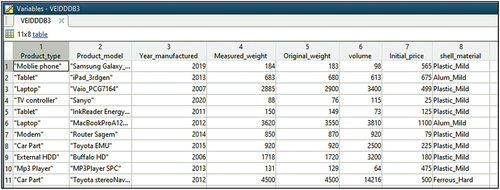
The 12 case study products, drawn from a diverse product range, serve to showcase potential subsystem inputs and outputs and the final fuzzy decision system. The refined deterministic decision support system illuminates the potential for monumental enhancements in e-waste recycling, favouring automation and efficiency over the current labour-intensive approaches in treatment centres. For the VEIDD system, a tailored database was crafted. This database’s documented information was integrated into MATLAB, providing accessible data for the VEIDD decision support system, as depicted in .
Figure 16. VEIDD database (stored information of 12 selected case study products) imported to MATLAB as a table to be accessed and used by VEIDD decision support system.
provides a clear visual representation of the step-by-step results generated by the VEIDD system for the iPad tablet. During Step 1, the system captures images from varied perspectives, initiating the classification process. The resulting classification underscored a 100% match, identifying the test sample as an Apple iPad.
Figure 17. VEIDD sequence diagram showing processes and obtained result for each sub-system testing on an EoL apple iPad tablet.
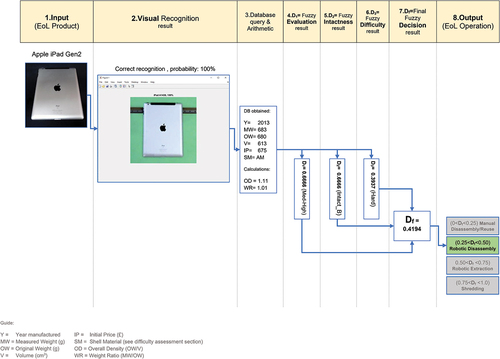
By Step 3, pertinent data related to the iPad was extracted from the VEIDD database, facilitating the computation of Overall Density (OD = 1.11) and Weight Ratio (WR = 1.01), both imperative for Fuzzy decision-making. Step 4 showcases the Fuzzy Evaluation outcome (D1 = 0.6666), derived from the iPad’s initial high cost and its manufacturing year, subsequently categorising the EoL product as having a ‘Medium-High’ value (D2 = 0.6666). Step 5 verified the Fuzzy Intactness result, identifying the product as ‘intact with battery’. Meanwhile, Step 6’s Fuzzy Difficulty assessment ascertained the processing difficulty as ‘Hard’ (D3 = 0.3937). The conclusions from Steps 4–6 were then incorporated as input parameters for the Final Fuzzy Decision system. This amalgamation of prior Fuzzy outputs (D1 – D3) fed into the final Fuzzy decision system, culminating in a result of Df = 0.4194. This recommends ‘Robotic Disassembly’ as the most fitting EoL operation (in alignment with the Fuzzy Rule of 0.25<Df <0.50 for robotic disassembly), aiming to bolster SIM concentration ahead of material recovery. This Apple iPad case study’s outcomes effectively aligned with the anticipated deliverables of the VEIDD system, reflecting its foundational parameters and incorporated Fuzzy rules.
Conclusion & future works
E-waste management stands as a pressing global issue, driven by concerns around environmental degradation, the continuous depletion of raw materials for electronics manufacturing, and the swelling volumes of discarded electronic products, compounded by rapid global digitalisation. The significance of advancing e-waste recycling methodologies has never been more critical. Recognising these challenges, the introduction of the VEIDD system represents an innovative leap forward.
Harnessing the power of AI, VEIDD seamlessly integrates visual recognition to identify e-waste products and collate tangible attributes such as weight. From here, the system intricately evaluates product-specific features, including intactness and the associated complexity of the recovery process. With a use of simply constructed database at its core, VEIDD’s agile framework facilitates informed decision-making, steering each e-waste item to its optimal end-of-life treatment.
Through 12 diverse e-waste case studies, the VEIDD system’s capabilities have been robustly tested. These case studies illuminated the system’s expansive adaptability and underscored the potential positive impacts of embedding intelligent decision-making within recycling processes.
In a broader industrial context, the VEIDD system holds promise to transform automated material recovery facilities, offering rapid product detection and broad-spectrum e-waste management. Its adaptability ensures that a myriad of high-volume and high variety of e-wastes can be efficiently addressed, pointing towards a sustainable future in e-waste recycling.
Anticipating future enhancements, we envision the incorporation of more advanced recognition techniques, like fluoroscopy imaging, to delve deeper into product internal assessment. Moreover, marrying the VEIDD system with possible future more targeted material extraction methods stands to offer exponential improvements in e-waste recovery rates. In summation, the journey of VEIDD highlights the intersections of AI, sustainability, and real-world applicability in addressing e-waste challenges. Future research avenues indicate, particularly around understanding the cost-benefit dynamics of each end-of-life operation, ensuring that e-waste management becomes a sustainable, efficient, and economically viable process for years to come.
Disclosure statement
No potential conflict of interest was reported by the author(s).
Data availability statement
The dataset and trained CNN network used in this AI-based study are available on GitHub at [https://github.com/Sams5879/VEIDD_system.git]. For further supporting data related to the decision support system, please contact the corresponding author, Ehsan Simaei, for access under confidentiality agreements to allow for commercialisation.
Additional information
Notes on contributors
Ehsan Simaei
Ehsan Simaei M. E, PhD, PGDip, Research Associate in Intelligent Automation and Robotics. Expertise: Robotics for Sustainable, Space Robotics, Lab Automation.
Shahin Rahimifard
Shahin Rahimifard BSc, MSc, PhD, CEng, FIMechE, FHEA Professor of Sustainable Engineering. Expertise: Sustainable Manufacturing, Sustainable Design, Automation in Remanufacturing/Reuse/Recycling, Business Models.
References
- Andersen, M. S. 2007. “An Introductory Note on the Environmental Economics of the Circular Economy.” Sustainability Science 2 (1): 133–140. https://doi.org/10.1007/s11625-006-0013-6.
- Behdad, S., L. P. Berg, D. Thurston, and J. Vance. 2012. Integrating Immersive Computing Technology with Mixed-Integer Nonlinear Programming for Disassembly Sequence Planning Under Uncertainty. International Design Engineering Technical Conferences & Computers and Information in Engineering Conference (IDETC/CIE), August 2012, Chicago, Illinois, 1–9. https://doi.org/10.1115/DETC2012-70392.
- Behdad, S., L. P. Berg, D. Thurston, and J. Vance. 2014. “Leveraging Virtual Reality Experiences with Mixed-Integer Nonlinear Programming Visualization of Disassembly Sequence Planning Under Uncertainty.” Journal of Mechanical Design 136 (4): 041005. https://doi.org/10.1115/1.4026463.
- Bentaha, M. L., O. Battaiä, and A. Dolgui. 2015. “An Exact Solution Approach for Disassembly Line Balancing Problem Under Uncertainty of the Task Processing Times.” International Journal of Production Research 53 (6): 1807–1818. https://doi.org/10.1080/00207543.2014.961212.
- Bogue, R. 2019. “Robots in Recycling and Disassembly.” Industrial Robot 46 (4): 461–466. https://doi.org/10.1108/IR-03-2019-0053.
- de Almeida, S. T., M. Borsato, and C. M. Lie Ugaya. 2017. “Application of Exergy-Based Approach for Implementing Design for Reuse: The Case of Microwave Oven.” Journal of Cleaner Production 168:876–892. https://doi.org/10.1016/j.jclepro.2017.09.034.
- Difilippo, N. M., and M. K. Jouaneh. 2019. “Using the Soar Cognitive Architecture to Remove Screws from Different Laptop Models.” IEEE Transactions on Automation Science and Engineering 16 (2): 767–780. https://doi.org/10.1109/TASE.2018.2860945.
- European Commission Environment. 2011. European Commission Environment: Integrated Product Policy (IPP). European Commission. https://ec.europa.eu/environment/ipp/index_en.htm.
- Eurostat. (2021). Eurostat. Recycling Rate of E-Waste. https://ec.europa.eu/eurostat/databrowser/view/t2020_rt130/default/bar?lang=en.
- Forti, V., C. P. Baldé, R. Kuehr, G. Bel, S. Adrian, M. Brune Drisse, Y. Cheng, L. Devia, O. Deubzer, F. Goldizen, J. Gorman, S. Herat, S. Honda, G. Iattoni, W. Jingwei, L. Jinhui, D.S. Khetriwal, J. Linnell, F. Magalini, I.C. Nnororm, P. Onianwa, D. Ott, A. Ramola, U. Silva, R. Stillhart, D. Tillekeratne, V. Van Straalen, M. Wagner, T. Yamamoto, and X. Zeng. 2020. The Global E-waste Monitor 2020. United Nations University (UNU)/United Nations Institute for Training and Research (UNITAR). https://www.itu.int/en/ITU-D/Environment/Documents/Toolbox/GEM_2020_def.pdf.
- Friedrich, C., A. Lechler, and A. Verl. 2016. The Control Architecture RoVidiasS - a Robotic Visual Disassembly and Assembly System. Proceedings of the IEEE International Conference on Industrial Technology, 2016-May, 113–118. https://doi.org/10.1109/ICIT.2016.7474735
- Grimes, S. M., and D. Maguire. 2020. “Assessment of Priorities in Critical Material Recovery from Waste Electrical and Electronic Equipment.” Resources Policy 68 (May): 101658. https://doi.org/10.1016/j.resourpol.2020.101658.
- Herrmann, C., A. Raatz, M. Mennenga, J. Schmitt, and S. Andrew. 2012. “Assessment of Automation Potentials for the Disassembly of Automotive Lithium Ion Battery Systems.” Leveraging Technology for a Sustainable World 149–154. https://doi.org/10.1007/978-3-642-29069-5_26.
- IDIS. (2021). IDIS | the International Dismantling Information System. https://www.idis2.com/index.php.
- Jie, L., M. Barwood, and S. Rahimifard. 2015. An Automated Approach for Disassembly and Recycling of Electric Vehicle Components. 2014 IEEE International Electric Vehicle Conference, IEVC 2014. https://doi.org/10.1109/IEVC.2014.7056158
- Jin, X., and G. Tian. 2012. “A New Disassembly Network Graph Model and Its Automatic Generation.” Applied Mechanics & Materials 195–196:1083–1088. https://doi.org/10.4028/www.scientific.net/AMM.195-196.1083.
- Kim, H. J., S. Kernbaum, and G. Seliger. 2009. “Emulation-Based Control of a Disassembly System for LCD Monitors.” The International Journal of Advanced Manufacturing Technology 40 (3–4): 383–392. https://doi.org/10.1007/s00170-007-1334-z.
- Kinoshita, Y., T. Yamada, S. M. Gupta, A. Ishigaki, and M. Inoue. 2020. “Decision Support Model of Environmentally Friendly and Economical Material Strategy for Life Cycle Cost and Recyclable Weight.” International Journal of Production Economics 224 (November 2019): 107545. https://doi.org/10.1016/j.ijpe.2019.107545.
- Kopacek, P. 2005. “Semiautomatized Disassembly - Some Examples.” In IFAC Proceedings Volumes (IFAC-Papersonline) (Vol. 16, Issue 1). IFAC. https://doi.org/10.3182/20050703-6-CZ-1902.01449.
- Laszlo, R., R. Holonec, R. Copîndean, and F. Dragan. 2019. Sorting System for E-Waste Recycling Using Contour Vision Sensors. Proceedings of 2019 8th International Conference on Modern Power Systems, MPS 2019, 8–11. https://doi.org/10.1109/MPS.2019.8759739
- Li, J., M. Barwood, and S. Rahimifard. 2018. “Robotic Disassembly for Increased Recovery of Strategically Important Materials from Electrical Vehicles.” Robotics and Computer-Integrated Manufacturing 50 (March 2016): 203–212. https://doi.org/10.1016/j.rcim.2017.09.013.
- Liu, Q., Z. Liu, W. Xu, Q. Tang, Z. Zhou, and D. T. Pham. 2019. “Human-Robot Collaboration in Disassembly for Sustainable Manufacturing.” International Journal of Production Research 57 (12): 4027–4044. https://doi.org/10.1080/00207543.2019.1578906.
- Mao, W. L., W. C. Chen, C. T. Wang, and Y. H. Lin. 2021. “Recycling Waste Classification Using Optimized Convolutional Neural Network.” Resources, Conservation & Recycling 164 (July 2020): 105132. https://doi.org/10.1016/j.resconrec.2020.105132.
- Nascimento, J. C. D. 2019. “Decision-making and Fuzzy Temporal Logic.” ArXiv 1–11. https://doi.org/10.48550/arXiv.1901.01970.
- Parajuly, K., K. Habib, C. Cimpan, G. Liu, and H. Wenzel. 2016. “End-Of-Life Resource Recovery from Emerging Electronic Products – a Case Study of Robotic Vacuum Cleaners.” Journal of Cleaner Production 137:652–666. https://doi.org/10.1016/j.jclepro.2016.07.142.
- Polat, O., O. Capraz, and A. Gungor. 2018. “Modelling of WEEE Recycling Operation Planning Under Uncertainty.” Journal of Cleaner Production 180:769–779. https://doi.org/10.1016/j.jclepro.2018.01.187.
- Radaschin, A., A. Voda, E. Minca, and A. Filipescu. 2012. “Task Planning Algorithm in Hybrid Assembly/Disassembly Process.” In IFAC Proceedings Volumes (IFAC-Papersonline) (Vol. 45, Issue 6 PART 1). IFAC. https://doi.org/10.3182/20120523-3-RO-2023.00336.
- Saidani, M., B. Yannou, Y. Leroy, and F. Cluzel. 2020. “Dismantling, Remanufacturing and Recovering Heavy Vehicles in a Circular Economy—Technico-economic and Organisational Lessons Learnt from an Industrial Pilot Study.” Resources, Conservation & Recycling 156 (November 2018): 104684. https://doi.org/10.1016/j.resconrec.2020.104684.
- Schwab, K. 2015. The Fourth Industrial Revolution | Foreign Affairs. Foreign Affairs. https://www.foreignaffairs.com/articles/2015-12-12/fourth-industrial-revolution.
- Shumon, M. R. H., S. Ahmed, and S. Ahmed. 2016. “Fuzzy Analytical Hierarchy Process Extent Analysis for Selection of End of Life Electronic Products Collection System in a Reverse Supply Chain.” Proceedings of the Institution of Mechanical Engineers, Part B: Journal of Engineering Manufacture 230 (1): 157–168. https://doi.org/10.1177/0954405414553980.
- Tumkor, S., and G. Senol. 2007. Disassembly Precedence Graph Generation. 2007 IEEE International Symposium on Assembly and Manufacturing, 104, 70–75. https://doi.org/10.1109/ISAM.2007.4288451
- Ullah, M., and B. Sarkar. 2020. “Recovery-Channel Selection in a Hybrid Manufacturing-Remanufacturing Production Model with RFID and Product Quality.” International Journal of Production Economics 219 (June 2019): 360–374. https://doi.org/10.1016/j.ijpe.2019.07.017.
- Vongbunyong, S., S. Kara, and M. Pagnucco. 2013. “Basic Behaviour Control of the Vision‐Based Cognitive Robotic Disassembly Automation.” Assembly Automation 33 (1): 38–56. https://doi.org/10.1108/01445151311294694.
- Vongbunyong, S., M. Pagnucco, and S. Kara. 2016. “Vision-based execution monitoring of state transition in disassembly automation.” International Journal of Automation Technology 10 (5): 708–716. https://doi.org/10.20965/ijat.2016.p0708.
- Vongbunyong, S., P. Vongseela, and J. Sreerattana-Aporn. 2017. “A Process Demonstration Platform for Product Disassembly Skills Transfer.” Procedia CIRP 61 (c): 281–286. https://doi.org/10.1016/j.procir.2016.11.197.
- Yeh, W. C., and S. C. Wei. 2013. Simplified Swarm Optimization in Efficient Tool Assignment of Disassembly Sequencing Problem. 2013 IEEE Congress on Evolutionary Computation, CEC 2013, 2712–2719. https://doi.org/10.1109/CEC.2013.6557897
- Yi, J., B. Yu, L. Du, C. Li, and D. Hu. 2008. “Research on the Selectable Disassembly Strategy of Mechanical Parts Based on the Generalized CAD Model.” The International Journal of Advanced Manufacturing Technology 37 (5–6): 599–604. https://doi.org/10.1007/s00170-007-0990-3.
- Zhang, X. F., G. Yu, Z. Y. Hu, C. H. Pei, and G. Q. Ma. 2014. “Parallel Disassembly Sequence Planning for Complex Products Based on Fuzzy-Rough Sets.” The International Journal of Advanced Manufacturing Technology 72 (1–4): 231–239. https://doi.org/10.1007/s00170-014-5655-4.
- Zhu, B., and U. Roy. 2015. “Ontology-Based Disassembly Information System for Enhancing Disassembly Planning and Design.” The International Journal of Advanced Manufacturing Technology 78 (9–12): 1595–1608. https://doi.org/10.1007/s00170-014-6704-8.
- Ziqiang, Z., D. Guohong, W. Zhaoren, and Z. Xiangyan. 2015. “Fuzzy-Clustering Based Cost Modeling of Disassembly Planning for EOL Products.” The Open Mechanical Engineering Journal 9 (1): 546–551. https://doi.org/10.2174/1874155X01509010546.
- Zülch, G., and J. Hrdina. 2010. “Control of Disassembly Systems Based on the Division of Labour by Means of Dynamically Adapting Routing Plans.” Lecture Notes in Business Information Processing 46 LNBI:396–407. https://doi.org/10.1007/978-3-642-12494-5_35.
- Zülch, G., and R. Schwarz. 2008. “Planning and Balancing of Disassembly Systems.” IFIP International Federation for Information Processing 257:49–56. https://doi.org/10.1007/978-0-387-77249-3_6.