
 ?Mathematical formulae have been encoded as MathML and are displayed in this HTML version using MathJax in order to improve their display. Uncheck the box to turn MathJax off. This feature requires Javascript. Click on a formula to zoom.
ABSTRACT
The paper proposes a method to size a standalone hybrid PV/MHP/BES (photovoltaic/micro-hydro/battery energy storage) system. The proposed method is simple and easy to use. The size and location decoupled proposed approach can effectively size cost-effective systems. The method exploits variable renewable energy (VRE) resources adjustable complementarity proposing a CMACVRE (VRE Adjusted Complementarity Critical Month) term to size the hybrid system. By reducing capital investment and enhancing load sharing between VRE resources, the method inherently sizes cost-effective systems that minimise SnD gaps and operational expenses. The results show that the proposed method cannot only size a Homer Pro comparable system but can optimise a Homer Pro sized system further. Additionally, that the system sized by Homer Pro employing the proposed approach with adjustable complementarity delivers better results than the system sized by Homer Pro without it. The results show that the sized hybrid system meets load demand even considering ± 10% uncertainty. A North American site produces 4,069 kWh vs. 3,686 kWh of the energy required yearly; the Southeast Asian site produces 656 kWh vs. 607 kWh of the required; and the European site produces 12,982 kWh vs. 12548 kWh of the required, each considering −10% uncertainty.
1. Introduction
Renewable energy sources such as photovoltaic (PV), wind, and micro-hydro power (MHP) are seeing a rise on a global scale due to 1) energy cost, 2) scarcity, and depletion of resources. The Paris accord is just one of several examples that have prompted renewed interest in renewable energy generation (The Paris Agreement, United Nations Framework Convention on Climate Change Citation2024). PV systems on all scales and hydropower systems on a micro scale are gaining popularity. Power from solar panels is intermittent, and unless a water storage reservoir is provided, or the system is sized for the lowest flow available, hydropower production will fluctuate due to seasonal water flow variations in rivers and streams throughout the year. The intermittent nature of these renewable energy sources has led to them being referred to as variable renewable energy (VRE) and has hindered their deployment on a larger scale. BES system and/or fossil fuel generator (FFG) systems are commonly used to bridge supply and demand (SnD) gaps associated with VRE. The BES system increases the system cost, both capital and replacement costs, but can increase RE proportions and minimise FFG operation. In comparison, the FFG systems add to the system capital, as well as operational cost and cause pollution. Therefore, it is preferable to use a BES system over a FFG system as a backup to bridge most SnD gaps and minimise pollution. However, BES sizing should be an integral part of the sizing process to minimise the size and the associated expenses.
Traditionally, designers who are tasked with determining the size of a standalone hybrid photovoltaic/micro-hydropower/Battery Energy Storage (PV/MHP/BES) system for continuous energy supply without SnD gaps have relied on critical month and algorithmic optimisation techniques to solve the sizing issue. The traditional critical month sizing technique, overlooking complementarity adjustment, ensures continuous energy supply throughout the year without SnD gaps, but it is at the expense of a large and costly system. On the other hand, the algorithmic optimisation technique results in a cost-effective smaller system. However, this necessitates a sophisticated mathematical formulation complemented by the synthesis of an appropriate optimisation algorithm, which requires an optimisation software/solver. The VRE critical month that considers both VRE resources and adjustable complementarity, as opposed to the traditional critical month, can reduce PV, MHP, and BES sizes, as well as associated capital and operational costs (Yan et al. Citation2020), overlooked during hybrid systems sizing phase.
Hydropower generation at all levels, ranging from kilowatts (kW) to megawatts (MW), is prevalent worldwide. However, as is evident in the data presented in (Types of Hydropower Plants Citation2024), the global hydro resources remain unexploited and represent a significant opportunity. The typical components of any hydropower system comprise a water source (dam, river, stream and sewer), a turbine (reaction or impulse), a single- or three-phase generators (induction, synchronous), a speed/frequency controller (governor, droop), a converter (AC-DC, DC-DC and DC-AC), and various protection devices. Additionally, a transformer is added at the power system point of common coupling to lower losses for long-range electricity transmission, or for matching voltage. Frequently, hydropower systems will incorporate a dam for water storage, and/or a battery for electrical storage, to minimise fluctuations in generation.
Table 1. Hydropower potential worldwide.
MHP is presented as a possible renewable off-grid solution by (Hoq et al. Citation2011). Elbatran et al. (Citation2015). reviewed the operations and economics of MHP for rural and remote areas. The ref (Razan et al. Citation2012). identified the potential for MHP systems (≤100 kW) in Bangladesh. Umar and Hussain (Citation2014) reported on MHP opportunities in Pakistan. An example of an MHP system using wastewater is presented by (Beltran et al. Citation2014). The ref (Shakya, Bruce, and MacGill Citation2015). discussed MHP-based mini grid as a solution in Nepal. Blum, Wakeling, and Schmidt (Citation2013). evaluated the cost competitiveness of different VRE technologies, including MHP, in Indonesia. McDonald et al. (Citation2013). proposed the integration of high-head small hydro pumped storage systems into a VRE based smart grid. The ref (Dursun and Saltuk Citation2017). reported on a hybrid PV/HP system in Türkiye. Teixeira et al. (Citation2015). proposed a floating hybrid system comprising PV and HP in Brazil. All the references have deemed MHP to be a cost-effective and reliable solution, offering both social and environmental advantages, as well as a significant source of revenue or savings. However, none of the above has proposed complementarity adjustments to a hybrid PV/MHP system.
The PV arrays with multiple orientations, including tilt, azimuth, and seasonal adjustments, can be utilised to tailor production of the system to meet specific loads, specific seasons, or to avoid utility transmission/distribution congestion/curtailment. According to (Optimal Tilt of Solar Panels Citation2024), adjusting tilt twice a year (in the summer and winter) has been reported to enhance production by a minimum of 4%. Similarly, setting the azimuth to the east or west, shifting PV production in the morning or evening is presented by (Renewable Energy Benefits: Understanding the Socioeconomics, IRENA. Citation2017). The topic of geographically dispersed installation of photovoltaic systems as a source of increased smoothing and reduced intermittence is discussed in (Klima et al. Citation2018). The artificial intelligence-based Particle Swarm Optimization and Differential Evolution for the design and optimisation of a standalone hybrid PV/MHP/BES is reported by (Iweh and Akupan Citation2023). However, none proposed adjusting PV complementarity in response to MHP and load profile for better load sharing between the two VRE resources, which in turn minimises SnD gaps, system size and associated costs. In addition to ref (Iweh and Akupan Citation2023). opts for complex formulation and PSO-based optimisation.
Meshram, Agnihotri, and Gupta (Citation2013). demonstrated that a community can be served fluctuation-free electricity with a hybrid PV/HP system supported by a connected grid. Ref (Syahputra and Soesanti Citation2020). employed Homer coupled with field data/measurements to size PV/Hydro system. J. Jurasz and A. Piasecki (Jurasz et al. Citation2017) have successfully sized and utilised PV/Wind/Hydro with a battery storage system to supply the connected 30 MWh annual load. Syed (Citation2017) has outlined a simple approach in sizing a standalone hybrid PV/Wind system. Nonetheless, none of the aforementioned (Jurasz et al. Citation2017; Meshram, Agnihotri, and Gupta Citation2013; Syahputra and Soesanti Citation2020; Syed Citation2017) have considered the potential adjustability of the VRE resources for complementarity. Moreover, (Meshram, Agnihotri, and Gupta Citation2013; Syahputra and Soesanti Citation2020) have emphasised grid-tied systems, while (Meshram, Agnihotri, and Gupta Citation2013) and (Jurasz et al. Citation2017) have opted for intricate mathematical formulations coupled with optimisation algorithms, rendering hybrid system sizing challenging, if not impossible.
A feasibility study was performed by (Niringiyimana et al. Citation2022) for a hybrid PV/MHP system for rural electrification in Rwanda but overlooked both natural and adjusted complementarity. Additionally, hybrid system sizing was run in three modes: PV only, MHP only, and Hybrid PV/MHP, which requires extremely oversized PV and MHP systems when PV and MHP are run independently. Neupane et al. (Citation2021). examined the size of a standalone PV/MPH system, considering generation uncertainty, both with and without a BES system, employing derivative-free stochastic optimisation algorithms. The proposed approach is mathematical in nature and necessitates the resolution of an optimisation problem, rendering it a solution exclusively for mathematically proficient users and engineers. Furthermore, complementarity is neither discussed nor considered as a component of the optimisation model. The method proposed by (Bedadil and GebreMichael Citation2021) focuses on the net present cost of the energy generated and supplied by PV/MHP and BES systems using the HOMER Pro simulating software. In addition to the mathematics involved, this process requires optimisation software and takes the worst-case water flow as the basis for design for MHP and overlooks the complementarity entirely. For example, (Bedadil and GebreMichael Citation2021; Mostofi and Safavi Citation2013) uses complex optimisation algorithms to conduct a comparative analysis among Artificial Bee Colony, Particle Swarm Optimisation, and HOMER software rather than adopting a simplified approach to sizing. Oladigbolu, Ramli, and Al-Turki (Citation2020). proposed a standalone hybrid system for a village without grid power. The paper presented a techno-economic analysis that incorporates environmental impact into consideration. The analysis utilises the optimisation solver HOMER to size the system and conduct sensitivity analysis. The ref (Alturki and Awwad Citation2021). followed a mix of (Mostofi and Safavi Citation2013; Oladigbolu, Ramli, and Al-Turki Citation2020) performing techno-economic analysis and three different optimisation algorithms, with the same issues listed for (Mostofi and Safavi Citation2013; Oladigbolu, Ramli, and Al-Turki Citation2020). Ref (Hoseinzadeh, Ghasemi, and Heyns Citation2020). reports an application, coupled with a techno economic analysis, of PV to complement MHP to eliminate energy deficit in the summer months. Ref (Hoseinzadeh, Ghasemi, and Heyns Citation2020). is a viable solution for the given scenario but differs from the solution proposed in this paper as Ref (Hoseinzadeh, Ghasemi, and Heyns Citation2020) 1) complements existing MHP system, 2) uses Homer software, 3) focuses only a few months (Jul – Oct), 4) does not consider the hybrid system CM VRE, and 5) overlooks complementarity adjustment.
The complementarity of VRE resources is gaining interest all around the globe. The complementarity of RE resources in terms of space and time is examined by (Beluco, de Souza, and Krenzinger Citation2008). The complementarity observed between renewable energy resources such as PV-Wind, Concentrated Solar-Wind, PV-Hydro, and PV-Wind-Hydro was reported by (Beluco, de Souza, and Krenzinger Citation2012; Monforti et al. Citation2014; Santos-Alamillos et al. Citation2015), and (Bhandari et al. Citation2014), respectively. The ref (Beluco, Risso, and Canalesc Citation2019). reported an energetic complementarity between two VRE resources. A method to optimise complementarity between VRE resources is reported by (Kougias et al. Citation2016). The authors of (Kenfack et al. Citation2009) have emphasised the importance of complementarity as a viable option to minimise the utilisation of BES and FFG. Ref (Zhang et al. Citation2018). presented the short-term operation of complementary wind-PV-hydro systems. Ref (Couto and Estanqueiro Citation2020). reports that complementarity is still not explored and exploited to its fullest potential. On the other hand, ref (Han et al. Citation2019). explores PV/MHP/Wind natural complementarity and proposes PV, MHP and Wind size optimisation to enhance complementarity overlooking complementarity adjustment. All are excellent reads, and readers interested in a deeper understanding of the complexity should consult these. In contrast, complementarity as defined in this work, entails adjusting the potential of renewable energy resource(s) from their natural (or traditional) potential. This enhances hybrid system capability by adjusting the energy production profiles of the VRE to meet load demand with minimal SnD gaps and reducing system size and cost.
A review of the literature, research and articles cited above clearly indicates that sizing methods and tools are either complex optimisation algorithms that require optimisation solvers or focus on traditional worst-case critical month design/sizing techniques. The cited literature fails to acknowledge the importance of resource complementarity, especially adjusted complementarity. The importance of natural and/or adjustable complementarity that enhances load sharing among VRE resources, minimises hybrid system cost, and enhances load sharing, is generally neglected. Therefore, this paper proposes a method to bridge the gap by exploiting adjustable complementarity, in addition to inherent/natural complementarity of the VRE resources, to size standalone hybrid PV/MHP/BES system.
The proposed sizing methodology is extremely simple and straightforward to comprehend and use, requires no complex formulation (higher mathematics, algorithms, optimisation solvers, etc.) and sizes effective system with no SnD issues (or loss of load), even when considering ± 10% uncertainty. This method is equally applicable to size systems ranging from a few to hundreds of kilowatts and can be used across North America, Asia, and Europe.
In addition to the features above, the novelty of the approach is its exploitation of a VRE resource’s adjustable complementarity, as opposed to a traditional sizing approach based on critical month, where the VRE resource’s individual or natural complementarity, without adjustment, is exploited. A new term, CMACVRE (Critical Month of VRE resources after Complementarity Adjustment), is coined and used to size the hybrid system. The proposed method, coupled with CMACVRE, sizes a near optimal cost-effective system delivering on the features listed in the abstract. The remainder of the paper is organised into the following sections: (II) MHP, PV and BES systems, (III) The Proposed Method, (IV) Sizing Results and Discussions.
2. Materials and methods
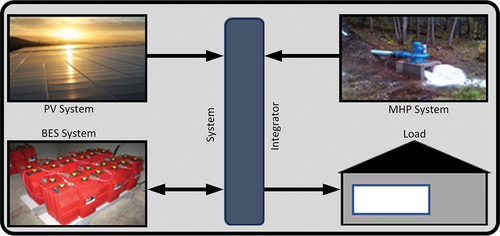
shows the hybrid system considered in this work. To meet the load demand, the hybrid system has PV, MHP, and battery energy storage systems. All connected systems except the BES system have unidirectional power flow. It stores when the hybrid system has excess energy and supplies when it cannot meet the load demand. For improved readability, this section introduces readers to these systems one by one.
Figure 1. Hybrid PV/MHP/BES system and load.
2.1. Micro hydropower system
Hydropower systems are classified as MHP systems when the size is less than or equal to 100 kW. The main components of the MHP system include intake, penstock, turbine, tailrace, controller, and dump load (see ), as well as the system’s balance (such as protection devices, disconnects, cables, converters, etc.). MHP uses reaction or impulse-type turbines. Reaction type turbines (such as Propeller, Francis, Kaplan, and Kinetic) suitable for low to medium head applications use water pressure and kinetic energy; while impulse type (such as Pelton, Crossflow and Turgo), suitable for high head applications, use kinetic energy of high-speed jet of water. The MHP system can be grid tied or stand-alone, AC or DC, and can be equipped with one or more (to take advantage of the varying seasonal water availability) turbines.
Table 2. MHP system main components.
Power produced by MHP system given by (1) is a function of net head and water flow. Where the PMHP is MHP system power, the η is MHP system efficiency, the p is water density (1000 kg/m3), the g is gravity (9.81 m/s2), the Qd is design water flow (m3/s), and the Hn is net head height in metres. The next Equationequation (2)(2)
(2) gives the PMHP in kW, where Hn is the water pressure due to the elevation difference between intake of penstock/pipeline and the turbine. Hn, in (2), is given by (3). It is the difference between gross head (Hg) and water pressure loss due to pipeline friction (Hl) in m. It is the vertical height from intake to the turbine, not the length or size of the pipeline. A well designed MHP system usually has an Hn of between 85% and 95%.
Design flow (Qd) in (1) and (2) is the water flow through penstock/pipeline, not a river or stream. The Qd is usually limited to a certain % of the stream’s flow to safeguard the natural environment and its inhabitants. Head and flow measurements are performed using well established methods, and interested readers are referred to (New Citation2024).
Multiple MHP system sizes are possible with the water flow (Q) data tabulated in (Holand River Hydrometric Data, Government of Canada Citation2023). The MHP system can be sized according to the design flow (Qd) 1) Qd = Qlow = 1.65 m3/s, the lowest design flow in Nov, under-utilising the available resources; 2) Qd = Qavg = 2.34 m3/s, the yearly average flow, exploiting the average potential of the available resources; 3) Qd = Qhigh = 3.23 m3/s, the highest flow in July, causing higher cost with poor performance during the months with lower flow; or 4) Qd = QCM, the critical month water flow, a month with the highest load demand of the site with respect to the system energy production potential. See EquationEquation (6)(6)
(6) below for further details (Section 2(E)).
Table 3. MHP system flow.
A high head system (by building intake at height from turbine) can produce more power at low flow but at a higher cost due to longer pipelines. Similarly, a low-head system can produce more power but needs high flow, a rarity, and requires larger pipes, which add to the cost. To take advantage of seasonal variations in water flow Q, an MHP system with multiple (2 or 4) nozzles or multiple turbines is also an option. However, both multiple nozzle and multiple-turbine systems lead to higher cost and underutilisation during months when resources are scarce. Thus, a designer of MHP systems is often faced with a design flow (Qd) selection decision to size a cost-effective MHP system.
Energy produced by an MHP system, a function of Q, changes with a fluctuating Q on a site, as in . For instance, using Q (Q as Qd) in July to size a turbine would result in a much higher energy supply in July than the energy produced during the remaining 11 months of the year. A system this big will also require a dump load to shun excess energy, wasting precious and environmentally friendly energy. A BES system to store excess energy would be a viable alternative. A BES system sized for a lower potential period/month will cost less, but it will not be able to store the excess energy generated during the higher potential periods. Conversely, the BES system sized to higher resource months will be underutilised in the lower potential periods/months besides adding to the capital and replacement expenses. The Q selection as Qd can have a negative impact on the size of the MHP system and can impact the overall cost of the system adversely.
Since a grid can accommodate excess energy and supply energy required during PV/MHP shortage; therefore, design flow (Qd) selection, BES system sizing, etc. decisions are trivial for a grid-tied system. However, these choices can either save or hurt a standalone system, rendering MHP system financially and technically unworkable. To keep the system economically cost-effective, and technically feasible by exploiting available MHP resources as best as possible, without SnD issues, with minimal waste of produced energy and a smaller BES system, a MHP system designer must conduct thorough assessments of the site for consumption and consumption patterns using MHP resource potential and resource patterns. This commonly requires complex mathematical formulation, algorithm development, and optimisation software/solver. However, the complexity of mathematical formulation, algorithm development, and optimisation software/solver is required to optimise conflicting objectives, making sizing such a system difficult, if not impossible.
2.2. Photovoltaic system
PV systems convert solar irradiance into DC power. PV modules are connected in series to form strings, and strings are connected in parallel to form sub-array and array. An inverter is added to an array to convert DC power into AC for load and/or export to the grid. The PV system’s current and voltage are determined by light intensity (irradiance) and temperature, as well as the cell’s type and area. The voltage varies with temperature, and current with solar irradiance. At any instant t, PV power is given by (4), where Pt, PVac, Gt, Gref, Cp and Tref are PV power at time t with system operating temperature Tsys, PV system ac size, irradiance, reference solar irradiance (1000 W/m2), PV module power co-efficient (from module datasheet), and reference temperature (25 °C), respectively. PVac in (4) is given by (5), where E is the energy required and PSH (peak sun hour) is the number of hours with an average daily irradiance of 1000W/m2 at the site.
A standalone PV system is conventionally sized based on the critical month PSH and is commonly oversized 110–140% to compensate for the losses due to soiling (such as dirt and snow), equipment/strings mismatch and quality, modules light conversion, DC cables resistance, DC-DC conversions, BES system conversion, DC-AC conversions, transformers, AC cables resistance, and system/equipment degradation (including module light induced degradation) over the operating life of the system.
Installation orientations, such as tilt and azimuth, are used to optimise PV system output and energy yield. The monthly PV resource potential (daily average PSH for 12 months) is shown in for different installation orientations of a 10 kW (12 kW DC) system in Toronto, Canada using (PVWatts Calculator, PV systems sizing software Citation2023). The second column shows the reference installation orientation at 0°/0° tilt/azimuth (sky facing). There is 1.15 times more energy produced as shown in column 3 with an optimal installation orientation at 30°/0° tilt/azimuth (south facing). The monthly production at 30°/45° tilt/azimuth (south-east facing, column 4) orientation shows an overall loss of around 4–5% in yearly production compared to optimal (south facing, column 3) production, but with a noticeable shift in the individual month’s PV resources. The same is true for 30°/-45° tilt/azimuth (south-west). Similarly, column 5 shows monthly PV resources and yearly production at 15°/0° tilt/azimuth (summer pro) and column 6 at 45°/0° tilt/azimuth (winter pro) orientations. The resources can also be shifted to produce PV energy during the morning (30°/90° tilt/azimuth, east facing) or evening (30°/90° tilt/azimuth, west facing) hours. Comparison of column 5 (15°/0° tilt/azimuth) and column 6 (45°/0° tilt/azimuth) within column 3 (optimal 30°/0° tilt/azimuth) reveal PV resource shift towards summer or winter months, but at the expense of reduction in PV resources. Nevertheless, PV system resource potential and energy production can be shifted.
Table 4. PV PSH as a function of tilt/azimuth (Toronto, Canada).
In conclusion, PV resource potential (PSH) is programmable. PV PSH is the function of installation orientation. PV PSH can be adjusted to increase/decrease PSH during targeted months or times of the day. Similarly, PV PSH can be adjusted, selecting different installation orientations to cater PV energy production to load demand. Similarly, PV PSH can be programmed to increase its complementarity with MHP potential (Q) to better share load demand between the two VRE resources. Adjusting PV installation orientations for complementarity modifies PV yearly PSH and yearly energy production. The designer should aim to minimise the annual PSH and energy loss, while accommodating load sharing between VRE resources, to avoid PV resource underutilisation.
2.3. PV/MHP complementarity
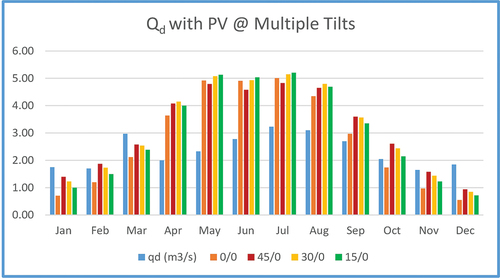
displays the PV PSH (monthly averages) and water flow Q for a site. The PV PSH is presented in a variety of orientations (tilt/azimuth). The table shows that Q is higher in March, July, and August, median in June and August, and lower for the remaining seven months. The table also shows higher PV PSH (at 0°/0° tilt/azimuth) from May to August, median for April and September, and lower for the remaining six months. Comparing Q with PSH (at 0°/0° tilt/azimuth) reveals that both Q and PSH peak in July. May to August are higher potential months for both Q and PSH, while November to February have the lowest potential.
Table 5. PV and MHP resources – natural vs. adjusted complementarity.
Q determination as Qd is needed for the best possible utilisation of the available water resource while keeping the sized system cost efficient. The selection of Q = 3.23 (equally 3.10 and 2.97) m3/s as Qd will result in higher system cost even though the system will be used at this potential for only two out of 12 months since remaining 10 months have lower Q, rendering the sized system underutilised. The same thing happens with Q = 1.65 (equally 1.85, 1.75, and 1.70) m3/s selection as Qd, which will miss the possible higher generation due to the available resources in the other months. The other option would be to select Q = 2.34 m3/s (annual average, QAvg) as Qd, but this fails to capture higher generation in 5 months of the year.
illustrates that the two VRE resources have varying complementarity as a function of orientation. The PSH, for instance, increased from January to April and from August to December, while decreased from May to July at 45°/0° tilt/azimuth compared with 0°/0°. The other two pairs of tilt/azimuth shown in the table share similar features.
Based on , illustrates the potential of the resources, Q with PSH at different tilt/azimuth combinations using 0°/0° as a reference. There is varying complementarity between Q and PSH when looking at the month-by-month bars in . It is apparent that PSH at 45°/0° tilt/azimuth (maroon) has the best complementarity with the site Q compared to 0°/0°, 30°/0°, and 15°/0° tilt/azimuth. The 45°/0° monthly PSH bar (maroon) is almost double in size compared to the monthly PSH bar 0°/0° (orange) in January, a month with the third lowest Q in the table. Thus, installing the PV system at 45°/0° instead of 0°/0° can increase VRE share in January. The same argument can be made for the months of February, April, and August, when the maroon monthly bar surpassed the orange monthly one. Note that the maroon monthly bar is smaller than the orange monthly bar for May to July as expected due to PSH redistribution.
Figure 2. Adjusted complementarity – bar charts.
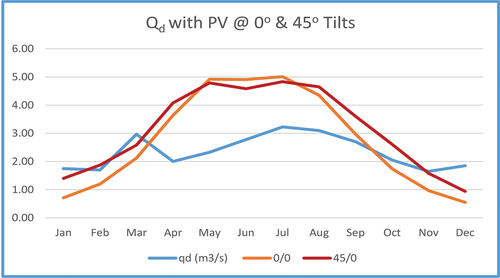
repeats as a line chart. shows that PV PSH increased from January to May and August to December at 45°/0°. Note that the site Q is low during these months thus additional PV PSH can help deliver for the load during these months. Thus, the change in tilt/azimuth can change PV PSH for better load sharing between VRE resources.
Figure 3. reproduced as a line chart.
The adjusted complementarity in (or 3) comes at a cost, as discussed in Section 2(B), since the PV orientation adjustment modifies the PV monthly and yearly PSH. This changes the annual energy production by a small amount (<5%) but enhances load sharing between VRE resources. The previous paragraphs indicated that PV production potential increased in the first four and last 5 months but decreased from June to August. The monthly PSH/potential reduction may manifest as a yearly decrease in the PV potential compared to PSH at optimum orientation of the site. However, the average loss is generally small (<5%) while enhancing the two resources’ complementarity. Increased complementarity means a smaller MHP system, a smaller PV system and a smaller BES system, which translates into a cost-effective hybrid system.
2.4. Battery energy storage system
A BES system is used for energy backup to bridge SnD gaps when VRE resources are not available and VRE systems produce no power. The BES system is preferred over FFG, as it does not have an operating cost or generate pollution. Therefore, FFG usage should be restricted to occasional emergency use during SnD gaps beyond the BES system’s capabilities. Typically, electrical power is converted into chemical energy for storage and then back into electrical during retrieval phase. Batteries are often connected in series to build strings, and strings are connected in parallel to form a BES system.
BES system operation causes losses during both charging/storage and discharging/retrieval phases and is usually represented as BES system efficiency (ƞB). For reliable operation and longer life, as recommended by manufacturers, BES systems impose a limit on charging and discharging power at any given instant by limiting charging the BES system to maximum state-of-charge (SOC) and discharging to maximum depth-of-discharge (DOD). The lifespan of BES system lifespan is brief (<10 years) and is determined by the number of BES system charge-discharge cycles. However, the BES system is modular and scalable thus usable at all levels, from residential (kWh) to utility (MWh) scales.
2.5. The proposed method
The proposed method provides a simple approach to size cost-effective standalone hybrid PV/MHP system with BES using (6) – (21). The remainder of this section explains the approach.
The CMACVRE (Adjusted Complementarity VRE critical month) is the month of a year with the highest EL to available VRE resources ratio and defines the most demanding month out of the 12 months for VRE system. The CMACVRE is given by (6), where ELCM is the site’s average load, PSHACCM is the site’s available PV system peak sun hours after complementarity adjustment, and QCM is the site’s water flow. Note that ELCM, PSHACCM and QCM in (6) represent a hybrid VRE system’s critical month value, as opposed to PV or MHP individual critical month values, after adjusting complementarity of PSH based on the proposed method.
MHP monthly average Q (QMHP) is calculated by (7), where QJan to QDec are monthly water flow. EquationEquation (8)(8)
(8) defines the MHP system capacity factor (CFMHP) as either equal to QMHP when QMHP is greater than or equal to 0.75 otherwise 1.
Hybrid system capacity factor (CFHYB) given by (9) is the sum of CFMHP and PV system capacity factor (CFPV). It is the collective potential of the hybrid system. Whereas CFMHP-HYB and CFPV-HYB equal CFMHP and CFPV, each with an upper limit of 1.
Variable m is given by (10) where PSHYr is a PV system’s yearly average PSH and PSHACCM is a hybrid system’s critical month PSH after complementarity adjustment. Factor Xm in (11) equals m if m is greater than 0 but smaller than or equal to 1 and equals 1 otherwise. The number, n and Xn for MHP systems are given by (12) and (13), respectively. QYr is the yearly average, and QCMVRE is the hybrid/VRE system’s critical month water flow in (12). Factor Xn in (13) equals n if n is greater than or equal to 0.75 but less than or equal to 1 and equals 1 otherwise.
EquationEquation (14)(14)
(14) gives the size of a standalone hybrid PV/MHP system (PHYB) in kW, where PPV and PMHP kW are calculated by (15) and (16). Whereas PPV and PMHP are rounded up (⌈ ⌉, ceiling function). It is worth noting that (14) is a union highlighting the fact that PHYB is a two-part solution (PV and MHP) and that the load is assumed to be distributed equally, 50% each to PV and MHP, represented by a factor of 0.5 in (15) and (16).
The net head (Hn) is defined by EquationEquation (17)(17)
(17) – (Equation19
(19)
(19) ) for the MHP system. The initial value (Hni) of the net head is estimated by (17) using (2). To add 10% of the safety margin, the safety factor is 1.10. To cover for losses, the gross head (Hg) is calculated by the ceiling function (⌈ ⌉) of the sum of Hni and head loss (Hl = 0.1 Hni) in (18). The Hn is calculated by (19) using (3) ensuring it falls between 85% and 95% of Hg for a well-designed system as discussed in section 2(A). The pipeline is then selected per calculated Hn. A 10% loss associated with head (Hl) is compensated for by a 10% increase in head (Hn) to serve as a cushion against Q variations using EquationEquation (17)
(17)
(17) – (Equation19
(19)
(19) ).
EquationEquation (20)(20)
(20) is used to determine BES required size in Ampere-hours (Ah). Where D is the number of backup days required, ηB is the BES system round-trip efficiency, DOD is the BES system permissible depth of discharge (80%), ELavg is the average load and V is the BES system voltage. Note that the energy generated by MHP system can be included in (20) to minimise the BES size and cost. However, it is left out as an added safety factor for the increased size and reliability of the system. The BES backup capacity for time periods other than 1.5 days can easily be calculated by inputting the desired value for D.
Finally, (21) computes the annual energy generated by the sized PV/MHP/BES system. (21) enables annual energy produced, compared against the annual load demand of the site, to verify the sized system efficacy. The energy computed by (21) is used to verify the produced energy efficacy by considering production excluding ± 10% uncertainty followed by production including ± 10% uncertainty.
In the method described in this paper, the standalone hybrid PV/MHP system is sized with yearly ± 10% VRE excess/shortage due to uncertainty associated with VRE resources (Prilliman et al. Citation2024). Note that the FFG is kept for emergency use, as a backup FFG will fill the gap when necessary. Oversizing PV/MHP and/or BES system is required to eliminate them completely, but it would incur additional expenses.
In a nutshell, the proposed sizing method requires 1) PV resource assessment/adjustment for increased complementarity (PVACVRE) between PV and MHP resources, 2) selection of Qd and PVACVRE, 3) CMVRE identification, 4) CFPV, CFMHP and CFHYB determinations, 5) m, Xm, n and Xn estimation, 6) PPV, PMHP and PHYB calculations, 7) net head estimation, 8) BES system sizing for backup, followed by the system sizing verification to ensure efficacy of the produced energy against site load with and without ± 10% uncertainty.
3. Results and discussion
Multiple tests are conducted to verify the proposed method in this section. First, the sufficiency of the produced energy is checked by comparing a year’s worth of energy produced by the sized PV/MHP/BES system against the annual load consumption. Second, a variety of systems are sized to validate the proposed methodology’s capability to size systems ranging from a few to several hundred kW. Third, to demonstrate the proposed method's applicability, systems are sized in North America (Canada), Europe (UK) and Southeast Asia (Pakistan). Fourth, PV PSH ± 10% uncertainty is considered to prove the efficacy of the sized system without requiring running FFG. The London (UK) site is also simulated/sized using Homer Pro (Homer Pro Citation2024) to benchmark the proposed system size against Homer Pro. Additionally, a quick analysis is performed, and a short comparison is drawn, to demonstrate a sized system is cost-effective. The objective is to show that the method is simple and effortless to apply, requiring no complex formulation, higher mathematics, algorithm, or optimisation solver as shown below in sub-sections 2.1, 3.2, and 3.3. Note that MHP system efficiency (η) of 70%, BES system DOD of 80% and BES system round-trip efficiency of 0.90 are considered in this work.
3.1. Toronto, Canada (North America)
shows the averages monthly energy requirement (EL), monthly PSH at 50°/0° tilt/azimuth and monthly Qd for 12 months for a North American site (Toronto, Canada). The table shows 12 CMVRE (critical month VRE resources) values for the hybrid system over 12-month. The CMVRE values are extracted from for increased complementarity at 50°/0° tilt/azimuth using (6). The month of November is the CMVRE for the hybrid system for this site. Recall, CMVRE is the month with the highest demand for VRE resources.
Table 6. Site data North America (Toronto, Canada).
The QMHP = 1.08, CFMHP = QMHP = 1.08 and CFHYB = 1.13 for this site using (7) – (9) with CFPV = 0.14 (PVWatts Calculator, PV systems sizing software Citation2023). Applying (10) – (13) gives m = 1.01, Xm = 1, n = 0.16, and Xn = 1. The PPV = 52 kW and PMHP = 7 kW using (15) and (16). EquationEquations (17(17)
(17) ) – (Equation19
(19)
(19) ) give Hg, Hn, and Hl to be 4, 3.6, and 0.4 metres respectively. The BES system equals 648kWh for 1.5-day backup based on 307 kWh average monthly load (3,686 kWh/12 months) using (20).
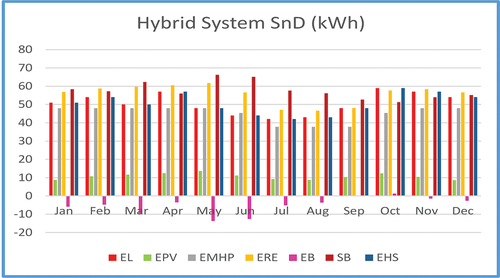
(and subsequent hybrid system performance graphs) provide an overview of the hybrid system energy production and its comparison against the site load demand for a 12-month period, with BES considered to be 50% charged at the beginning of the cycle. The figure shows load demand EL (red), hybrid system energy including BES EHS (blue), hybrid system energy (without BES) ERE (yellow), BES energy flow EB (pink), PV energy EPV (green), MHP energy EMHP (grey) and BES status SB (maroon).
Figure 4. Hybrid system performance – Toronto (Canada).
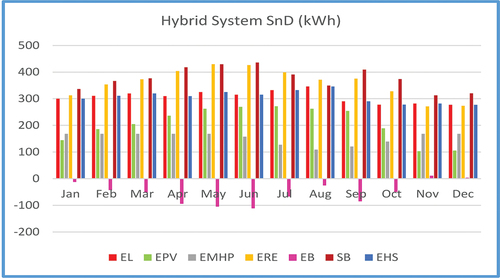
EL is successfully met by EHS throughout the year, as shown in . The EHS is greater than the EL from January to October but less in the months of November and December. The energy is stored in BES during the first 10 months and retrieved during the last two months to meet EL, as shown by EB. Accordingly, FFG is not required to be operated. This can be verified by (21), which shows that the energy generated amounts to 4,318 kWh, with 1,829 kWh being contributed by MHP and 2,489 kWh generated by PV.
Taking PSH ± 10% uncertainty into account, the PV system generated energy can swing as low as 2,240 (2,489 kWh −10%) and as high as 2,737 kWh (2,489 kWh +10%). Thus, the energy generated by hybrid system can vary from as low as 4,069 (1,829 kWh + 2,240 kWh) to as high as 4,566 kWh (1,829 kWh + 2,737kWh) at PSH ± 10% uncertainty. Note that FFG is not required to be operated because the lower estimate of energy production (4,069 kWh) is still greater than the yearly requirement (3,686 kWh).
3.2. Kohat, Pakistan (South Asia)
The proposed method’s suitability on the other side of the globe is demonstrated by sizing a standalone hybrid PV/MHP system in Southeast Asia (Kohat, Pakistan). In this case, a small residential system is sized. The PSH increased complementarity with Qd was observed at 15°/0° tilt/azimuth for this site, as reported in .
Table 7. Site data South Asia (Kohat, Pakistan).
CMVRE is December for this site. QMHP = 0.85, CFMHP = QMHP = 0.85 and CFHYB = 1 with CFPV = 0.15 (International Finance Corporation, World Bank Citation2024) using (7) – (9). Applying (10) – (13) gives m = 0.24, Xm = 0.25, n = −0.15, and Xn = 1. Then PPV = 2 kW and PMHP = 2 kW using (15) and (16). EquationEquation (17)(17)
(17) – (Equation19
(19)
(19) ) gives Hg, Hn, and Hl to be 5, 4.5 and 0.5 metre, respectively. The BES system equals 106 kWh for 1.5-day backup based on 51 kWh average monthly load using (20).
provides insight into the sized hybrid system energy production and its comparison against the site load demand for 12 months, with BES considered to be 50% charged at the beginning of the cycle. The figure shows that EHS consistently meets EL requirements throughout the year. The EHS is greater than the EL from January to September, as well as November, but less in October. As a result, energy is stored in BES for the first 9 and last 2 months to meet the EL, and retrieved from BES for the month of October, as shown by EB. As expected, the shortage in October is covered by BES, and FFG isn’t required to be operated. This can be verified by (21), which shows that the energy generated amounts to 668 kWh, with 540 kWh being contributed by MHP and 128 kWh being generated by PV.
Figure 5. Hybrid system performance – Kohat (Pakistan).
Taking PSH ± 10% uncertainty into account the PV system generated energy can swing as low as 116 kWh (128 kWh −10%) and as high as 141 kWh (128 kWh +10%). Thus, the energy generated by hybrid system can vary from as low as 656 (540 kWh + 116 kWh) to as high as 681 kWh (540 kWh + 141 kWh) at PSH ± 10% uncertainty. Note that FFG is not required to be operated because the lower estimate of energy production (656 kWh) is still greater than the yearly requirement (607 kWh).
3.3. London, United Kingdom (Europe)
Finally, the proposed method is applied to a system in Europe (London, UK). The PV PSH’s enhanced complementarity with Qd for the site was observed at 45°/0° tilt/azimuth, as shown in .
Table 8. Site data Europe (London, UK).
CMVRE is January for this site. QMHP = 1.34, CFMHP = 1.34 and CFHYB = 1.1 with CFPV = 0.10 (PVWatts Calculator, PV systems sizing software Citation2023). Applying (10) – (13) gives m = 1.23, Xm = 1, n = 0.34, and Xn = 1. Then PPV = 231 kW and PMHP = 18 kW using (15) and (16). EquationEquation (17)(17)
(17) – (Equation19
(19)
(19) ) gives Hg, Hn, and Hl to be 2, 1.8 and 0.20 metre, respectively. The BES system equals 2,172 kWh for 1.5-day backup based on 1,045 kWh average monthly load using (20).
illustrates the behaviour of the sized system in terms of energy production and its comparison against the site load demand over a 12-month period, with the BES considered to be 50% charged at the beginning of the cycle. The shows how EHS consistently meets EL requirements throughout the year. The EHS is greater than the EL from April to September, but less during the months of January to March and October to December. As a result, surplus energy is stored with the BES during the months of April to September and retrieved from the BES during the remaining 6 months, as shown by the EB. As expected, the shortage is supplied, and surplus is stored by the BES and FFG is never operated. This can be verified by (21), which shows that the energy generated amounts to 13,849 kWh, with 5184 kWh being contributed by MHP and 8664 kWh by PV.
Figure 6. Hybrid system performance – London (England).
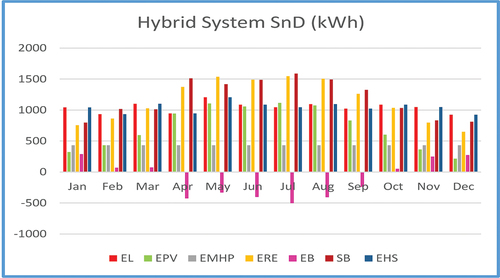
Taking PSH ± 10% uncertainty into account the PV system generated energy can swing as low as 7,798 kWh (8664 kWh −10%) and as high as 9,531 kWh (8,664 kWh +10%). Thus, the energy generated by the hybrid system can vary from as low as 12,982 (5,184 kWh + 7,798 kWh) to as high as 14,715 kWh (5,184 kWh + 9,531 kWh) at PSH ± 10% uncertainty. Note that FFG is never operated because the lower estimate of energy production (12,982 kWh) is still greater than the yearly requirement (12,548 kWh).
3.4. Comparative analysis
In this section, we perform comparative analysis to benchmark the proposed method and verify if it is effective. A four-pronged approach is followed as discussed in sub-sections (A), (B), (C) and (D).
A) Refs (Elbatran et al. Citation2015). to (Dursun and Saltuk Citation2017) overlooked adjustable complementarity completely. None of the refs (Teixeira et al. Citation2015). to (Iweh and Akupan Citation2023) exploited PV complementarity adjustment in response to MHP production and load profile. The same is true for (Meshram, Agnihotri, and Gupta Citation2013) to (Hoseinzadeh, Ghasemi, and Heyns Citation2020). Most of the methods propose sizing the system using either PV or MHP potential as a worst-case design base, with a few considering only natural complementarity. Thus, the majority of the methods result in large and expensive systems. It is like using EquationEquation (6)(6)
(6) with either 1) individual VRE resource’s critical month PSHCM or QCM instead of a hybrid system’s combined PSHCM + QCM, or 2) using only natural complementarity instead of adjusted complementarity PSHACCM of the VRE resources. Both approaches would cause the denominator in (6) to be smaller, compared to the method proposed in this work, giving a larger CM (or CMVRE) value (or load/VRE Resources Ratio), which will result in a larger PV/MHP/BES system. Hence, the proposed method, with a larger denominator due to complementarity adjustment, will always size a smaller system compared to the methods reported in the literature.
B) To validate the proposed method further, the London (UK) system was modelled using Homer Pro (Homer Pro Citation2024) with PV, MHP, BES and load for the site. The 18 kW MHP system, sized by the proposed method in sub-section (3.3), was used as a reference. compares results of the proposed method with the ones produced by Homer Pro using Homer Pro integrated PSH for the site (London, UK).
Table 9. The proposed vs homer system.
Using Homer Pro results as a reference, the tables show that the hybrid system sized by the proposed method has 57% smaller PV and 39% larger BES compared to the Homer Pro sized system, respectively. Thus, the proposed system is smaller on the PV side but larger on the BES size yielding a Homer Pro comparable hybrid system.
C) This section proves operations effectiveness, as well as cost-effectiveness, of the proposed method even further by running Homer Pro sizing simulations four times using data (0°/0°, 15°/0°, 30°/0°, 45°/0°) in (PV and MHP Resources – Natural vs. Adjusted Complementarity) coupled with consumption/load for London, UK. Note that, based on the proposed method with adjustable complementarity (Section 2(C)), 45°/0° was identified to have the highest adjusted complementarity out of the four tilt/azimuth combinations.
The Homer Pro results in are quite revealing, thanks to the proposed method with adjustable complementarity:
The system size changes from larger (at 0°/0°) to smaller (at 45°/0°) as a function of complementarity adjustment.
The hybrid system sized at 45°/0° is the smallest, as well as the most cost-effective, of the four hybrid systems sized by Homer Pro.
The hybrid system sized at 45°/0° with adjustable complementarity is smaller than the one sized by Homer Pro shown in without adjustable complementarity.
The hybrid system sized by the proposed method () is comparable with the one sized by the Homer Pro (45°/0° @ ) with the proposed method integrated. The proposed method PV is 20% smaller and BES is 18% larger than Homer Pro.
Table 10. The proposed method integrated homer pro runs.
3.5. Cost analysis
The following can be derived from (A), (B) and (C) to substantiate cost-effectiveness of the proposed system without going into detailed cost analysis:
The work reported in literature fails to consider complementarity adjustment, which results in larger and more expensive systems [@ 3.4(A)].
The hybrid system sized by the proposed method is comparable with the system sized by Homer Pro using Homer Pro integrated PSH [@ 3.4(B)].
With the proposed method adjustable complementarity approach using 45°/0° tilt/azimuth PSH [@ 3.4(C)], the hybrid system sized by the proposed method is comparable with the system sized by Homer Pro.
The proposed method with adjustable complementarity aids Homer Pro to optimise the hybrid system size further [@ 3.4(C)].
All four points above are quite convincing and clearly show the cost-effectiveness of the proposed method with complementarity adjustment. Number (1) re-iterates research gaps and need for the proposed method. By comparing Homer Pro sized systems with one another as a function of complementarity adjustment with cost-effective system sized at the best adjusted complementarity (45°/0°), number (4) substantiates the proposed method further. Number (2) and (3) show that the proposed method sized Homer Pro systems are comparable and speak for themselves without warranting any cost analysis to prove the proposed method's efficacy or cost-effectiveness.
4. Conclusions
This paper presented a method to size a standalone hybrid PV/MHP/BES system. The proposed sizing approach is straightforward and requires neither elaborate formulation nor algorithmic synthesis. By exploiting PV and MPH natural complementarity coupled with PV adjustable complementarity, this method creates better load sharing, smaller size, and lower costs.
The results show that the proposed method 1) is simple, 2) easy to follow/apply, 3) can be used to size systems from a few to 100’s of kW, 4) is equally applicable across 3 continents, 5) can effectively deliver for the load, 5) can withstand PSH ± 10% uncertainty, 7) can minimise FFG operation, and 8) can size near optimal cost-effective system.
Furthermore, the results and comparative analysis in sub-section (3.4) reveal that the proposed method, coupled with novel complementarity adjustment, 1) minimises operational cost (no FFG operation), 2) minimises pollution (no FFG operation), 3) can size Homer Pro comparable system and 4) can even optimise Homer Pro sized systems further.
Future work on further improving and expanding this method includes 1) a simple algorithm with coding to auto select optimum CMRE resulting in a cost-effective system, 2) load profile modification, in addition to PV complementarity, by shifting load to run concurrently with peak PV and/or MPH production to further minimise system size, and 3) extend BES life via BES charge/discharge cycles minimisation.
Abbreviations/Acronyms
| AC | = | Alternating Current |
| BES | = | Battery Energy Storage |
| CM | = | Critical Month |
| DC | = | Direct Current |
| DOD | = | Depth of Discharge |
| FFG | = | Fossil Fuel Generator |
| HP | = | Hydro Power |
| MHP | = | Micro Hydro Power |
| PSH | = | Peak Sun Hour |
| PV | = | Photovoltaic |
| RE | = | Renewable Energy |
| SnD | = | Supply and Demand |
| VRE | = | Variable Renewable Energy |
| SOC | = | Status of Charge |
| Units | = | |
| Ah | = | Ampere-Hour |
| kg/m3 | = | Kilogram/Cubic Meter |
| kW | = | kilowatt |
| kWh | = | kilowatt-hour |
| m/s2 | = | Meters/Second Squared |
| m3/s | = | Cubic Meters/Second |
| MW | = | Megawatt |
| MWh | = | Megawatt-hour |
| TWh | = | Terawatt-hour |
| W/m2 | = | Watts/Meters Squared |
| Equations Terminology/Variables | = | |
| AhBES | = | Ampere-hours BES |
| CFHYB | = | Capacity Factor Hybrid |
| CFMHP | = | Capacity Factor MHP |
| CFMHP-HYB | = | Capacity Factor MHP-Hybrid |
| CFPV | = | Capacity Factor PV |
| CFPV-HYB | = | Capacity Factor PV-Hybrid |
| CMACVRE | = | Adj. Complementarity CM VRE |
| Cp | = | Co-efficient of Power |
| D | = | Days |
| DOD | = | Depth of Discharge |
| E | = | Energy |
| EL | = | Load |
| ELAvg | = | Average Load |
| ELCM | = | Critical Month Load |
| g | = | Specific gravity |
| Gref | = | Reference Irradiance |
| Gt | = | Solar Irradiance @ t |
| Hg | = | Gross Head |
| Hl | = | Head Loss |
| Hn | = | Net Head |
| Hni | = | Net Head Initial |
| m | = | Decision Variable PV |
| n | = | Decision Variable MHP |
| PHYB | = | Hybrid Power |
| PMHP | = | MHP Power |
| PPV | = | PV Power |
| PSHACCM | = | Adj. Compl. CM PSH |
| PSHYr | = | Yearly Peak Sun Hours |
| Pt | = | PV Power @ t |
| PVac | = | PV Power AC |
| Q | = | Flow |
| Qavg | = | Average Flow |
| QCM | = | CM Flow |
| QCMVRE | = | CM VRE Flow |
| Qd | = | Design Flow |
| Qhigh | = | Highest Flow |
| Qlow | = | Lowest Flow |
| QMHP | = | MHP Flow |
| QYr | = | Yearly Flow |
| SF | = | Safety Factor |
| Tref | = | Reference Temperature |
| Tsys | = | System Temperature |
| U | = | Union |
| V | = | BES Voltage |
| Xm | = | Decision Factor PV |
| Xn | = | Decision Factor MHP |
| YEHYB | = | Hybrid Yearly Energy |
| η | = | Efficiency |
| ηB | = | BES Efficiency |
| p | = | Water Density |
| Figures Terminology | = | |
| EB | = | BES System Energy (pink) |
| EHS | = | BES Hybrid System Energy (blue) |
| EL | = | Load Demand (red) |
| EMHP | = | MHP System Energy (gray) |
| EPV | = | PV System Energy (green) |
| ERE | = | Hybrid System Energy (yellow) |
| SB | = | BES System Status (maroon) |
Author contributions
Conceptualisation, I.M.S.; Methodology, I.M.S.; Validation, D.M.J. and I.M.S.; Formal analysis, I.M.S. and D.M.J; Investigation, D.M.J. and I.M.S.; Data curation, Y.M. and B.D.; Writing – original draft, I.M.S.; Writing – review & editing, Y.M. and B.D.; visualisation, I.M.S.; Supervision, I.M.S.; Funding acquisition, None. All authors have read and agreed to the published version of the manuscript.
Disclosure statement
No potential conflict of interest was reported by the author(s).
Data availability statement
The data that support the findings of this paper are available from the corresponding author upon reasonable request.
Additional information
Funding
Notes on contributors
Dawar M. Jahangir
Mr. Muhammad Dawar Jahangir (Research Scholar NUCES) is an electrical engineer specializing in renewable energies at Velosi Engineering UAE. He showcases the company’s forward-thinking approach within the oil and gas sector, embracing sustainable solutions for energy production and consumption adopting environmentally friendly practices.
Irtaza M. Syed
Irtaza Mohammad Syed is a Manager of Electrical Engineering at RRC Power & Energy (Texas, USA). Dr. Syed has modeled, designed, procured, managed, installed and commissioned 1000’s of Megawatts of diesel, PV, wind, micro-hydro and microgrid systems in North America and Asia. The systems include off-grid, on-grid, and microgrids with battery energy storage systems ranging from a few kW to 100’s of MW. Dr. Syed has also published number of articles in high impact journals. He earned his PhD from Toronto Metropolitan University, Toronto, Canada.
Yi Meng
Yi Meng is a V.P. of Engineering at RRC Power & Energy (Texas, USA). He is a licensed Professional Engineer in Canada and has contributed to the engineering for many utility scale Substation, Solar and Battery storage projects across North America.
Benjamin Davis
Benjamin Michael Davis is a Senior Director of Electrical Engineering at RRC Power & Energy (Texas, USA). He is a licensed Professional Engineer in 12 U.S. states and has contributed to the engineering for several dozen utility scale Wind, Solar and Battery storage projects across North America.
References
- Alturki, F. A., and E. M. Awwad. 2021. “Sizing and Cost Minimization of Standalone Hybrid Wt/pv/biomass/pump-Hydro Storage-Based Energy Systems.” Energies 14 (2): 489. https://doi.org/10.3390/en14020489.
- Bedadil, L. A., and M. G. GebreMichael. 2021. “Design and Optimization of Off-Grid Hybrid Renewable Power Plant with Storage System for Rural Area in Rwanda.” IET Renewable Power Generation 15 (15): 3715–3731. https://doi.org/10.1049/rpg2.12267.
- Beltran, H., R. Vidal, L. Basiero, J. M. Santos, J. A. Basiero, and E. Belenguer. 2014. “Micro Hydro Installation Analysis in a Wastewater Treatment Plant.” In International Conference on Renewable Energies and Power Quality. Vol. 1. Spain: Renewable Energy and Power Quality Journal. https://doi.org/10.24084/repqj12.207.
- Beluco, A., P. K. de Souza, and A. Krenzinger. 2008. “A Dimensionless Index Evaluating the Time Complementarity Between Solar and Hydraulic Energies.” Renewable Energy 33 (10): 2157–2165. https://doi.org/10.1016/j.renene.2008.01.019.
- Beluco, A., P. K. de Souza, and A. Krenzinger. 2012. “A Method to Evaluate the Effect of Complementarity in Time Between Hydro and Solar Energy on the Performance of Hybrid Hydro PV Generating Plants.” Renewable Energy 45. https://doi.org/10.1016/j.renene.2012.01.096.
- Beluco, A., A. Risso, and F. A. Canalesc. 2019. “Simplified Evaluation of Energetic Complementarity Based on Monthly Average Data.” Method Article 6:1194–1198. https://doi.org/10.1016/j.mex.2019.05.019.
- Bhandari, B., K. Lee, C. S. Lee, C. K. Somg, R. K. Maskey, and S. Ahn. 2014. “A Novel Off-Grid Hybrid Power System Comprised of Solar Photovoltaic, Wind, and Hydro Energy Sources.” Applied Energy 133:236–242. https://doi.org/10.1016/j.apenergy.2014.07.033.
- Blum, N. U., R. S. Wakeling, and T. S. Schmidt. 2013. “Rural Electrification Through Village Grids—Assessing the Cost Competitiveness of Isolated Renewable Energy Technologies in Indonesia.” Renewable and Sustainable Energy Reviews 22:482–496. https://doi.org/10.1016/j.rser.2013.01.049.
- Couto, A., and A. Estanqueiro. 2020. “Exploring Wind and Solar PV Generation Complementarity to Meet Electricity Demand.” Energies 13 (16): 4132. https://doi.org/10.3390/en13164132.
- Dursun, M., and M. F. Saltuk. 2017. “A Case Study of SHE (Solar-Hydroelectric) in Turkey.” The Online Journal of Science and Technology 7 (1): 1–7. https://www.tojsat.net/journals/tojsat/articles/v07i01/v07i01-01.pdf.
- Elbatran, A. H., O. B. Yaakob, Y. M. Ahmed, and H. M. Shabara. 2015. “Operation, Performance and Economic Analysis of Low Head Micro-Hydro Power Turbines for Rural and Remote Areas: A Review.” Renewable and Sustainable Energy Reviews 43:40–50. https://doi.org/10.1016/j.rser.2014.11.045.
- Han, S., L. Zhang, Y. Liu, H. Zhang, J. Yan, L. Li, X. Lei, and X. Wang. 2019. “Quantitative Evaluation Method for the Complementarity of Wind–Solar–Hydro Power and Optimization of Wind–Solar Ratio.” Applied Energy 236:973–984. https://doi.org/10.1016/j.apenergy.2018.12.059.
- Holand River Hydrometric Data, Government of Canada. 2023. Accessed September, 2023. https://wateroffice.ec.gc.ca/mainmenu/real_time_data_index_e.html.
- Homer Pro. 2024. Accessed April, 2024. https://homerenergy.com/products/pro/index.html.
- Hoq, T., N. U. Allaha, N. Islam, I. Sina, K. Syfullah, and R. Rahman. 2011. “Micro Hydro Power: Promising Solution for Off-Grid Renewable Energy Source.” International Journal of Scientific & Engineering Research 2 (12): 1–5.
- Hoseinzadeh, S., M. H. Ghasemi, and S. Heyns. 2020. “Application of Hybrid Systems in Solution of Low Power Generation at Hot Seasons for Micro Hydro Systems.” Renewable Energy 160:323–332. https://doi.org/10.1016/j.renene.2020.06.149.
- International Finance Corporation, World Bank. 2024. “A Solar Developer’s Guide to Pakistan.” Accessed April, 2024. http://www.ifc.org.
- Iweh, C. D., and E. R. Akupan. 2023. “Control and Optimization of a Hybrid Solar PV–Hydropower System for Off-Grid Applications Using Particle Swarm Optimization (PSO) and Differential Evolution (DE).” Energy Reports 10:4253–4270. https://doi.org/10.1016/j.egyr.2023.10.080.
- Jurasz, J., A. Piasecki, W. Suwała, M. Dudek, J. Leszczyński, and S. Łopata. 2017. “A Simulation and Simple Optimization of a Wind-Solar-Hydro Micro Power Source with a Battery Bank As an Energy Storage Device.” Energy and Fuels 14:01017. https://doi.org/10.1051/e3sconf/20171401017.
- Kenfack, J., F. Neirac, T. Tatietse, D. Mayer, M. Fogue, and A. Lejeune. 2009. “Microhydro-PV-Hybrid System: Sizing a Small Hydro-PV-Hybrid System for Rural Electrification in Developing Countries.” Renewable Energy 34 (10): 2259–2263. https://doi.org/10.1016/j.renene.2008.12.038.
- Klima, K., J. Apt, M. Bandi, P. Happy, C. Loutan, and R. Young. 2018. “Geographic Smoothing of Solar Photovoltaic Electric Power Production in the Western USA.” Journal of Renewable and Sustainable Energy 10 (5). https://doi.org/10.1063/1.5038028.
- Kougias, I., S. Szabó, F. Monforti-Ferrario, T. Huld, and K. Bódis. 2016. “A Methodology for Optimization of the Complementarity Between Small-Hydropower Plants and Solar PV Systems.” Renewable Energy 87:1023–1030. https://doi.org/10.1016/j.renene.2015.09.073.
- McDonald, M., L. Dilley, M. E. Barber, R. Mahler, J. Adam, M. Wolcott, and A. Ford. 2013. “Small-Scale Energy Storage for Integration of Renewable Supplies with Smart Grids.” WIT Transactions on Ecology and the Environment 176:3–13. http://doi.org/10.2495/ESUS130031.
- Meshram, S., G. Agnihotri, and S. Gupta. 2013. “Performance Analysis of Grid Integrated Hydro and Solar Based Hybrid Systems.” Advances in Power Electronics 2013:1–7. https://doi.org/10.1155/2013/697049.
- Monforti, F., T. Huld, K. Bódis, L. Vitali, M. D’Isidoro, and R. Lacal-Arántegui. 2014. “Assessing Complementarity of Wind and Solar Resources for Energy Production in Italy. A Monte Carlo Approach.” Renewable Energy 63:576–586. https://doi.org/10.1016/j.renene.2013.10.028.
- Mostofi, F., and M. Safavi. 2013. “Application of ABC Algorithm for Grid-Independent Hybrid Hydro/Photovoltaic/Wind/Fuel Cell Power Generation System Considering Cost and Reliability.” International Journal Renewable Energy Research 3 (4): 928–940. https://doi.org/10.20508/ijrer.v3i4.929.g6235.
- Neupane, D., S. Kafle, S. Gurung, S. Neupane, and N. Bhattarai. 2021. “Optimal Sizing and Financial Analysis of a Stand-Alone SPV-Micro-Hydropower Hybrid System Considering Generation Uncertainty.” International Journal of Low-Carbon Technologies 16 (4): 1479–1491. https://doi.org/10.1093/ijlct/ctab077.
- New, D. 2024. “Intro to Hydropower Part 2: Measuring Head & Flow.” Accessed April, 2024. https://www.homepower.com/articles/microhydro-power/design-installation/intro-hydropower-part-2.
- Niringiyimana, E., S. WanQuan, G. Dushimimana, and J. Szmytkowski. 2022. “Feasibility Study of a Hybrid PV/Hydro System for Remote Area Electrification in Rwanda.” Journal of Renewable Energy 2022:1–11. https://doi.org/10.1155/2022/4030369.
- Oladigbolu, J. O., M. A. M. Ramli, and Y. A. Al-Turki. 2020. “Optimal Design of a Hybrid PV Solar/micro-Hydro/diesel/battery Energy System for a Remote Rural Village Under Tropical Climate Conditions.” Electronics 9 (9): 1491. https://doi.org/10.3390/electronics9091491.
- Optimal Tilt of Solar Panels. 2024, April. http://www.solarpaneltilt.com/.
- The Paris Agreement, United Nations Framework Convention on Climate Change. Accessed April, 2024. http://unfccc.int/paris_agreement/items/9485.php.
- Prilliman, M. J., C. W. Hansen, J. M. F. Keith, S. Janzou, M. Theristis, A. Scheiner, and E. Ozakyol. 2024. “Quantifying Uncertainty in PV Energy Estimates Final Report.” National Renewable Energy Laboratory. https://www.nrel.gov/docs/fy23osti/84993.pdf.
- PVWatts Calculator, PV systems sizing software. Accessed September, 2023. http://pvwatts.nrel.gov/pvwatts.php.
- Razan, J. I., R. S. Islam, R. Hasan, S. Hasan, and F. Islam. 2012. “A Comprehensive Study of Micro-Hydropower Plant and Its Potential in Bangladesh.” International Scholarly Research Network, Renewable Energy 2012:1–10. https://doi.org/10.5402/2012/635396.
- Renewable Energy Benefits: Understanding the Socioeconomics, IRENA. 2017. Accessed April, 2024. https://www.irena.org/-/media/Files/IRENA/Agency/Publication/2017/Nov/IRENA_Understanding_Socio_Economics_2017.pdf.
- Santos-Alamillos, F. J., D. Pozo-Vázquez, J. Ruiz-Arias, L. Von Bremen, and J. Tovar-Pescador. 2015. “Combining Wind Farms with Concentrating Solar Plants to Provide Stable Renewable Power.” Renewable Energy 76:539–550. https://doi.org/10.1016/j.renene.2014.11.055.
- Shakya, B., A. Bruce, and I. MacGill. 2015. “Micro Hydro Interconnected Mini Grids in Nepal: Potential and Pitfalls.” Asia-Pacific Solar Research Conference. https://catalog.ihsn.org/citations/82128.
- Syahputra, R., and I. Soesanti. 2020. “Planning of Hybrid Micro-Hydro and Solar Photovoltaic Systems for Rural Areas of Central Java, Indonesia.” Journal of Electrical and Computer Engineering 2020:1–16. https://doi.org/10.1155/2020/5972342.
- Syed, I. M. 2017. “Near-Optimal Standalone Hybrid PV/WE System Sizing Method.” Solar Energy 157:727–734. https://doi.org/10.1016/j.solener.2017.08.085.
- Teixeira, L. E., J. Caux, A. Beluco, I. Bertoldo, J. A. S. Louzada, and R. C. Eifler. 2015. “Feasibility Study of a Hydro PV Hybrid System Operating at a Dam for Water Supply in Southern Brazil.” Journal of Power and Energy Engineering 3 (9): 70–83. https://doi.org/10.4236/jpee.2015.39006.
- Types of Hydropower Plants. Accessed April, 2024. https://energy.gov/eere/water/types-hydropower-plants.
- Umar, M., and A. Hussain. 2014. ““Micro Hydro Power: A Source of Sustainable Energy in Rural Communities: Economic and Environmental Perspectives.” 30th AGM and Conference 54 (4): 487–505. Pakistan: The Pakistan Society of Development Economists. https://file.pide.org.pk/pdf/PDR/2015/Volume4/487-505.pdf.
- Yan, J., T. Qu, S. Han, Y. Liu, X. Lei, and H. Wang. 2020. “Reviews on Characteristic of Renewables: Evaluating the Variability and Complementarity.” International Transactions on Electrical Energy Systems 30 (7). https://doi.org/10.1002/2050-7038.12281.
- Zhang, X., G. Ma, W. Huang, S. Chen, and S. Zhang. 2018. “Short-Term Optimal Operation of a Wind-PV-Hydro Complementary Installation: Yalong River, Sichuan Province, China.” Energies 11 (4): 868. https://doi.org/10.3390/en11040868.