
ABSTRACT
MBS301, a glyco-engineered bispecific anti-human epidermal growth factor receptor 2 (HER2) antibody with a typical IgG1 monoclonal antibody structure, was developed through dual-cell expression and in vitro assembling process. MBS301 consists of two half antibodies engineered from trastuzumab and pertuzumab, respectively. Integrity and purity profiles of MB301 indicated that the heterodimerization of the two half antibodies was successful. The high and similar melting temperatures (Tm1,72.0°C and Tm2, 84.8°C) of MBS301 compared with those of its parental monoclonal antibodies trastuzumab and pertuzumab (in-house made T-mab and P-mab, respectively) revealed its structural compactness. With computer-modeling experiments and Biacore binding and competition kinetics studies, the binding stoichiometry between MBS301 and HER2-ECD was determined to be 1:1 and the two arms of MBS301 were shown to bind to domains II and IV of HER2-ECD antigen simultaneously. MBS301 displayed synergistic bioactivities as the combination of T-mab and P-mab in vitro in multiple cancer cell lines and in vivo in xenograft mouse model studies, and showed more effective activity than T-mab or P-mab used individually. Moreover, fucose-knockout dramatically increased MBS301’s binding affinity to low affinity FcγRIIIa allotype 158F (KD = 2.35 × 10⁻⁷M) to near the high affinity level of allotype V158 (KD = 1.17 × 10⁻⁷M). This resulted in far more effective ADCC activity of MBS301 than the combination of T-mab and P-mab in killing HER2-positive cancer cells. Hence, a novel fully afucosylated anti-HER2 bispecific antibody with improved antitumor activities was generated and shown to have the potential to be used for treating HER2-positive but trastuzumab-resistant solid tumors.
Introduction
Human epidermal growth factor receptor 2 (HER2) is a receptor tyrosine kinase, encoded by ERBB2 gene. Overexpression of HER2 gene is found in about 20–30% breast cancer, and it is associated with aggressive growth and poor clinical outcomes.Citation1 Overexpression of HER2 may also be observed in other tumors such as ovary, endometrium, bladder, lung, colon, and head-neck tumors.Citation1 In breast cancer, HER2 is commonly recognized as a predictive factor and a therapeutic target. Since HER2 has no specific ligand, its antibodies usually inhibit tumor cells by blocking dimerization and activation of the receptor and mediating killing effect of immune system.Citation2,Citation3
Trastuzumab and pertuzumab are commercially available HER2-targeted therapeutic antibodies. In 1998, the US Food and Drug Administration (FDA) approved trastuzumab (HERCEPTIN®; Genentech Inc.), which recognizes HER2 extracellular domain IV epitope. The mechanisms of action of trastuzumab may include: antibody dependent cell-mediated cytotoxicity (ADCC) and cell proliferation inhibition activity, inducing the internalization of HER2, modulating the PI3K pathway, stimulating cancer cell apoptosis and inhibiting the activation of intracellular p95 domain of the extracellular domain of the receptor.Citation4 Trastuzumab is currently used as a first-line drug for treatment of breast cancer, but it has limited utility in treating metastatic breast cancer with lower HER2 expression, and resistance has developed within 1 year in a number of patients for whom the antibody is initially effective.Citation4–Citation6 Pertuzumab (PERJETA®), approved by FDA as adjuvant treatment with trastuzumab for marketing in USA in 2012, binds to the domain II on HER2 and prevents ligand-driven pairing of HER2 with other HER receptors.Citation7
The combination of pertuzumab and trastuzumab is more effective than one antibody alone.Citation8 Their mechanisms of action are complementary, providing broader blockade of the HER2-positive tumor cell proliferation and survival signaling.Citation9 The CLEOPATRA clinical trial showed that patients with metastatic HER2-positive breast cancer treated with combination of pertuzumab and trastuzumab plus docetaxel significantly prolonged progression-free survival,Citation10 and simultaneous blockade of HER2 by trastuzumab and pertuzumab may overcome trastuzumab-resistance.Citation11
Both trastuzumab and pertuzumab have classical IgG1 architecture with N-glycan-modified Fc regions, and their biologic activities include ADCC, antibody-dependent cellular phagocytosis (ADCP) and complement dependent cytotoxicity (CDC). However, most therapeutic IgG1 antibodies currently on the market are heavily fucosylated because they are produced by mammalian cell lines such as Chinese hamster ovary (CHO) cells, which have intrinsic enzyme activity responsible for the core-fucosylation of the Fc N-glycans. The antibodies’ ADCC activity is effective for patients with the high affinity V158 allotype of FcγRIIIa on their natural killer (NK) cells.Citation12
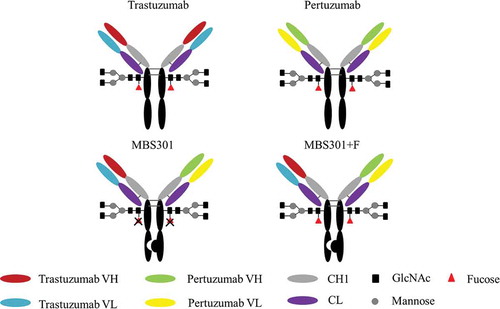
Here, we describe a bispecific anti-HER2 antibody MBS301 designed to achieve the following goals: retention of the synergistic effect of combination use of trastuzumab and pertuzumab, and enhancement of ADCC via glyco-engineering of the Fc N-glycan. As shown in , the knobs-into-holes techniqueCitation13 was used for heterodimerizing the heavy chains of trastuzumab and pertuzumab in this molecular design. A knob variant called MBS301-knob was obtained by replacing a small amino acid with a larger one, T366W, in pertuzumab as the first half arm of MBS301. A hole mutant called MBS301-hole was created as the second half arm by exchanging residues T366S, L368A and Y407V on the heavy chain CH3 domain of trastuzumab. Both mutants were manufactured separately in glyco-engineered stable CHO cell lines to achieve complete afucosylation. A typical IgG1 structure modality was obtained for the bispecific antibody when the afucosylated MBS301-hole and MBS301-knob were assembled together in vitro. From 3-dimentional (3-D) structure computer modeling study to in vitro cancer cell killing and in vivo animal model efficacy studies, solid evidences have been obtained in support of the conclusion that the molecule design goals have been achieved. The evaluation of MBS301 in clinical trials of HER2-positive breast and stomach cancer patients is expected to take place in the near future.
Figure 1. Schematic description of the molecular structure of MBS301 and MBS301 + F.
Results
Manufacturing and analytical characterization of MBS301
Since its invention in 1998 by Carter et al, the knobs-into-holes technique has been adopted and evolved into several different IgG1-like bispecific antibody formats.Citation14 To overcome the light chain exchange problem, which often happens when the two arms of a bispecific antibody are co-expressed in one cell line, techniques such as common light chain,Citation13 CrossmabCitation13 and additional knob-into-hole between heavy and light chains of both armsCitation15 have been introduced. We used a different approach to manufacture our bispecific anti-HER2 antibody: expressing the two arms (half antibodies), namely MBS301-hole and MBS301-knob, in two separate fucose-knockout host CHO cell lines, followed by assembling them together to produce the integrated MBS301.
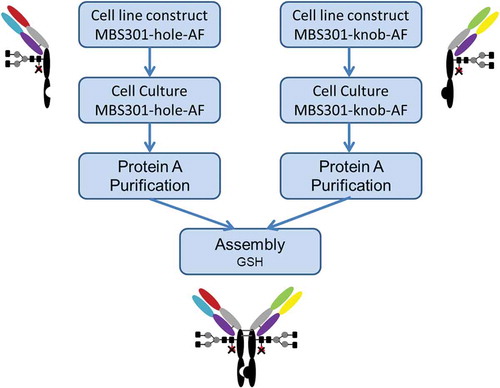
The fucose-knockout host cell line CHOK1-AF was constructed using a zinc-finger nuclease technique to site-specifically remove the GFT (GDP-fucose transporter) gene SLC35c1 sequence.Citation16 As shown in , two separate cell lines were constructed by transfecting MBS301-hole and MBS301-knob vector into the CHOK1-AF host cell line to obtain MBS301-hole-AF and MBS301-knob-AF cell lines, respectively. A typical 14-day fed-batch cell culture process was developed for both half antibodies. After the Protein-A purification step, the two half antibodies were mixed together in 1:1 molar ratio, adjusted with Tris Base buffer solution to pH8.0, added with an amount of the reducing agent glutathione (GSH), reacted at 25°C and low speed stirring overnight. The reducing agent was removed by using a desalting column (or ultrafiltration), and the reaction was terminated. After two steps of ionic exchange chromatographic purification procedures, the obtained MBS301 antibody was formulated into histidine chloride-containing buffer, pH6.0. The overall yield was higher than 70%. The formulated MBS301 was used for the following analytical and biological characterization studies.
Figure 2. Schematic description of the manufacturing process of MBS301.
As shown in , the molecular mass of deglycosylated MBS301 was detected to be 145,152 Da, which is consistent with its theoretical molecular mass of 145,147 Da (34 ppm) within the determination error of 50 ppm of the Triple-TOF® mass spectrometer. The theoretical molecular masses of deglycosylated homodimer of MBS301-hole and MBS301-knob were calculated to be 144,926 and 145,367 Da, respectively, which were not detected at all in the mass spectrometry experiments. The result demonstrated that the purified MBS301 sample did not contain any half antibody homodimers. A shoulder peak on the left side of the main peak was determined to have a molecular mass of 145,096 Da, which is 56 Da less than the molecular mass of deglycosylated MBS301; this peak was assigned as deglycosylated MBS301 with a C-terminal proline amidation on heavy chain.Citation17 A small peak on the right side of the main peak was determined to be 145,309 Da, which is 157 Da addition to the determined mass of deglycosylated MBS301; this was postulated to be from trace levels of glycation modification of MBS301 on multiple lysine residues. To assess the glycosylation pattern of MBS301, the N-linked oligosaccharides enzymatic released from MBS301 and MBS301 + F (a fucosylated version of MBS301) via PNGase F treatment were labeled with 2-aminobenzamide (2-AB) and analyzed using hydrophilic interaction liquid chromatography (HILIC). As shown in , in total, less than 1% of the detected glycan species of MBS301 contained fucose. The structures of the oligosaccharides were confirmed to be G0-GN, G0, G1/G1ʹ, G2, G2S1 and G2S2 by LC-MS/MS characterization of the enzymatically released N-oligosaccharides with 2-AB tag (data not shown). Correspondingly, the N-oligosaccharides released from MBS301 + F, which was produced in a similar way to MBS301 with the only difference being that two separate CHOK1 cell lines were used to express MBS301 + F-hole and MBS301 + F-knob half antibodies, were determined to be in a similar pattern, with each glycan having a corresponding fucose unit on it ().
Figure 3. Analytical characterization of MBS301. (a). Intact mass analysis of deglycosylated MBS301; (b). HILIC analysis of the PNGase F enzymatically released N-glycans from MBS301 + F and MBS301, respectively; (c). Hydrophobic-interaction chromatography analysis of MBS301, MBS301-hole and MBS301-knob, respectively; (d). DSC comparative analysis of MBS301, T-mab, and P-mab, respectively, in the same formulation buffer.
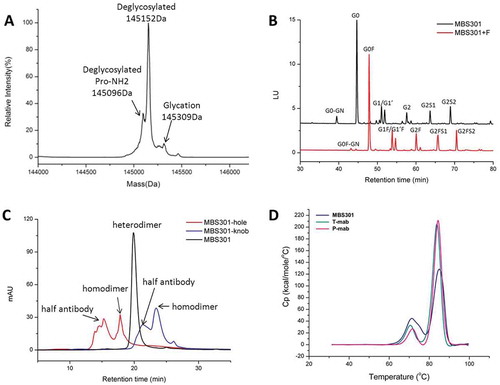
A hydrophobic-interaction chromatography (HIC) assay was developed to monitor the levels of homodimers or half antibodies of MBS301-hole and MBS301-knob. As shown in , intact MBS301, which is a heterodimer of MBS301-hole and MBS301-knob, eluted at 20.1 min, and the homodimers of MBS301-hole and MBS301-knob eluted at 17.9 and 23.5 min, respectively, on HIC. The half antibodies of MBS301-hole and MBS301-knob were eluted at 15.3 and 21.3 min, respectively. There is a tiny peak with unknown identity at ca 25 min on the chromatogram of MBS301 (); its peak area percentage is less than 0.5%, indicating that if there is any homodimer impurity present in the MBS301 sample, the content of successfully assembled bispecific antibody MBS301 is higher than 99.5%.
The thermal stability of MBS301 was tested using a differential scanning calorimeter instrument and compared with T-mab and P-mab in the same formulation buffer. As displayed in , the Tm1 values of MBS301, T-mab and P-mab were determined to be 72.0°C, 70.4°C and 71.68°C, respectively; the Tm2 values of the molecules were 84.81°C, 83.63°C and 84.32°C, respectively. This indicates that the assembled bispecific antibody MBS301 is as stable as the traditional IgG1 antibodies of T-mab and P-mab that were manufactured following a typical CHOK1 expression and three chromatographic purification steps.
The two arms of MBS301 binding to HER2 domains II and IV simultaneously
We evaluated the affinity of MBS301 binding towards human HER2-ECD in comparison with T-mab, P-mab, and the combination of T-mab and P-mab (1:1) using the Biacore technique. As shown in , the KD value of MBS301 was determined to be 3.93 × 10⁻¹⁰M, superior to that of P-mab (11.74 × 10⁻¹⁰M), and slightly better than T-mab (5.80 × 10⁻¹⁰M) and the (T-mab+ P-mab) mixture (4.81 × 10⁻¹⁰M), respectively.
Table 1. The affinities of anti-HER2 antibodies binding to human HER2-ECD.
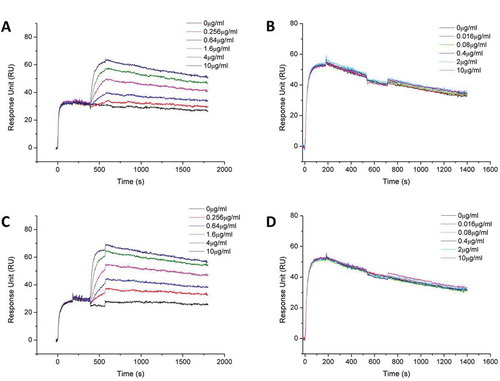
To verify if the two arms of bispecific MBS301 can bind to the domains II and IV of HER2 simultaneously, a series of Biacore competitive binding kinetic studies were performed. As shown in , when HER2-ECD was bound and saturated with T-mab, MBS301 was still able to bind to the antigen, but with a lower affinity (5.96 × 10⁻¹⁰M) than the affinity (3.93 × 10⁻¹⁰M) that was determined individually with MBS301 directly binding to HER2-ECD. The determined affinity value of MBS301 (5.96 × 10⁻¹⁰M) in the presence of T-mab was slightly higher than that of the T-mab (5.80 × 10⁻¹⁰M). However, when HER2-ECD was bound and saturated with MBS301 first, T-mab was no longer able to bind to the antigen, as displayed in , indicating that the domain IV of HER2-ECD was already occupied by MBS301. Likewise, MBS301 was found to be able to bind to the HER2-ECD after the antigen was bound and saturated with P-mab (). The affinity of MBS301 binding to HER2-ECD in the presence of a saturated concentration of P-mab was determined to be 3.64 × 10⁻¹⁰M, superior to that of T-mab binding to HER2-ECD (5.80 × 10⁻¹⁰M). P-mab was not able to bind to the HER2-ECD after the antigen was bound and saturated with MBS301 (), indicating that the domain II of HER2-ECD was already occupied by MBS301. When HER2-ECD was bound and saturated with MBS301, the addition of the 1:1 mixture of T-mab and P-mab was not able to bind to the antigen either (data not shown). These data indicated that the epitopes of HER2-ECD bound by MBS301 were the same as T-mab and P-mab, and MBS301 could bind to domain II and IV of HER2-EDC simultaneously.
Figure 4. Biacore binding kinetic study of MBS301 to HER2 in competition with T-mab, P-mab, respectively. (a). 10 μg/ml T-mab was followed by co-injection of HER2-ECD-His on CM5 Chip, then followed by serially diluted MBS301. (b). 10 μg/ml MBS301 was followed by co-injection of HER2-ECD-His on CM5 Chip, then followed by serially diluted T-mab. (c). 10 μg/ml P-mab was followed by co-injection of HER2-ECD-His on CM5 Chip, then followed by serially diluted MBS301. (d). 10 μg/ml MBS301 was followed by co-injection of HER2-ECD-His on CM5 Chip, then followed by serially diluted P-mab.
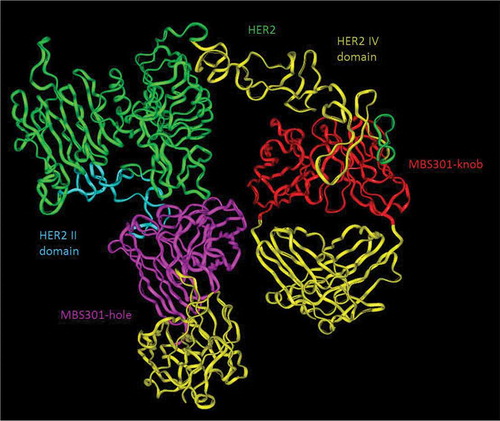
Based on the computer-guided homology modeling and docking method, the 3-D complex structures of HER2 and MBS301-knob, HER2 and MBS301-hole, and HER2 and bispecific antibody MBS301 were constructed. As displayed in , the two arms of MBS301 were found to be bound to the domains II and IV of HER2 simultaneously. The binding stoichiometry between MBS301 and HER2-ECD was found to be one to one; the MBS301-hole arm binds to the domain IV of HER2-ECD and the MBS301-knob arm binds to the domain II of the same HER2 antigen. The binding epitope did not change and a steric hindrance effect was not present. The binding energy was calculated according to the van der Waals interaction and electronic interaction. Under CVFF force field, the binding energy between HER2 and MBS301-knob was −239.48 kCal/mol, and that between HER2 and MBS301-knob was −153.846 kCal/mol, while the binding energy between bispecific antibody MBS301 and HER2 was −337.46 kcal/mol. The theoretical results showed that the complex of MBS301 and HER2 was more stable than its parent antibody (trastuzumab or pertuzumab) with HER2. The binding activity between MBS301 and HER2 was thus better than the half antibody MBS301-hole and MBS301-knob.
Figure 5. Computer modeling of MBS301 and the simultaneous binding of its two arms to human HER2 II and IV domains. The blue ribbon denoted HER2 II domain, and the olive green ribbon denoted HER2 IV domain, the pink ribbon denoted VH and VL of the MBS301-hole arm, and the red ribbon denoted VH and VL of MBS301-knob arm, the yellow ribbon denoted CH1 and CL of MBS301. Other parts were constructed and modeled but not displayed.
MBS301 strongly inhibits HER2-positive cancer cell proliferation
The synergistic cytotoxicity effect on HER2-positive cancer cells, which may have resulted from the simultaneous binding of two arms of MBS301 to the two different domains of HER2, was tested. Using breast cancer cells BT474, MDA-MB-175VII, SK-BR-3 and HCC1419, and gastric cancer cells NCI-N87 as the target cells, MBS301’s in vitro cytotoxicity was compared with that of T-mab, P-mab, as well as the combination of T-mab and P-mab. The HER2 expression levels of the five cancer cell lines were assessed utilizing SDS-PAGE and Western blotting analyses of the cell lysates. Except for MDA-MB-175VII, which has low expression, others all have high and similar expression levels (data not shown). As displayed in , all the cell lines responded to antibodies’ treatment, but with different sensitivities and inhibition rates.
Figure 6. In vitro tumor cell proliferation inhibition evaluation. (a,b,c,d,e). Tumor cell proliferation inhibition by treating with the anti-HER2 antibodies T-mab, P-mab, combination of T-mab and P-mab (T-mab + P-mab), and MBS301, respectively, at a series of diluted concentrations from 100 to 0.0015 μg/ml on HER2+ cells BT474, MDA-MB-175VII, NCI-N87, SK-BR-3 and HCC1419. (F). The inhibition rates of the anti-HER2 antibodies on different HER2+ cancer cell lines that were calculated at the highest concentration of 100 μg/ml when a steady plateau was reached for each assay. *P < 0.0001 by one-way ANOVA analyses for the inhibition rate difference for the three cancer cell lines.
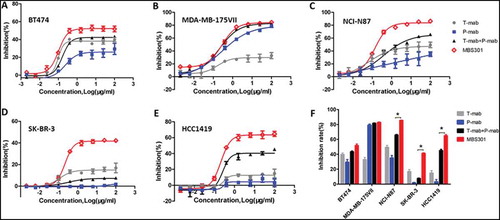
The five panels (A-E) in show the cell proliferation inhibition curves of the four anti-HER2 antibody treatments against the five HER2-positive cancer cell lines, respectively. The calculated inhibition rate for each curve was grouped for each cancer cell line and displayed in as a bar graph. The inhibition rate of MBS301 (51.8%) to BT474 cells, which was sensitive to trastuzumab, was higher than that of T-mab (39.7%) and the combination of T-mab and P-mab (43.0%) (). The inhibition rate of MBS301 (82.8%) to MDA-MB-175VII cells, which was sensitive to pertuzumab, was similar to that of P-mab (79.0%) and the combination of T-mab and P-mab (81.6%)(). In gastric cancer cell NCI-N87 (), breast cancer cells SK-BR-3 () and trastuzumab-resistant breast cancer cell line HCC1419 (), P-mab displayed the lowest inhibition with blue solid square curves and MBS301 showed the highest inhibition with red open diamond curve among the four anti-HER2 antibody treatments. It is noted that, as shown in , the combination of T-mab and P-mab (45.1% inhibition rate) is more effective than T-mab (14.9%) or P-mab (3.1%) alone in inhibiting the proliferation of trastuzumab-resistant breast cancer cell line HCC1419, MBS301 is the best inhibitor as its inhibition rate was the highest (64.7%). As shown in , according to statistical analysis, MBS301’s inhibition rate is significantly superior to that of the combination of T-mab and P-mab on respective NCI-N87 (19.6% greater), SK-BR-3 (33.6% greater), and HCC1419 (19.6% greater) (P < 0.0001 by one-way ANOVA statistical analysis).
MBS301 exhibits increased affinity towards FcγRIIIa (V158 and F158) allotypes and enhanced ADCC
The two human FcγRIIIa (V158 and F158) allotypes have different affinities towards IgG1 antibodies with typical N-glycan modification, with higher affinity allotype V158 having the dissociation constant KD = 3.11 × 10⁻⁷M, 5-fold less than that of lower affinity F158 allotype (16.29 × 10⁻⁷M) in binding to T-mab. As shown in , MBS301 was determined to have the lowest KD value (1.17 × 10⁻⁷M), 2.7- to 7-fold less than the values determined for either T-mab, P-mab, MBS301 + F or the combination of T-mab and P-mab. The KD value of MBS301 binding to human FcγRIIIa F158 allotype was determined to be 2.35 × 10⁻⁷M, 6.4- to 11.5-fold less than the values determined for others. This indicates that MBS301 had enhanced binding activity towards both higher and lower affinity FcγRIIIa allotypes (V158 and F158), with a more significant increase for the lower affinity one.
Table 2. The affinities of anti-HER2 antibodies binding to human FcγRIIIa allotypes.
The ADCC activities of T-mab, P-mab, the combination of T-mab and P-mab, MBS301 + F and MBS301 in four HER2-positive target cells were evaluated. As shown in , the ADCC activity EC50 value of MBS301 to colon cancer cell line SW480 was 2.0 × 10⁻³μg/ml, 7- to 17-fold less than those EC50 values for either T-mab, or P-mab, or MBS301 + F, or the combination of T-mab and P-mab; the EC50 value of MBS301 to ovarian cancer cell line SK-OV-3 was 0.2 × 10⁻³μg/ml, 4.5-to 50-fold less than the EC50 values for either T-mab, P-mab, the combination of T-mab and P-mab, and MBS301 + F. In the breast cancer cell lines BT474 and HCC1419, the ADCC activity EC50 values of MBS301 were 0.5 × 10⁻³μg/ml and 8.0 × 10⁻³μg/ml, slightly superior to others, but the special lysis rates of MBS301 were higher than other antibodies (data not shown). The ADCC activities for different antibodies were consistent with the FcγRIIIa affinity, indicating that the ADCC activity of MBS301 was strongly enhanced.
Table 3. ADCC activity evaluation of anti-HER2 antibodies on four target cancer cells.
In vivo efficacy testing in mouse xenograft models
Nude mice bearing established BT-474 and NCI-N87 xenograft tumors were used to investigate the in vivo antitumor activities of T-mab, P-mab, the combination of T-mab and P-mab, MBS301 + F and MBS301; the negative control group was administrated the same volume of saline in the same way and dosage frequency. As shown in , both MBS301 + F and MBS301 exhibited remarkable antitumor activities against breast cancer BT474, the tumor inhibitions were 96.23% and 97.18% on Day-28 at 13.5 mg/kg dosage, respectively. MBS301 + F and MBS301 were more effective than T-mab and P-mab, and as effective as the combination of T-mab and P-mab (96.83%). In the NCI-N87 xenograft model (), the tumor inhibition of MBS301 was 100% on Day 28 at dosage of 13.5 mg/kg, which was more effective than T-mab, P-mab and MBS301 + F, and as effective as the combination of T-mab and P-mab (93.08%).
Figure 7. The in vivo therapeutic effect of MBS301 in comparison with other anti-HER2 mAb formats on different mouse xenograft models. (a) Mice with breast cancer BT-474 xenograft tumors were treated for four weeks with high dosage (13.5 mg/kg), vehicle normal saline, T-mab, P-mab, MBS301 + F, MBS301, combination of T-mab and P-mab (6.75 mg/kg each), respectively (n = 6 mice/group); (b) Mice with NCI-N87 xenograft tumors were treated for four weeks with high dosage (20 mg/kg), vehicle normal saline, T-mab, P-mab, MBS301 + F, MBS301, combination of T-mab and P-mab (10 mg/kg each), respectively (n = 6 mice/group); (c) The therapeutic effect of MBS301 in gastric cancer (NCI-N87) xenograft model in NSG-CD34 mice. Mice were treated 18 days of the study with high dosage (13.5 mg/kg), then the animals were monitored for tumor recurrence; vehicle normal saline, MBS301 + F, MBS301. (n = 6 mice/group).
In order to investigate the ADCC activity of MBS301 in vivo, we developed an NCI-N87 CDX model in humanized mice. Using an NK cell-specific antibody (anti-NKp46),Citation18 human NK cells were identified in peripheral blood, and the percentage of NK cell in reconstituted hu-CD34 NSG mouse was quantified to be 2.1–4.4%. As shown in , the efficacy of MBS301 + F was similar to that of MBS301 from 0 day to 18 days. The mean tumor volumes of mice treated with MBS301 + F and MBS301 were 42.9 ± 5.28 mm3 and 39.35 ± 11.46 mm3, respectively, on day 18; the tumor inhibition rates were 89.34% and 90.22%, respectively, indicating that no statistical significant difference was observed between the two groups. When the treatment was stopped on day 18, the tumor continued to shrink until day 28. After that, the tumor volume started to increase again. On day 51, the mean tumor volume of MBS301 + F and MBS301 were 175.07 ± 104.0 mm3 and 70.77 ± 33.24 mm3, respectively. Although there was no statistical significant difference between the two groups (P = 0.33, t-test), the average tumor volume of the MBS301 treatment arm is clearly smaller, indicating that afucosylation of MBS301 may prolong its tumor growth inhibition effect. In addition, three mice with complete response and tumor disappearance were observed in the MBS301 treatment group. In comparison, three mice with tumor recurrence and only one mouse with complete response were observed in the MBS301 + F treatment group.
Discussion
In recent years, multiple structural formats of bispecific antibodies have been developed for potential application in treating different diseases.Citation13 So far, two bispecific antibody therapeutics, blinatumomab by Amgen and emicizumab by Roche and Genentech, have been approved by US FDA for marketing. Unlike blinatumomab, which is a bispecific tandem single-chain variable fragment with a 2.11 hours average half life in humans (www.drugbank.ca/drugs/DB09052), native IgG1-like emicizumab presents a long half life of 27.8 to 34.4 days (www.drugbank.ca/drugs/DB13923). MBS301 was engineered and assembled via the knobs-into-holes technique to allow heterodimerization of the MBS301-knob and MBS301-hole half antibodies to form an intact mAb molecule. The dual-cell technologies used are able to avoid the HC and LC pairing problems which happen when the two half antibodies are co-expressed in a single-cell system. In this work, bispecific MBS301 was fully characterized and demonstrated to be a native IgG1-like molecule with high purity and integrity. As shown by the HILIC glycan analysis results (), the total fucose content from the N-glycan species of MBS301 was less than 1%, indicating that the in-house developed CHOK1-AF cell line was capable of producing antibodies with nearly complete afucosylation. Although there is a shift of the entire glycan peak region in comparison between that of MBS301 and MBS301 + F, MBS301 has the same N-glycan species distribution pattern as that of a typical recombinant IgG1 antibody. The monomeric antibody content of MBS301 was determined via SEC analysis to be higher than 99% (data not shown), and there was no detectable homodimer impurities from MBS301-hole or MBS301-knob, as shown by the HIC analysis results (), in which heterodimer of MBS301 was distinctly separated from the half antibodies and respective homodimers. The high similarity in thermal stability among bispecific MBS301 and T-mab and P-mab indicated that the covalent linkage between the two half antibodies by two hinge-region disulfide bonds and hydrophobic interaction by the knob-into-hole technique are stable.
As reported in a computer 3D-simulation modeling study by Fuentes et al, trastuzumab and pertuzumab can bind to HER2-ECD simultaneously.Citation19 In the computer modeling study in this work, the most stable binding stoichiometry between MBS301 and HER2-ECD was found to be one to one, MBS301-hole arm binds to domain IV while MBS301-knob arm binds to domain II of the same HER2-ECD antigen. The binding affinity of MBS301 towards human HER2-ECD was stronger than that of T-mab, P-mab or the combination of T-mab and P-mab. The in vitro and in vivo tumor proliferation inhibition studies demonstrated that MBS301’s efficacy was obviously superior to that of T-mab or P-mab used alone. We found that the in vitro growth of trastuzumab-resistant HCC1419 cells was not affected by the addition of T-mab or P-mab alone;Citation20 however, growth was inhibited by the treatment with MBS301 or the combination of T-mab and P-mab. In MDA-MB-175VII, a HER2 low expression (HER2 oncoprotein 1+) breast cancer cell line,Citation21 the inhibition rate by MBS301 was 82.8%, slightly higher than others. These results suggested that MBS301 could be used to treat trastuzumab-resistant and HER2 low expressing patients.
IgG Fc receptor polymorphisms influence clinical efficacy of trastuzumab-based therapy in patients with HER2-positive metastatic breast cancer.Citation12 Activatory Fc receptors such as FcγRIIIa(158V/158F) are expressed on NK cells. Activation of ADCC has been described as a major mechanism of action of trastuzumab and pertuzumab. During clinical study of trastuzumab, a significant difference in the objective response rate was observed between patients with FcγRIIIa 158 V/V and patients with either 158V/F or 158 F/F genotype (82% v 42% v 35%, respectively; P = 0.03).Citation12 It is estimated that 15–20% of patients express FcγRIIIa that has a higher-affinity FcγRIIIa(158V) allotype. Such patients seemed to gain greater benefit from Herceptin® treatment than the 80–85% of the HER2-positive patients that have the lower binding form of FcγRIIIa(158F).Citation22 As displayed in , the affinity of MBS301 towards the 158F containing FcγRIIIa, was increased significantly, to a level almost the same as the affinity for FcγRIIIa with higher affinity 158V allotype, suggesting that the objective response rate of patients with 158V/F or 158 F/F genotype could been enhanced by MBS301-based therapy.
In our in vivo animal xenograft model studies, enhanced ADCC activity of MBS301 was not clearly observed as the combination of T-mab and P-mab, MBS301 + F and MBS301 exhibited similar inhibition of tumor growth, and there was no significant difference between the three groups. This is because afucosylation of MBS301 increased its binding affinity towards human FcγRIIIa, but not towards the corresponding mouse version. It is known that mouse FcγRs and FcRn efficiently bind human IgG subclasses, but the affinity is lower than that of the human versions, so humanized antibody Fc cannot effectively activate NK cells and macrophages of BALB/c nude mice compared with mouse IgG subclasses.Citation23 However, the ADCC function of MBS301 can be observed in the humanized mice (hu-CD34 NSG mice) study (); there was a slight visible difference between the MBS301 and MBS301 + F groups in tumor inhibition and the recurrence ratio of MBS301 was lower than that of MBS301 + F.Citation24 Still, the content of humanized NK cells was much lower in hu-CD34 NSG mice than in human.Citation25 The NK cells could account for 5–20% in human peripheral blood mononuclear cells; thus, significant ADCC function for killing cancer cells could be observed for MBS301 when used as a treatment in humans.
In conclusion, MBS301 developed in this work has been demonstrated to be a native IgG1-like molecule with high purity and integrity. To our knowledge, it is a first reported fully afucosylated bispecific antibody. MBS301 blocks domain II and IV of HER2-ECD simultaneously, resulting in the synergistic effect of combination use of trastuzumab and pertuzumab. Enhanced binding affinity to FcγRIIIa 158V and 158F allotypes and corresponding ADCC activity make MBS301 a viable candidate to treat patients no longer responsive to trastuzumab treatment.
MATERIALS and METHODS
Reagents
T-mab and P-mab were produced in house and are currently in clinical development as biosimilars of trastuzumab and pertuzumab, respectively. HER2-ECD antigen (10004H08H) and Human CD16a/FcγRIIIa 158V (10389-H08C1) and 158F (10389-H08C) were obtained from Sino Biological Inc.; Human Antibody Capture Kit (BR-1008–39) and His Capture Kit (28-9950-56) were purchased from GE Healthcare; Cytotoxicity Detection Kit (04744934001) was purchased from Roche; Cell Counting Kit-8 (CK04) was purchased from Dojindo Laboratories.
Cancer cell lines
CHO-K1 cells (No 58995535) were obtained from American Type Culture Collection (ATCC). Human breast cancer cell line BT-474 (HTB-20), MDA-MB-175VII (HTB-25), SK-BR-3(HTB-30) and HCC1419(CRL-2326) are HER2-positive cell lines, which were obtained from the ATCC, and HCC1419 is trastuzumab-resistant human breast cancer cell line.Citation26 Colon cancer cell line SW480(TCHu172), ovarian cancer cell line SK-OV-3(TCHu185) and stomach cancer cell line NCI-N87(TCHu130) are HER2-positive cell lines, obtained from the Cell Bank of Chinese Academy of Sciences. For in vitro ADCC study, the cell line NK92MI-CD16a transduced to express a high affinity variant (V158) of FcγRIIIa receptor (CD16) was obtained from Huabo Bio.
Expression of the half antibodies and assembly of MBS301
CHO-K1 cells were subjected to gene knockout of the key protein GDP-fucose transferase (GFT) by using zinc-finger enzyme, then fucose-knockout host cells were obtained and named as CHOK1-AF. As described in , MBS301-hole is the half antibody of T-mab, MBS301-knob is the half antibody of P-mab. The half antibody eukaryotic expression vector of MBS301-hole and MBS301-knob were separately transfected into target host cell CHOK1-AF, then the two host cell lines were cultured separately. The two suspensions of cell fermentation were purified by Protein A column. The two half antibodies were then mixed in molar ratio of 1:1, added with reducing agent GSH, stirred at room temperature with low speed overnight. After the reducing agent was removed by desalting column, the heterodimer MBS301 was obtained. The half antibody eukaryotic expression vectors of MBS301-hole and MBS301-knob were also separately transfected into target host cell CHO-K1, the heterodimer of MBS301 + F (F is abbreviated from fucose, ) was obtained following the same procedure. Both MBS301 and MBS301 + F are bispecific anti-HER2 antibodies.
Molecular mass determination of deglycosylated MBS301
MBS301 sample was added with PNGase F, and placed in 37°C water-bath overnight. Then, the mixture was diluted to 2.5 mg/ml before injection for LC-MS analysis. A reverse phase column was used to desalt the sample and the mass spectrometry determination was performed on a TripleTOF 4600 (AB Sciex). The data was subjected to deconvolution analysis using Analyst TF1.6 software.
N-glycan analysis
The samples of MBS301 + F and MBS301 were desalted, PNGase F was added and the mixed solutions were placed in 37°C water-bath overnight. The digested sample was added to anhydrous ethanol, centrifuged and the supernatant was concentrated and dried under vacuum. 2-AB and the reducing agent sodium cyanoborohydride were added, placed in 65°C oven for 3 h. 200 μL of a mixture solution of 80% Mobile phase B (100% acetonitrile) and 20% Mobile phase A (100 mM ammonium formate, pH4.5) were added, centrifuged for 2 min, and the supernatant was collected. 10 μL collected sample was loaded onto the column (ACQUITY UPLC BEH amide,1.7 μm,2.1 × 150 mm) and the initial mobile phase was 20% A for 20 min and then a two-stage gradient was applied: 1% A per min from 20% to 25%, followed by 0.3% A per min from 25% to 40%. The separation is performed at 60°C at a flow rate of 0.25 ml/min and monitored by fluorescence with excitation occurring at 330 nm and emission at 420 nm. Data was subjected to analysis with ChemStation.
Hydrophobic-interaction chromatography (HIC) analysis
A Proteomix HIC Butyl column (4.6 mm × 35 mm) was employed for HIC analysis. The antibody MBS301, half antibody MBS301-hole and MBS301-knob sample were diluted to 1 mg/ml with mobile phase A. Mobile phase A consists of 50 mM sodium dihydrogen phosphate and 1.5 M ammonium sulfate, pH 6.0; mobile phase B was 50 mM sodium dihydrogen phosphate, pH 6.0. Flow rate was 0.5 ml/min and gradient elution, 3-min hold at 0% B followed by a linear gradient to 100% B in 37 min, then the column is washed with 100% B for 10 min and re-equilibrated in 0% B for 8 min, column temperature at 30°C. The separation is monitored by UV absorption at 280 nm.Citation27
Differential scanning calorimetry (DSC) analysis
Thermal stability of the T-mab, P-mab and MBS301 were evaluated by measuring their Tm values using a Microcal VP-Capillary DSC System (GE Healthcare), and scans were recorded at a rate of 120°C/h. The formulated solution of T-mab and P-mab were exchanged into the same buffer as MBS301 by using NAP-5 columns, then the samples were diluted to 0.5 mg/ml with the same buffer and scanned from 25°C to 100°C.
Computer modeling study of the interaction between HER2 and MBS301
Based on the computer-guided homology modeling method, the 3-D structures of MBS301-hole and MBS301-knob and MBS301 structure were constructed. Based on the crystal structure of HER2, 3-D complex structures between the mAbs and HER2 were modeled using a molecular docking method individually. Under CVFF force filed, the modeling structures were optimized using molecular mechanics. All computational processes were completed on an IBM workstation.
HER2 binding activity analysis by biacore
The affinities of the anti-HER2 antibodies for HER2-ECD were determined by Biacore X100 Plus. The anti-human antibody (included in the Human Antibody Capture Kit, BR-1008–39, GE Healthcare) was immobilized on a CM5 chip at pH 5.0 using the amine coupling kit (GE Healthcare). T-mab, P-mab, combination of T-mab and P-mab (1:1), MBS301 + F, and MBS301 samples at 0.1 μg/ml were captured on the CM5 chip, respectively, in the second flow cell. A dilution series of HER2-ECD protein (from 0.125–4 μg/ml) was passed on both flow cells at 30 μl/min to record the association phase (180 seconds). The dissociation phase was monitored for 1200 seconds. Bulk refractive index differences were corrected by subtracting the response obtained on the reference flow cell (first flow cell). After each cycle, the sensor surface was regenerated via a short treatment using 3M MgCl2. The binding kinetics were recorded and analyzed with the Biacore evaluation software using the 1:1 binding model. The kinetic rate constants, Ka and Kd, were derived for each reaction. KD value was calculated from the Kd/Ka ratio.
HER2 competitive binding analysis of MBS301 with T-mab and P-mab
Surface plasmon resonance experiments were carried out at 25°C using a Biacore X100 Plus instrument with HBS-EP+ buffer as a running buffer. The anti-histidine antibody (included in the His Capture Kit, 28-9950-56, GE Healthcare) was immobilized on two flow cells of a CM5 Chip using amine coupling method (GE Healthcare). HER2-ECD-His at 0.5 μg/ml were captured on the second flow cell at 10 μl/min. One of the anti-HER2 antibodies at a saturation concentration of 10 μg/ml was followed by co-injection of HER2-ECD-His (injection 1), followed by serially diluted solution containing another anti-HER2 antibody (injection 2). The co-injection was performed at a flow rate of 30 μl/min for 180 s. The dissociation was monitored for 1200 s. Regeneration of the capture surface was performed using 10 mM glycine–HCl, pH 1.5, at a flow rate of 30 μl/min. The data were then fitted using a 1:1 interaction model. The kinetic rate constants, Ka and Kd, were derived for each reaction. KD value was calculated from the Kd/Ka ratio.
FcγRIIIa binding activity analysis
The affinities of different anti-HER2 antibodies (T-mab, P-mab, combination of T-mab and P-mab (1:1), MBS301 + F, and MBS301) for FcγRIIIa (human 158V and 158F) were determined by Biacore X100 Plus. The anti-histidine antibody was immobilized on two flow cells of a CM5 Chip using the amine coupling method (GE Healthcare). The second flow cell was used to capture the antibodies and the first flow cell was used as a reference surface. FcγRIIIa with a poly-histidine tag (Sino Biological) at 0.2 g/ml were captured on the second flow cell at 10 μl/min, and a dilution series of antibodies was injected on both flow cells at 30 μl/min to record the association phase (180 seconds). The dissociation phase was triggered by switching from the sample solution to HBS-EP+ buffer and monitored for 180 seconds. The chip surface was regenerated after each cycle by injecting 10 mM glycine-HCl pH1.5 (30 μl/min, 60 s). The affinity was determined using the steady state affinity model in the Biacore X100 evaluation software.
Cancer cell proliferation inhibition assay
BT-474 cells were placed in 96-well plates, approximately 10,000 cells per well, and allowed to adhere for overnight at 37°C in a humidified atmosphere of 5% CO2. BT474 cells were incubated with a series of diluted concentrations of anti-HER2 antibodies (T-mab, P-mab, combination of T-mab and P-mab (1:1), MBS301 + F, and MBS301). Their final concentrations were 100 μg/ml, 25 μg/ml, 6.25 μg/ml, 1.56 μg/ml, 0.39 μg/ml, 0.098 μg/ml, 0.0244 μg/ml, 0.0061 μg/ml, and 0.0015 μg/ml, respectively. After 5 d incubation, cytotoxicity was measured by CCK-8 dye coloration. 15 μl CCK-8 was added to each well; the plates were incubated for 4 h at 37°C. The absorbance was measured by MD Spectramax i3 at 450 nm. The analysis methods performed for other cells (MDA-MB-175VII, NCI-N87, SK-BR-3 and HCC1419) followed the same procedure as above for BT-474 cells. The EC50 values were calculated using GraphPad Prism software with four-parameter curve fitting. The inhibition rate was calculated according to: (1- sample OD/control OD)× 100%, at the highest concentration of 100 μg/ml when the cell growth inhibition reached a steady plateau.
ADCC activity analysis
The target cells of BT474, HCC1419, SW480, SK-OV-3 were placed in 96-well plates, approximately 5,000 cells per well. Antibodies at different concentrations were separately added to achieve final concentrations of 0.000001 μg/ml, 0.00001 μg/ml, 0.0001 μg/ml, 0.001 μg/ml, 0.01 μg/ml, 0.1 μg/ml, 1 μg/ml, and 10 μg/ml. The effector cells of NK92MI-CD16a were added (E/T ratio was 10:1), the mixture were incubated at 37°C for 6 h, LDH developing solution was then added, 100 μL/well. The solution were blocked from light and incubated at room temperature for 20 min. Determination was performed with a MD SpectraMax i3.
In vivo mouse xenograft (CDX) model studies
For human breast cancer BT-474 xenograft model studies, female BALB/c nude mice were implanted with 0.72 mg 60-d release 17b-estradiol pellets (Innovative Research of America). BT-474 cell titer was adjusted to 1 × 10⁸/ml, then the suspension was carefully mixed with MATRIGEL® (biological cell culture substrate) at the ratio of 1:1, the cell suspension was 5 × 10⁷/ml, BT-474 cells were injected in a volume of 0.2 ml into the right mammary fat pad of each mouse. Mice were randomized for tumor volume of 125 mm3 and subsequently treated twice weekly with a volume of 10 ml/kg intravenous injection. Tumors were measured with digital calipers and tumor volumes were calculated by the formula: volume = length×(width)2/2.
For human gastric cancer NCI-N87 xenograft model studies, cell titer was adjusted to 5 × 10⁷/ml. Tumor cell suspension was carefully mixed with Matrigel at the ratio of 1:1, then the cell suspension was 2.5 × 10⁷/ml, NCI-N87 cells were subcutaneously injected in a volume of 0.2 ml into the right back of each mouse. Mice were randomized for tumor volume of 110 mm3 and subsequently treated once weekly with a volume of 10 ml/kg intravenous injection.
Human gastric cancer NCI-N87 cells were also used to study MBS301’s ADCC activity in a special mouse xenograft model. Humanized mice (hu-CD34 NSG) provided by Beijing IDMO Co. Ltd were used for the experiments. NCI-N87 cell titer was adjusted to 5 × 10⁴/ml. Tumor cell suspension was carefully mixed with Matrigel at the ratio of 1:1, then the cell suspension was 2.5 × 10⁴/ml. The cells were then subcutaneously injected in a volume of 0.2 ml into the right back of each mouse. Mice were randomized for tumor volume of 127 mm3 and subsequently treated once weekly with a volume of 10 ml/kg intravenous injection.
Disclosure of Potential Conflicts of Interest
No potential conflict of interest was reported by the authors.
Abbreviations
| ADCC | = | antibody-dependent cell-mediated cytotoxicity |
| CDX | = | cell line derived xenograft |
| CHO | = | Chinese hamster ovary |
| CHOK1-AF | = | fucose-knockout host cell line based on CHO-K1 cells |
| DSC | = | differential scanning calorimetry |
| EC50 | = | half maximal effective concentration |
| ECD | = | extracellular domain |
| F | = | fucose |
| GFT | = | GDP-fucose transporter |
| HER2 | = | human epidermal growth factor receptor 2 |
| HIC | = | hydrophobic-interaction chromatography |
| NK | = | natural killer cell |
| NSG: | = | NOD-SCID mice with a null mutation of the gene of the gamma chain of IL-2 receptor. |
| P-mab | = | in-house made pertuzumab biosimilar |
| T-mab | = | in-house made trastuzumab biosimilar |
Additional information
Funding
References
- Iqbal N, Iqbal N. Human Epidermal Growth Factor Receptor 2 (HER2) in cancers: overexpression and therapeutic implications. Mol Biol Int. 2014;2014(1):1–9. PMID: 25276427. doi:10.1155/2014/852748.
- Eccles SA. The epidermal growth factor receptor/Erb-B/HER family in normal and malignant breast biology. Int J Dev Biol. 2011;55(7–8–9):685–696. PMID: 22161825. doi:10.1387/ijdb.113396se.
- Zhou H, Zha Z, Liu Y, Zhang H, Zhu J, Hu S, Shen G, Cheng L, Niu L, Greene MI, et al. Structural insights into the down-regulation of overexpressed p185her2/neuProtein of transformed cells by the antibody chA21. J Biol Chem. 2011;286(36):31676–31683. PMID: 21680730. doi:10.1074/jbc.M111.235184.
- Valabrega G, Montemurro F, Aglietta M. Trastuzumab: mechanism of action, resistance and future perspectives in HER2-overexpressing breast cancer. Ann Oncol. 2007;18(6):977–984. PMID: 17229773. doi:10.1093/annonc/mdl475.
- Tagliabue E, Campiglio M, Pupa SM, Ménard S, Balsari A. Activity and resistance of trastuzumab according to different clinical settings. Cancer Treat Rev. 2012;38(3):212–217. PMID: 21726959. doi:10.1016/j.ctrv.2011.06.002.
- Vu T, Claret FX. Trastuzumab. Updated mechanisms of action and resistance in Breast Cancer. Front Oncol. 2012;2. PMID: 22720269. doi:10.3389/fonc.2012.00062.
- Kurtz PBJLVGFWJ, Leblanc J, Goldbarg V, Wendling F, Kurtz JE. Pertuzumab: development beyond breast cancer. Anticancer Res. 2014;34:1483–1492. PMID: 24692675.
- Scheuer W, Friess T, Burtscher H, Bossenmaier B, Endl J, Hasmann M. Strongly enhanced antitumor activity of trastuzumab and pertuzumab combination treatment on HER2-positive human xenograft tumor models. Cancer Res. 2009;69(24):9330–9336. PMID:19934333. doi:10.1158/0008-5472.CAN-08-4597.
- Baselga J, Gelmon KA, Verma S, Wardley A, Conte P, Miles D, Bianchi G, Cortes J, McNally VA, Ross GA, et al. Phase II trial of pertuzumab and trastuzumab in patients with human epidermal growth factor receptor 2–positive Metastatic Breast Cancer that progressed during prior trastuzumab therapy. J Clin Oncol. 2010;28(7):1138–1144. PMID: 20124182. doi:10.1200/JCO.2009.24.2024.
- Baselga J, Swain SM. CLEOPATRA: a phase III evaluation of pertuzumab and trastuzumab for HER2-positive metastatic breast cancer. Clin Breast Cancer. 2010;10(6):489–491. PMID: 21147694. doi:10.3816/CBC.2010.n.065.
- Zhang F, Zhang J, Liu M, Zhao L, LingHu R, Feng F, Gao X, Jiao S, Zhao L, Hu Y, et al. Combating HER2-overexpressing breast cancer through induction of calreticulin exposure by Tras-Permut CrossMab. OncoImmunology. 2015;4(3):e994391. doi:10.4161/2162402X.2014.994391.
- Musolino A, Naldi N, Bortesi B, Pezzuolo D, Capelletti M, Missale G, Laccabue D, Zerbini A, Camisa R, Bisagni G, et al. Immunoglobulin G fragment C receptor polymorphisms and clinical efficacy of trastuzumab-based therapy in patients with HER-2/neu–positive Metastatic Breast Cancer. J Clin Oncol. 2008;26(11):1789–1796. PMID: 18347005. doi:10.1200/JCO.2007.14.8957.
- Kontermann R. Dual targeting strategies with bispecific antibodies. mAbs. 2014;4(2):182–197. PMID: 22453100. doi:10.4161/mabs.4.2.19000.
- Atwell S, Ridgway JBB, Wells JA, Carter P. Stable heterodimers from remodeling the domain interface of a homodimer using a phage display library. J Mol Biol. 1997;270(1):10. PMID: 24670875. doi:10.1038/srep04483.
- Dillon M, Yin Y, Zhou J, McCarty L, Ellerman D, Slaga D, Junttila TT, Han G, Sandoval W, Ovacik MA, et al. Efficient production of bispecific IgG of different isotypes and species of origin in single mammalian cells. mAbs. 2016;9(2):213–230. PMID: 27929752. doi:10.1080/19420862.2016.1267089.
- Zhang P, Haryadi R, Chan KF, Teo G, Goh J, Pereira NA, Feng H, Song Z. Identification of functional elements of the GDP-fucose transporter SLC35C1 using a novel Chinese hamster ovary mutant. Glycobiology. 2012;22(7):897–911. doi:10.1093/glycob/cws064.
- Johnson KA, Paisley-Flango K, Tangarone BS, Porter TJ, Rouse JC. Cation exchange–HPLC and mass spectrometry reveal C-terminal amidation of an IgG1 heavy chain. Anal Biochem. 2007;360(1):75–83. PMID: 17113563. doi:10.1016/j.ab.2006.10.012.
- Kang YK, Ko Y, Choi A, Choi HJ, Seo J-H, Lee M, Lee JA. Humanizing NOD/SCID/IL-2Rγnull (NSG) mice using busulfan and retro-orbital injection of umbilical cord blood-derived CD34+cells. Blood Res. 2016;51(1):31. PMID: 27104189. doi:10.5045/br.2016.51.1.31.
- Fuentes G, Scaltriti M, Baselga J, Verma CS. Synergy between trastuzumab and pertuzumab for human epidermal growth factor 2 (Her2) from colocalization: an in silicobased mechanism. Breast Cancer Res. 2011;13(3): PMID: 21600050. doi:10.1186/bcr2888.
- Li B, Meng Y, Zheng L, Zhang X, Tong Q, Tan W, Hu S, H L, Chen Y, Song J, et al. Bispecific antibody to ErbB2 overcomes trastuzumab resistance through comprehensive blockade of ErbB2 heterodimerization. Cancer Res. 2013;73(21):6471–6483. PMID:24046294. doi:10.1158/0008-5472.CAN-13-0657.
- Press MF, Cordoncardo C, Slamon DJ. Expression of the HER-2/neu proto-oncogene in normal human adult and fetal tissues. Oncogene. 1990;5(7):953–962. PMID: 1973830.
- Bang YJ, Giaccone G, Sa I, Dy O, Bauer TM, Nordstrom JL, Li H, Chichili GR, Moore PA, Hong S, et al. First-in-human Phase 1 study of margetuximab (MGAH22), an Fc-modified chimeric monoclonal antibody, in patients with HER2-positive advanced solid tumors. Ann Oncol. 2017:mdx002. PMID: 28119295. doi:10.1093/annonc/mdx002.
- Bruhns P. Properties of mouse and human IgG receptors and their contribution to disease models. Blood. 2012;119(24):5640–5649. PMID: 22535666. doi:10.1182/blood-2012-01-380121.
- Junttila TT, Parsons K, Olsson C, Lu Y, Xin Y, Theriault J, Crocker L, Pabonan O, Baginski T, Meng G, et al. Superior in vivo efficacy of afucosylated trastuzumab in the treatment of HER2-Amplified Breast Cancer. Cancer Res. 2010;70(11):4481–4489. PMID: 20484044. doi:10.1158/0008-5472.CAN-09-3704.
- Billerbeck E, Mommersteeg MC, Shlomai A, Xiao JW, Andrus L, Bhatta A, Vercauteren K, Michailidis E, Dorner M, Krishnan A, et al. Humanized mice efficiently engrafted with fetal hepatoblasts and syngeneic immune cells develop human monocytes and NK cells. J Hepatol. 2016;65(2):334–343. PMID: 27151182. doi:10.1016/j.jhep.2016.04.022.
- Ahmad S, Gupta S, Kumar R, Varshney GC, Raghava GPS. Herceptin resistance database for understanding mechanism of resistance in Breast Cancer Patients. Sci Rep. 2014;4(1): PMID: 24670875. doi:10.1038/srep04483.
- Valliere-Douglass J, Wallace A, Balland A. Separation of populations of antibody variants by fine tuning of hydrophobic-interaction chromatography operating conditions. J Chromatogr A. 2008;1214(1–2):81–89. PMID: 19012891. doi:10.1016/j.chroma.2008.10.078.