
ABSTRACT
Therapeutic proteins including monoclonal antibodies (mAbs) are usually produced in engineered host cell lines that also produce thousands of endogenous proteins at varying levels. A critical aspect of the development of biotherapeutics manufacturing processes is the removal of these host cell proteins (HCP) to appropriate levels in order to minimize risk to patient safety and drug efficacy. During the development process and associated analytical characterization, mass spectrometry (MS) has become an increasingly popular tool for HCP analysis due to its ability to provide both relative abundance and identity of individual HCP and because the method does not rely on polyclonal antibodies, which are used in enzyme-linked immunosorbent assays. In this study, HCP from 29 commercially marketed mAb and mAb-based therapeutics were profiled using liquid chromatography (LC)-MS/MS with the identification and relative quantification of 79 individual HCP in total. Excluding an outlier drug, the relative levels of individual HCP determined in the approved therapeutics were generally low, with an average of 20 ppm (µmol HCP/mol drug) measured by LC-MS/MS, and only a few (<7 in average) HCP were identified in each drug analyzed. From this analysis, we also gained knowledge about which HCP are frequently identified in mAb-based products and their typical levels relative to the drugs for the identified individual HCP. In addition, we examined HCP composition from antibodies produced in house and found our current development process brings HCP to levels that are consistent with marketed drugs. Finally, we described a specific case to demonstrate how the HCP information from commercially marketed drugs could inform future HCP analyses.
Introduction
Therapeutic monoclonal antibodies (mAbs) and mAb-based drugs have found widespread use as biotherapeutics to treat diverse diseases, with about 100 therapeutic mAbs approved by the United States Food and Drug Administration (FDA) to date.Citation1 MAbs and most other therapeutic proteins are produced in engineered host cell lines where, in addition to the biotherapeutic protein sequence, the host cells also produce thousands of endogenous proteins. These host cell proteins (HCP) are impurities that, according to FDA guidance, must be removed to trace levels as measured by a highly sensitive analytical method during drug purification.Citation2–6
Although extensive purification processes can successfully remove the majority of HCP from protein therapeutics, trace levels of HCP are commonly present in biotherapeutics and could pose a risk to the safety and efficacy of these drugs. For example, specific HCP have been shown to degrade the drug or excipients in the drug product, resulting in a reduction in shelf life as well as the formation of potentially inactive or immunogenic product-related species.Citation7–10 In addition, HCP can cause an immune response in patients, have biological activity or act as an adjuvant for the drug itself.Citation11,Citation12
Regulatory agencies have designated HCP as a critical quality attribute, and the knowledge of their impact on product safety and stability is still evolving. Benchmarking HCP in commercial biotherapeutic products provides valuable information for the biotechnology industry, which aims to develop pure and safe biotherapeutic products through process optimization.Citation13 Knowledge of HCP levels across approved protein therapeutics would help to determine the current industry standard for HCP clearance during production. However, the enzyme-linked immunosorbent assay (ELISA) methods that are commonly used for HCP analysis cannot be readily compared across companies and drugs due to differences in HCP populations from different host cell lines and differences in the immunoreactivity against HCP for different ELISA kits. In addition, HCP ELISA results give a total HCP measurement and do not provide information about individual proteins present in the drugs and therefore give an incomplete picture of the HCP impurity profile. Mass spectrometry (MS) has emerged as a powerful tool for identifying and quantifying individual HCP in therapeutic antibodies.Citation14 Many new proteomic methods have been developed for HCP analysis in recent years.Citation15–17 However, the data published from MS studies often do not include information about individual HCP identified in drugs on the market.
In order to understand the risk from HCP for a given product, it is very useful to know the identities of the individual HCP and their relative abundances. Once the identity of an HCP is known, it can be assessed for potential biological activity or immunogenicity.Citation18–21 Information about individual HCP is useful for risk assessments to determine the risk to manufacturing, product stability and to patient safety. In addition, knowledge of individual HCP properties can also inform any process changes that need to be made in order to remove HCP present at elevated levels.
In this paper, we performed the HCP analysis for over two dozen commercially available mAb-based therapeutics () produced in Chinese hamster ovary (CHO) cell lines by LC-MS/MS.Citation22–24 Individual HCP across these approved biopharmaceuticals were identified and their abundance was estimated. We also summarized the MS-based HCP analysis results from the past several years of biotherapeutics development done in house. We believe that the results from these analyses can be used as a benchmark for future drug development to determine if HCP levels are in line, or higher than previously observed levels in drugs on the market and in production. Finally, the HCP levels from a therapeutic mAb drug candidate are presented as an example of how data from these benchmarking studies could be used.
Table 1. Therapeutics analyzed for HCP content organized by the Year of FDA approval
Results
Data compilation
We identified and estimated the relative abundance of HCP from 29 commercially available medicines () produced in CHO cell lines. These are primarily mAbs or IgG-based fusion proteins or bispecific antibodies that cover IgG1, IgG2 and IgG4 subclasses. Produced at 14 different companies, the drugs have FDA approval dates from 1997 to 2019. The drugs analyzed cover major targets, and include widely prescribed drugs, as well as several biosimilar products.
In addition to analyzing commercially available therapeutics, data from 12 mAbs and bispecific antibodies produced in house were compiled. These samples were analyzed using a native digestion-based LC-MS/MS method.Citation22 Results of these analyses have been curated in a database to track sample information and relative abundance of individual HCP. When data were compiled for Regeneron molecules, the abundance of each individual HCP was averaged across replicate analysis or different lots from the same process for each molecule.
All of the results in this publication are from analyses performed using a native digestion method adapted from the method published by Huang et al.Citation22 This method has come into more frequent use in industry due to its simplicity and ability to reliably identify HCP down to low ppm levels, depending on the LC-MS system used.Citation22–25 To more accurately describe the levels of individual HCP identified across multiple protein therapeutics analyzed, all the results are given in a mole ratio ppm (micromoles of HCP compared to moles of antibody) rather than the traditional mass ratio ppm (nanogram of HCP compared to milligram of antibody) used in ELISA-based HCP analysis. Use of ppm in mole ratio allows a fairer comparison of the actual abundance of different HCP identified by taking into consideration the fact that different HCP usually have a wide range of molecular weights (MW). It is worth noting that the results are not absolute HCP measurements, but rather relative quantitation using spiked-in protein standards at a known concentration. We view our results as consistent within a dataset, based on our knowledge on the performance of the assay that typically has <10% variation for relative abundance of HCP in the control sample for sample sets run on the same day and same instrument.
NISTmAb – benchmarking
In order to demonstrate that the native digestion LC-MS/MS method is fit for use, we analyzed the NISTmAb standard and identified 81 HCP. We then compared our results to published HCP results for the NISTmAb that were determined using different digestion conditions, LC separation methods and MS systems ().Citation22,Citation26–28 As expected, the majority of HCP reported in other LC-MS analyses were identified in our experiment (, Supplemental Table S1). In addition, 13 HCP identified in this study but not in the published studies were verified against much longer lists of NISTmAb HCP identified using more advanced HCP enrichment methods.Citation15,Citation29 These results demonstrate that most HCP, if present at high levels in an antibody sample, can be confidently identified.
Figure 1. (a) Comparison of the host cell proteins identified in NISTmAb in this study (blue) to Ma et al. (green) and Pengelley et al. (red). In this study, HCP identity was attained leveraging native digestion LC-MS/MS vs. Ma et al., 2020 nanoLC-MS/MS.Citation26 and Pengelley et al., 2018 nano-LC-MS/MS with trapped ion mobility and PASEF (parallel accumulation and serial fragmentation) MS method.Citation27 (b) Correlation between the relative abundances of HCP measured in NISTmAb from the current publication to previously reported relative abundances using the native digest method reported by Huang et al.Citation22 and a complete tryptic digest followed by 2D-LC MS reported by Doneanu et al.Citation28
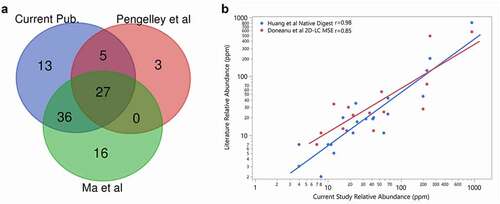
The relative quantity in parts per million (ppm) of HCP identified in our experiment was further compared with the original native digestion paper by Huang et al.Citation22 and a 2D LC Ion Mobility LC-MSE method by Doneanu et al.,Citation28 the two published datasets comprised semi-quantitative results for HCP levels in the NISTmAb (). The published results were originally given in ppm (ng HCP/mg of drug as mass ratio) using the predicted MW of each HCP to calculate the ppm value of each HCP present. Our results are proportional to the number of moles of HCP present as discussed above, so we converted results from literature to a mole ratio of micromoles HCP to moles of NISTmAb as ppm value for this comparison. As shown in , although there are some variations among the three sets of results, most of the individual HCP exhibit good trending and correlations in relative abundance, with Pearson correlation coefficients of 0.98 and 0.85 for Huang et al.Citation22 and Doneanu et al.,Citation28 respectively.
Host cell proteins in commercial biotherapeutics
Seventy-nine different HCP were identified across the 29 drugs profiled and their amounts were estimated. Individual HCP (Supplemental Table S2) were sorted by frequency of identification and drugs were sorted by number of proteins identified to create the heatmap in . In addition, HCP profiles were created for each drug by establishing the relative amount of each of the identified HCP as it relates the total sum of HCP present for that drug (). As shown in and , drug 1 exhibited a markedly different HCP profile as compared to the others. As a result, to avoid skewing the analysis from this one data set, data from drug 1 were excluded from subsequent analyses.
Figure 2. Heatmap of HCP abundance in approved therapeutic proteins. Columns represent a therapeutic protein ordered by decreasing number of HCP identified. Each row is an individual HCP identified in the current analysis. Colors signify HCP abundances ranging from >100 ppm (red) to 0 ppm (not detected, blue)
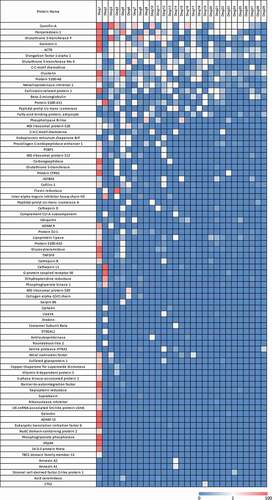
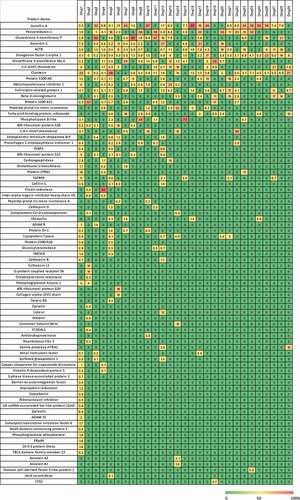
Figure 3. Heatmap of HCP in percent abundance within each individual therapeutic protein. Each column represents the data from an individual therapeutic protein. Each row is an individual HCP identified in the current analysis. Each individual HCP amount was divided by the sum of HCP identified for that product and multiplied by 100 to give a fractional abundance. The heatmap was colored by the HCP fractional level, where red is 100% of the HCP profile contributed by one protein and green indicates that the HCP was not detected
The results in show that each drug product has a unique HCP profile. A few HCP are identified more frequently than others (). For example, Cornifin-A and Peroxiredoxin-1 were identified in the majority of the commercial drugs analyzed. It is known that Peroxiredoxin-1 is difficult to remove and has been reported previously.Citation30–32 Cornifin-A, another commonly observed HCP, has also been identified frequently.Citation8,Citation33 Nine HCP were identified in 20% or more of the drugs analyzed. These HCP probably bind nonspecifically to constant regions of IgG molecules and are subsequently co-purified with the antibody-based drugs. In addition, the most frequently identified HCPs were also often the most abundant HCP identified in these commercial drugs as shown in .
Figure 4. Frequency and maximum abundance for individual HCP identified in approved therapeutic products. Top panel (blue): Percent of products where HCP was identified above a 1 ppm relative abundance. The HCP are ordered by frequency of identification. Middle panel (green): Maximum abundance in ppm of each HCP across all products. Bottom panel (orange): Maximum abundance in ppm across all products excluding Drug 1, which was an outlier
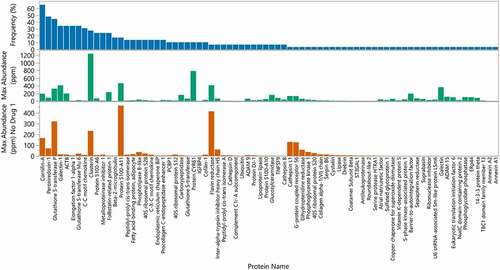
Some of the HCP were identified less frequently, either only present in specific drugs or were identified at much higher abundance only in specific ones compared to others. Examples of this include 40 S ribosomal protein S20, flavin reductase and Protein S100-A11, which were identified at higher abundance in specific drugs compared to the rest (). In addition, some drugs had specific HCP species that contributed more to the total HCP contents than any other identified protein. Nine of the 29 drugs had one dominant HCP contributing to over 50% of the total HCP amount whereas the remaining products had the levels of individual HCP distributed more evenly (), indicating that these dominant HCP are likely to bind with a higher affinity to specific antibody sequences. Other studies have shown that HCP that persist in the final drug product are often “hitch-hiker” proteins.Citation34 These HCP likely associate to the antibody molecule through nonspecific ionic and/or hydrophobic interactions, and as a result are carried through the purification process.Citation31,Citation35 A known example of this is Phospholipase B-like protein (PLBL2), which has been reported in publications to bind to IgG4 molecules and can be enriched in the first affinity purification step.Citation36 In fact, PLBL2 was identified as the dominant HCP species in two drugs, drug 9 and drug 15 that we profiled ().
HCP content of individual drugs
We estimated the total content of HCP in each drug by summing the relative abundance of individual HCP. Excluding drug 1, more than 85% of the 28 drugs analyzed exhibited 133 ppm or less total HCP by LC-MS analysis, and less than 7 individual HCP in average were identified in each therapeutic protein analyzed, demonstrating an overall low level of HCP impurities in the approved therapeutic proteins characterized (). Of these, only 5 drugs were determined to have total HCP in excess of 100 ppm. We do not have access to clinical data from these products, but products on the market are generally well tolerated with few reports of adverse events linked to HCP.Citation11,Citation37,Citation38
Figure 5. Number of HCP identified in each product compared to the aggregate amount of HCP identified. 95% of drugs had fewer than 14 HCP identified during this analysis (dotted vertical line). 85% of drugs exhibited total HCP of equal or less than 133 ppm (below dotted horizontal line). Drug 1 was excluded from the analysis
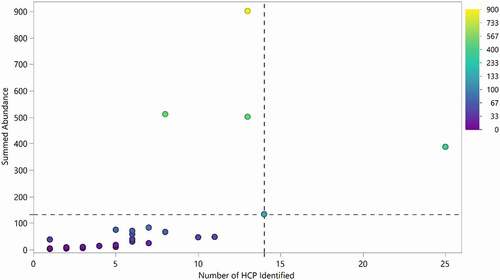
Drugs that had more individual HCP identified also had a higher total HCP content (). This could result from the purification process or it is possible that specific drugs have a higher propensity for nonspecific interactions with HCP compared to others. Several other studies have demonstrated this by incubating different mAb with CHO cell culture fluid and evaluating the number of HCP bound to the mAb after a protein A separation step.Citation31,Citation39 Drugs that were outliers in terms of total HCP content (lighter, yellow colored points in ) were not necessarily the drugs with the highest number of HCP. For many of these drugs, a higher combined HCP level was due to the elevated levels of one or a few specific HCP rather than an overall increase in the number of HCP present.
Host cell protein properties
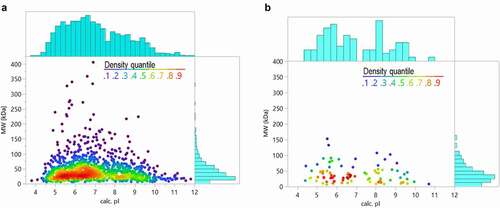
The predicted isoelectric point (pI) and MW distributions of all HCP identified across the analyzed therapeutic proteins were compared to proteins identified from a CHO cell supernatant sample prepared using the native digestion method (). As shown in , the HCP identified in the commercial drug products also have a broad range of MWs and pIs, reflecting the distribution of the HCPs in the cell supernatant sample material. This distribution of properties makes HCP difficult to remove by polishing steps during purification.
Figure 6. Comparison of HCP properties (theoretical isoelectric point and molecular weight based on sequence) for a representative harvest material (a) and all the HCP identified in the 29 approved biotherapeutic proteins (b)
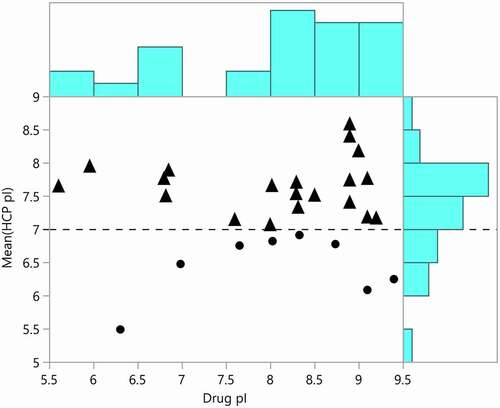
Although the purification processes for each drug molecule are different, it is of great interest to determine if there is some relationship between the properties of the therapeutic proteins and the HCP that copurify with them. To this end, we plotted the therapeutic protein pI versus the mean pI of all HCP identified in each drug (). It is hypothesized that HCP with pIs closer to the drug pI will be more difficult to remove because they will co-elute in the commonly used ion exchange purification steps.Citation40 As shown in (triangle points), the majority of drugs had a mean HCP pI that was basic. This result is interesting because a greater proportion of individual HCP identified in harvest material had an acidic pI (). The most frequently identified HCP across drugs (cornifin-A, peroxiredoxin-1, glutathione S transferase P) have basic pIs and probably shifted the mean pI to basic for the drugs analyzed. The lack of correlation between HCP pI and drug pI is likely to be the result of variation in the purification process between companies and products. The predicted pIs of some of the HCP are not accurate because they are based on the translated sequence of each protein and do not consider post-translational modifications or other sequence processing. Our observation further highlights the importance of downstream process development for each drug product and the complexity of removing individual HCP during therapeutic protein production.
Figure 7. Mean predicted host cell protein isoelectric points plotted against the predicted isoelectric points for approved therapeutic proteins. Mean HCP pI greater than 7 are marked with triangles and mean pI less than 7 are marked with dots. The distributions of drug and HCP isoelectric point are shown in blue on the borders of the plot
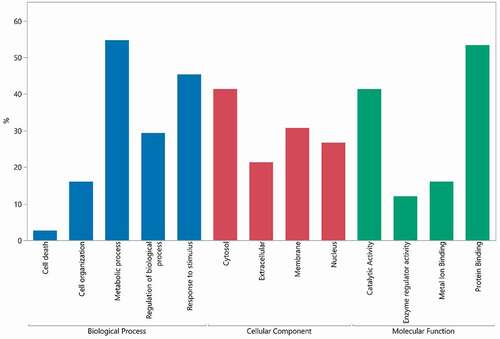
A gene ontology (GO) assessment was performed to evaluate the biological functions and locations of HCP identified across all the drugs analyzed (). Around 21% of the proteins are known extracellular proteins. MAbs are secreted from cells and the cell supernatant is harvested and purified, so many HCP are also expected to be extracellular proteins. The remainder of the proteins are from the cell membrane or inside of the cell, consistent with cell death or cell lysis. Proteomic analyses of CHO cell supernatants from different cell viabilities at harvest also have shown a high proportion of intracellular proteins.Citation41–43 The molecular function and biological process GO terms were also analyzed for identified HCP. Around ~50% of HCP have protein binding activity. Other highly represented terms include catalytic activity, response to stimulus and regulation of biological process. HCP with catalytic activity against the drug or excipients can negatively affect drug stability. A few HCP that are known to compromise protein integrity and/or stability were identified in our study, including Cathepsin L1, Cathepsin D and Lipoprotein lipase.Citation7,Citation8,Citation44
Figure 8. Gene ontology terms related to HCP identified in approved biotherapeutics analyzed in this study
Benchmarking in-house HCP data
In addition to analyzing HCP in commercially marketed drugs, we compiled results from a few Regeneron drug candidates at different stages of development from recent years. The purpose of this analysis was to provide a benchmark with our historical experience for future drug development. The data compiled were from 12 antibody drug candidates with two different stages of processes: first-in-human (FIH) platform process and commercially enabling process. Fully purified drug substances were analyzed by LC-MS at these different stages during development to ensure that individual HCP species, if any at high levels, were cleared and that no new HCP at high levels were introduced as the result of process evolution. The levels of individual HCP through process development were also compared against the HCP data from approved therapeutic proteins.
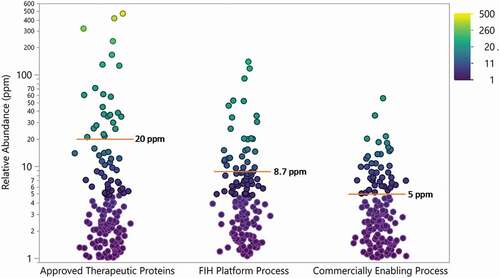
As expected, the abundance of individual HCPs decreased through process improvement, with the highest HCP levels at the early stage of development (). On average, HCP relative abundances decreased from 8.7 ppm measured in the FIH platform process to 5 ppm in the final commercially enabling process. In particular, the number of individual HCP measured decreased through development, with no HCP with a relative abundance greater than 100 ppm identified in any of the commercially enabling processes. When HCP identified in Regeneron processes were compared to approved therapeutic proteins, there was less spread in HCP abundances and the average for both processes was lower than the average relative abundance of 20 ppm for the approved therapeutic proteins.
Figure 9. Relative abundance of all HCP identified in approved therapeutic proteins (N = 28) and proteins (N = 12) produced in house using a first-in-human (FIH) platform process and commercially enabling process. Points are colored by relative abundance. Mean is indicated by red line and annotated. Drug 1 was not included in this analysis
HCP case study
In addition to the HCP benchmarking analysis, herein, we provide a specific example measuring HCP from a drug candidate under development to demonstrate how MS can be used to ensure that HCP levels are in line with approved therapeutics in the final process that will be used for clinical trials and commercialization.
In this specific case, we detected a relatively high level of one specific HCP, Protein S100-A6 (G3HC31) in the initial platform purification process used to produce this molecule (). This HCP was detected at a relative abundance 117 ppm in product produced using an FIH platform process. We know from the current analysis that most individual HCP in approved therapeutic proteins and in Regeneron molecules are present at a relative abundance of <20 ppm, so this protein is more abundant than expected. Protein S100-A6 is a small calcium binding protein and was among the frequently identified HCP from our analysis of approved therapeutic proteins. This HCP was monitored through process development. As shown in , during process optimization, the level of this protein was still relatively high in an intermediate development process, but after optimization it was no longer detectable in the commercially enabling process using the native digestion LC-MS method. Through process development, there was a shift in the HCP profile for this molecule, indicating that process parameters, as expected, have a large impact on which HCP are present in the final drug substance.
Figure 10. Relative abundance of HCPs identified in a drug candidate from different processes of development, FIH platform process (blue), intermediate process development (red), and commercially enabling process (green)
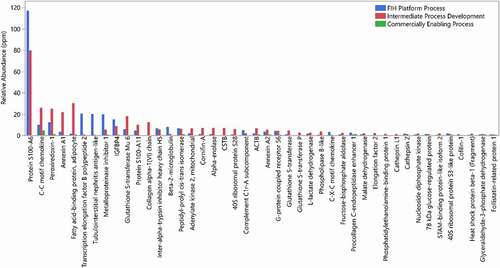
The main HCP identified in the final process (C-C motif chemokine, Procollagen C-endopeptidase enhancer and Peroxiredoxin-1) are commonly identified HCP and have been identified before at higher levels in approved therapeutic proteins. In addition, no individual HCP were identified with relative abundance higher than 5 ppm. Based on our analysis of HCP in approved drugs, this level of HCP in the final process for this program is well within the observed range for individual HCP.
Discussion
Residual HCP is a critical quality attribute for biotherapeutics because of its potential impact on drug safety and stability. Approved biotherapeutics have undergone rigorous safety testing in clinical trials and are controlled to maintain consistent manufacturing and HCP levels. These drugs can serve as a benchmark for current manufacturing capability with respect to HCP removal. To that end, we analyzed the HCP content and relative abundances of 29 commercially available biotherapeutic products. This analysis resulted in a list of 79 HCP that are identified in approved therapeutic proteins and their relative abundances.
We identified a set of HCP that are frequently identified across therapeutics. These HCP represent a class of protein that likely bind nonspecifically to IgG molecules and are difficult to remove through the purification process. These HCP were more likely to spike to higher levels in individual drugs, and as a result are useful to keep track of during process development.
A major challenge in HCP analysis is to determine what level of an individual HCP is acceptable in a drug. Recently, LC-MS methods have become more sensitive and can now measure tens or even hundreds of very low abundance HCP in purified drug substances.Citation45,Citation46 Many of these proteins have certain biological functions or potential enzymatic activities that may be a potential immunogenicity risk. However, when MS methods have become so sensitive that HCP are identified at less than 1 ppm, it is hard to determine whether they will pose a risk to product stability or patient safety. Some of these HCP, such as lipases,Citation10 have known activity at low levels or may be predicted to be highly immunogenic and need to be removed even when detected at trace levels. However, many have unknown function. In this case, it is helpful to have a benchmark for comparison and determination of a typical level for individual HCP, which would allow assessment of whether these proteins are below that range before performing extra purification development to remove them.
Here, we described an HCP benchmarking analysis to gain a better understanding of the range of HCP abundance within approved therapeutic proteins. With a few exceptions, the relative levels of HCP in approved therapeutics were generally low (<100 ppm in total) with an average of 20 ppm and with only a few (<7 in average) HCP identified in each drug analyzed.
While it is useful to know which HCP are commonly identified and their abundances in approved therapeutics for benchmarking purposes, the potential safety concerns for an individual HCP depend not only on the protein itself and its abundance, but also in other factors, including how the drugs are administered and patient demographics.Citation21 HCP that have been tolerated in the commercially available drugs we profiled may not be tolerated, even at the same or lower abundances in future clinical studies. It is still important to remove HCP as process-related impurities to as low levels as possible through careful process development.
It is worth noting that the our analysis is based on the relative abundances obtained and that these results are given in a mole ratio of HCP to drug. Although there are some day-to-day variations, when results from this analysis are compared to other assays we are confident about our intra-assay precision. As shown in the comparison of NISTmAb HCP to published results, we can consistently identify and quantify these HCP and determine which HCP are more or less abundant. However, as shown in the comparison to published NISTmAb quantitative results, there is variation in the measured abundance of individual HCP between groups, and it is likely that a repeat of these analyses in a different lab with different standards will result in different HCP abundances, which makes the benchmarking challenging. It would be useful to have a method or standard that could be applied across the industry to allow for more widespread benchmarking.
In addition, the results given here in ppm (in micromoles of HCP to moles of drug) cannot be directly compared to ELISA results, which are usually calculated in ppm (ng HCP to mg drug). The differences in the ppm measurements are not just in the units (mass vs moles), but also in how the HCP levels are measured. For ELISA, the total HCP abundance is measured relative to a standard curve made up of a mixture of HCP and is modulated by the response of individual HCP to the detection agent. For MS, individual HCP abundances are measured relative to a specific protein standard and are modulated by the ionization efficiency of individual HCP peptides compared to the standard. So, caution should be taken when using the information presented here. For example, 20 ppm of individual HCP level from this study cannot directly be compared to a 20 ppm measured by ELISA (usually in total HCP concentrations). However, the relative abundance of HCP determined by MS can be correlated to ELISA results to ensure that trends in HCP relative abundances match. This can be especially important for process clearance where ELISA might underestimate HCP levels particularly in more pure samples due to lack of antibody coverage for a specific protein that co-purified with the drug.
In the future, this dataset could be used as a tool to determine if the HCP profile in material generated during process development is in line with other approved recombinant therapeutic proteins on the market. It will also be a useful benchmark to determine whether MS methods used are sensitive enough to identify HCP in highly purified drug substances. In this analysis, we demonstrated that the efforts to remove HCP during process development have indeed minimized the HCP contents to levels that are comparable or lower than that seen in approved drugs. We also presented a case study of how the data could be used to guide process development and ensure that HCP species are in line with our experiences, as well as other recombinant therapeutic proteins widely used.
Materials and methods
Materials
The NIST reference mAb (Catalog #: RM8671) was purchased from Millipore-Sigma. Approved therapeutic proteins are commercially available. The Regeneron mAbs were manufactured and purified internally. Sequencing grade-modified trypsin (Catalog #: V5111) was purchased from Promega. The 10 kDa filter was purchased from Pall (Catalog # OD010C34). Dithiothreitol (DTT) was purchased from Thermo (Catalog # A39255).
Sample preparation
Samples were digested with trypsin under native conditions that favor digestion of smaller host cell proteins over the larger drug sequences using a variation on a method previously described.Citation22 All samples were buffer exchanged into water using a 10 kDa MW cut-off filter. The concentration of the sample was measured after buffer exchange using a Nanodrop. Two milligrams of sample were then spiked with two protein internal standards, recombinant human IL33 and heavy isotope labeled CHO PLBL2, at known concentrations relative to the sample, 50 ppm (micromoles standard to moles sample) and 10 ppm, respectively. The samples were then digested with trypsin at an enzyme to substrate ratio of 1:1000 overnight. After the digestion, DTT was added and the sample was further incubated at 90°C for 20 min to reduce disulfide bonds and precipitate undigested protein. The final digest was filtered using a 10 kDa MW cutoff filter and the flow-through was collected for analysis.
LC-MS/MS and data acquisition
Each digested sample was analyzed using a Waters ACQUITY UPLC system coupled to a Thermo Scientific Q Exactive Plus mass spectrometer. Waters CSH C18 column (1.7 μm particle size, 2.1 mm × 150 mm) was used for the peptide separation. Two mobile phases: 0.1% formic acid in water (mobile phase A) and 0.1% formic acid in acetonitrile (mobile phase B), were used with an acetonitrile gradient of 0.1–40% over 85 minutes to separate and eluate the tryptic peptides at a flow rate of 0.25 mL/min. The column was then washed with 90% acetonitrile for 10 min and re-equilibrated in mobile phase A. The MS data were acquired with one full scan at a resolution of 70k (at m/z 400), followed by 10 data-dependent MS/MS scan at a resolution of 17.5k. The automatic gain control (AGC) for the MS/MS scan was set to 1e5 with maximum IT of 300 ms. In addition, a control sample was analyzed routinely to evaluate variability in the method, ensure LC and MS system suitability, and track changes in HCP identification.
Data analysis
The resulting LC-MS/MS data was searched against the Cricetulus griseus Uniprot reference proteome database using Byonic Software (Protein Metrics). Proteins that had two unique peptides and unique amino acid sequences with high-quality MS/MS spectra and peptide length >6 amino acids were accepted as true positive identifications. Identified proteins were quantified relative to the spiked-in recombinant human IL33 protein standard using Skyline data processing software by averaging the peak area for the top two to three peptides for each HCP and dividing by the averaged peak area for the standard.Citation47,Citation48 The recombinant HCP standard, heavy isotope labeled PLBL2 was spiked at 10 ppm relative to the drug substance and used as a quality control check for HCP signal intensity and consistency in the relative abundance measurement. All the results are calculated in a mole ratio ppm (micromoles of HCP compared to moles of antibody) rather than the mass ratio ppm (nanogram of HCP compared to milligram of antibody). To compare directly with the published results,Citation22,Citation28 the ppm values originally given in a mass ratio were converted into ppm in mole ratio based on the predicted MW of each HCP. A control sample of known HCP content was run with every analysis to ensure that the sensitivity and consistency of the method was maintained. In addition, a “reagent blank” sample containing water instead of drug was processed and run alongside each sample set. Proteins identified in the “reagent blank” and drug samples at a similar abundance were assumed to be contaminants and were filtered out of the final HCP list. The pIs and MWs were calculated using protein amino acid sequences. Ontologies were associated with HCP using the EBI-EMBL Phenotype and Trait Ontology.
Abbreviations
CHO: Chinese hamster ovary; ELISA: enzyme-linked immunosorbent assay; FIH: first-in-human; GO: gene ontology; HCP: host cell protein(s); pI: isoelectric point; LC: liquid chromatography; MS: mass spectrometry; mAb: monoclonal antibody; MW: molecular weight
Supplemental Material
Download MS Word (32.1 KB)Disclosure statement
No potential conflict of interest was reported by the authors.
Supplementary material
Supplemental data for this article can be accessed on the publisher’s website
References
- Antibody therapeutics approved or in regulatory review in the EU or US. Source: Janice M. Reichert, PhD. Antibody Society. 2021. https://www.antibodysociety.org/resources/approved-antibodies
- European Pharmacopoeia Monograph 2.6.34.Host-cell protein assays (04/2017:20634).
- U.S. Pharmacopeia <1132> Residual host cell protein measurement in biopharmaceuticals. USP39-NF34, 2016.
- Points to consider in the manufacture and testing of monoclonal antibody products for human use. In: FDA, ed. FDA-1994-D-0318. https://www.fda.gov/regulatory-information/search-fda-guidance-documents/points-consider-manufacture-and-testing-monoclonal-antibody-products-human-use, 1997.
- DNA and host cell protein impurities, routine testing versus validation studies. In: EMA, ed. CPMP/BWP/382/97. www.ema.europa.eu/en/dna-host-cell-protein-impurities-routine-testing-versus-validation-studies, 1997.
- Guidance for Industry Q6B Specifications: test procedures and acceptance criteria for biotechnological/biological products. In: ICH, ed. ICH Q6B. www.ich.org/page/quality-guidelines, 1999.
- Bee JS, Tie L, Johnson D, Dimitrova MN, Jusino KC, Afdahl CD. Trace levels of the CHO host cell protease cathepsin D caused particle formation in a monoclonal antibody product. Biotechnol Prog. 2015;31(5):1360–13. doi:10.1002/btpr.2150.
- Luo H, Tie L, Cao M, Hunter AK, Pabst TM, Du J, Field R, Li Y, Wang WK. Cathepsin L causes proteolytic cleavage of Chinese-Hamster-ovary cell expressed proteins during processing and storage: identification, characterization, and mitigation. Biotechnol Prog. 2019;35(1):e2732. doi:10.1002/btpr.2732.
- Robert F, Bierau H, Rossi M, Agugiaro D, Soranzo T, Broly H, Mitchell-Logean C. Degradation of an Fc-fusion recombinant protein by host cell proteases: identification of a CHO cathepsin D protease. Biotechnol Bioeng. 2009;104(6):1132–41. doi:10.1002/bit.22494.
- Zhang S, Xiao H, Molden R, Qiu H, Li N. Rapid Polysorbate 80 degradation by liver carboxylesterase in a monoclonal antibody formulated drug substance at early stage development. J Pharm Sci. 2020;109(11):3300–07. doi:10.1016/j.xphs.2020.07.018.
- Vanderlaan M, Zhu-Shimoni J, Lin S, Gunawan F, Waerner T, Van Cott KE. Experience with host cell protein impurities in biopharmaceuticals. Biotechnol Prog. 2018;34(4):828–37. doi:10.1002/btpr.2640.
- Rane SS, Dearman RJ, Kimber I, Uddin S, Bishop S, Shah M, Podmore A, Pluen A, Derrick JP. Impact of a heat shock protein impurity on the Immunogenicity of biotherapeutic monoclonal antibodies. Pharm Res. 2019;36(4):51. doi:10.1007/s11095-019-2586-7.
- Jones M, Palakal N, Wang F, Gaza-Bulesco G, Hurkmans K, Zhao Y, Chitikila C, Clavier S, Liu S, Menesale E, et al. “High-risk” Host Cell Proteins (HCPs): a multi-company collaborative view. Biotechnol Bioeng 2021;118:2870–2885. doi: 10.1002/bit.27808.
- Valente KN, Levy NE, Lee KH, Lenhoff AM. Applications of proteomic methods for CHO host cell protein characterization in biopharmaceutical manufacturing. Curr Opin Biotechnol. 2018;53:144–50. doi:10.1016/j.copbio.2018.01.004.
- Chen IH, Xiao H, Li N. Improved host cell protein analysis in monoclonal antibody products through ProteoMiner. Anal Biochem. 2020;610:113972. doi:10.1016/j.ab.2020.113972.
- Chen IH, Xiao H, Daly T, Li N. Improved host cell protein analysis in monoclonal antibody products through molecular weight cutoff enrichment. Anal Chem. 2020;92(5):3751–57. doi:10.1021/acs.analchem.9b05081.
- Husson G, Delangle A, O’Hara J, Cianferani S, Gervais A, Van Dorsselaer A, Bracewell D, Carapito C. Dual data-independent acquisition approach combining global HCP profiling and absolute quantification of key impurities during bioprocess development. Anal Chem. 2018;90(2):1241–47. doi:10.1021/acs.analchem.7b03965.
- Abiri N, Pang J, Ou J, Shi B, Wang X, Zhang S, Sun Y, Yang D, Wang Z. Assessment of the immunogenicity of residual host cell protein impurities of OsrHSA. PLoS One. 2018;13(3):e0193339. doi:10.1371/journal.pone.0193339.
- Bailey-Kellogg C, Gutierrez AH, Moise L, Terry F, Martin WD, De Groot AS. CHOPPI: a web tool for the analysis of immunogenicity risk from host cell proteins in CHO-based protein production. Biotechnol Bioeng. 2014;111(11):2170–82. doi:10.1002/bit.25286.
- Jawa V, Joubert MK, Zhang Q, Deshpande M, Hapuarachchi S, Hall MP, Flynn GC. Evaluating Immunogenicity risk due to host cell protein impurities in antibody-based biotherapeutics. AAPS J. 2016;18(6):1439–52. doi:10.1208/s12248-016-9948-4.
- de Zafra CL, Quarmby V, Francissen K, Vanderlaan M, Zhu-Shimoni J. Host cell proteins in biotechnology-derived products: a risk assessment framework. Biotechnol Bioeng. 2015;112(11):2284–91. doi:10.1002/bit.25647.
- Huang L, Wang N, Mitchell CE, Brownlee T, Maple SR, De Felippis MR, Novel Sample A. A novel sample preparation for shotgun proteomics characterization of HCPs in antibodies. Anal Chem. 2017;89(10):5436–44. doi:10.1021/acs.analchem.7b00304.
- Pythoud N, Bons J, Mijola G, Beck A, Cianferani S, Carapito C. Optimized sample preparation and data processing of data-independent acquisition methods for the robust quantification of trace-level host cell protein impurities in antibody drug products. J Proteome Res. 2021, 20, 1, 923–931. DOI: 10.1021/acs.jproteome.0c00664.
- Kufer R, Haindl M, Wegele H, Wohlrab S. Evaluation of peptide fractionation and native digestion as two novel sample preparation workflows to improve HCP characterization by LC–MS/MS. Anal Chem. 2019;91(15):9716–23. doi:10.1021/acs.analchem.9b01259.
- Clavier S, Fougeron D, Petrovic S, Elmaleh H, Fourneaux C, Bugnazet D, Duffieux F, Masiero A, Mitra-Kaushik S, Genet B, et al. Improving the analytical toolbox to investigate copurifying host cell proteins presence: n-(4)-(β-acetylglucosaminyl)-l-asparaginase case study. Biotechnol Bioeng. 2020;117(11):3368–78. doi:10.1002/bit.27514.
- Ma J, Kilby GW. Sensitive, rapid, robust, and reproducible workflow for host cell protein profiling in biopharmaceutical process development. J Proteome Res. 2020;19(8):3396–404. doi:10.1021/acs.jproteome.0c00252.
- Pengelley S, Tremintin G, Evers W, Takanami Y, Liu X, Suckau D, Greig M. In depth analysis of host cell proteins from antibody preparations using PASEF. Bruker Application Note. 2018;LCMS–143.
- Doneanu CE, Anderson M, Williams BJ, Lauber MA, Chakraborty A, Chen W. Enhanced detection of low-abundance host cell protein impurities in high-purity monoclonal antibodies down to 1 ppm using ion mobility mass spectrometry coupled with multidimensional liquid chromatography. Anal Chem. 2015;87(20):10283–91. doi:10.1021/acs.analchem.5b02103.
- Johnson RO, Greer T, Cejkov M, Zheng X, Li N. Combination of FAIMS, Protein A depletion, and native digest conditions enables deep proteomic profiling of host cell proteins in monoclonal antibodies. Anal Chem. 2020;92(15):10478–84. doi:10.1021/acs.analchem.0c01175.
- Valente KN, Lenhoff AM, Lee KH. Expression of difficult-to-remove host cell protein impurities during extended Chinese hamster ovary cell culture and their impact on continuous bioprocessing. Biotechnol Bioeng. 2015;112(6):1232–42. doi:10.1002/bit.25515.
- Aboulaich N, Chung WK, Thompson JH, Larkin C, Robbins D, Zhu M. A novel approach to monitor clearance of host cell proteins associated with monoclonal antibodies. Biotechnol Prog. 2014;30(5):1114–24. doi:10.1002/btpr.1948.
- Esser-Skala W, Segl M, Wohlschlager T, Reisinger V, Holzmann J, Huber CG. Exploring sample preparation and data evaluation strategies for enhanced identification of host cell proteins in drug products of therapeutic antibodies and Fc-fusion proteins. Anal Bioanal Chem. 2020;412(24):6583–93. doi:10.1007/s00216-020-02796-1.
- Zhang Q, Goetze AM, Cui H, Wylie J, Trimble S, Hewig A, Flynn GC. Comprehensive tracking of host cell proteins during monoclonal antibody purifications using mass spectrometry. MAbs. 2014;6(3):659–70. doi:10.4161/mabs.28120.
- Ranjan S, Chung WK, Hofele R, Heidbrink Thompson J, Bee J, Zhang L, Robbins D, Cramer SM. Investigation of cathepsin D–mAb interactions using a combined experimental and computational tool set. Biotechnol Bioeng. 2019;116(7):1684–97. doi:10.1002/bit.26968.
- Bee JS, Machiesky LM, Peng L, Jusino KC, Dickson M, Gill J, Johnson D, Lin HY, Miller K, Heidbrink Thompson J, et al. Identification of an IgG CDR sequence contributing to co-purification of the host cell protease cathepsin D. Biotechnol Prog. 2017;33(1):140–45. doi:10.1002/btpr.2397.
- Tran B, Grosskopf V, Wang X, Yang J, Walker D Jr., Yu C, McDonald P. Investigating interactions between phospholipase B-Like 2 and antibodies during Protein A chromatography. J Chromatogr A. 2016;1438:31–38. doi:10.1016/j.chroma.2016.01.047.
- Singh JA, Wells GA, Christensen R, Tanjong Ghogomu E, Maxwell L, Macdonald JK, Filippini G, Skoetz N, Francis D, Lopes LC, et al. Adverse effects of biologics: a network meta-analysis and Cochrane overview. Cochrane Database Syst Rev. 2011;Feb 16;2011(2):CD008794. doi: 10.1002/14651858.CD008794.pub2.
- Boyman O, Comte D, Spertini F. Adverse reactions to biologic agents and their medical management. Nat Rev Rheumatol. 2014;10(10):612–27. doi:10.1038/nrrheum.2014.123.
- Sisodiya VN, Lequieu J, Rodriguez M, McDonald P, Lazzareschi KP. Studying host cell protein interactions with monoclonal antibodies using high throughput protein A chromatography. Biotechnol J. 2012;7(10):1233–41. doi:10.1002/biot.201100479.
- Kornecki M, Mestmacker F, Zobel-Roos S, Heikaus de Figueiredo L, Schluter H, Strube J. Host cell proteins in biologics manufacturing: the good, the bad, and the ugly. Antibodies (Basel). 2017;6 (3):13. doi: 10.3390/antib6030013.
- Yuk IH, Nishihara J, Walker D Jr., Huang E, Gunawan F, Subramanian J, Pynn AF, Yu XC, Zhu-Shimoni J, Vanderlaan M, et al. More similar than different: host cell protein production using three null CHO cell lines. Biotechnol Bioeng. 2015;112(10):2068–83. doi:10.1002/bit.25615.
- Park JH, Jin JH, Ji IJ, An HJ, Kim JW, Lee GM. Proteomic analysis of host cell protein dynamics in the supernatant of Fc-fusion protein-producing CHO DG44 and DUKX-B11 cell lines in batch and fed-batch cultures. Biotechnol Bioeng. 2017;114(10):2267–78. doi:10.1002/bit.26360.
- Park JH, Jin JH, Lim MS, An HJ, Kim JW, Lee GM. Proteomic analysis of host cell protein dynamics in the culture supernatants of antibody-producing CHO cells. Sci Rep. 2017;7(1):44246. doi:10.1038/srep44246.
- Chiu J, Valente KN, Levy NE, Min L, Lenhoff AM, Lee KH. Knockout of a difficult-to-remove CHO host cell protein, lipoprotein lipase, for improved polysorbate stability in monoclonal antibody formulations. Biotechnol Bioeng. 2017;114(5):1006–15. doi:10.1002/bit.26237.
- Nie S, Greer T, O’Brien Johnson R, Zheng X, Torri A, Li N. Simple and sensitive method for deep profiling of host cell proteins in therapeutic antibodies by combining ultra-low trypsin concentration digestion, long chromatographic gradients, and boxcar mass spectrometry acquisition. Anal Chem. 2021;93(10):4383–90. doi:10.1021/acs.analchem.0c03931.
- Huang Y, Molden R, Hu M, Qiu H, Li N. Toward unbiased identification and comparative quantification of host cell protein impurities by automated iterative LC–MS/MS (HCP-AIMS) for therapeutic protein development. J Pharm Biomed Anal. 2021;200:114069. doi:10.1016/j.jpba.2021.114069.
- Silva JC, Gorenstein MV, Li GZ, Vissers JP, Geromanos SJ. Absolute quantification of proteins by LCMSE: a virtue of parallel MS acquisition. Mol Cell Proteomics. 2006;5(1):144–56. doi:10.1074/mcp.M500230-MCP200.
- Claydon A, Widdowson P, Williamson A. Residual host cell protein analysis of NISTmAb: from simplified sample preparation to reliable results. Thermo Scientific Application Note. 2020;73412.