
 ?Mathematical formulae have been encoded as MathML and are displayed in this HTML version using MathJax in order to improve their display. Uncheck the box to turn MathJax off. This feature requires Javascript. Click on a formula to zoom.
ABSTRACT
Subcutaneous injection is the preferred route of administration for many antibody therapeutics for reasons that include its speed and convenience. However, the small volume limit (typically 2 mL) for subcutaneous delivery often necessitates antibody formulations at high concentrations (commonly ≥100 mg/mL), which may lead to physicochemical problems. For example, antibodies with large hydrophobic or charged patches can be prone to self-interaction giving rise to high viscosity. Here, we combined X-ray crystallography with computational modeling to predict regions of an anti-glucagon receptor (GCGR) IgG1 antibody prone to self-interaction. An extensive mutational analysis was undertaken of the complementarity-determining region residues residing in hydrophobic surface patches predicted by spatial aggregation propensity, in conjunction with residue-level solvent accessibility, averaged over conformational ensembles from molecular dynamics simulations. Dynamic light scattering (DLS) was used as a medium throughput screen for self-interaction of ~ 200 anti-GCGR IgG1 variants. A negative correlation was found between the viscosity determined at high concentration (180 mg/mL) and the DLS interaction parameter measured at low concentration (2–10 mg/mL). Additionally, anti-GCGR variants were readily identified with reduced viscosity and antigen-binding affinity within a few fold of the parent antibody, with no identified impact on overall developability. The methods described here may be useful in the optimization of other antibodies to facilitate their therapeutic administration at high concentration.
Introduction
Antibody therapeutics have emerged as a major class of drugs, with over 100 antibodies approved for use across diverse targets and disease areas.Citation1 The field continues to grow rapidly as evidenced by the > 1,000 antibody therapeutics in clinical trials.Citation2 The remarkable versatility of antibodies stems from their vast sequence diversity, modular architecture and multi-functionality. These antibody attributes have enabled the design of a plethora of alternative molecular formats to support many different mechanisms of action.Citation3 Antibody formats include fragments, antibody-drug conjugates, bispecific and multi-specific antibodies, as well as antibody fusion proteins.Citation3 Taken together, these advances have opened new avenues for antibody-based therapeutics, allowing for the treatment of many serious human diseases.
Determining the optimal delivery methods is a critical aspect of antibody drug development. Approximately 66% and 29% of antibody therapeutics are currently delivered by intravenous (IV) infusion and subcutaneous (SC) injection, respectively.Citation3 Substantial efforts have been devoted to promoting the transition from IV to SC delivery due to its reduced costs, simplified administration, and improved patient convenience.Citation4,Citation5 SC injection is often preferred over IV infusion for chronic diseases that require periodic dosing over extended periods.Citation4,Citation5 However, SC administration of antibody therapeutics is typically constrained to low dosing volumes (2 mL) and the need for stable high-concentration (
100 mg/mL) formulations.Citation6 Such high concentrations can lead to unfavorable antibody behavior, including high viscosity, insufficient solubility, aggregation, gelation, and opalescence.Citation4,Citation7 A viscosity limit of
20 centipoise (cP) is considered acceptable for SC delivery and is typically well-tolerated without significant injection site pain.Citation6,Citation8
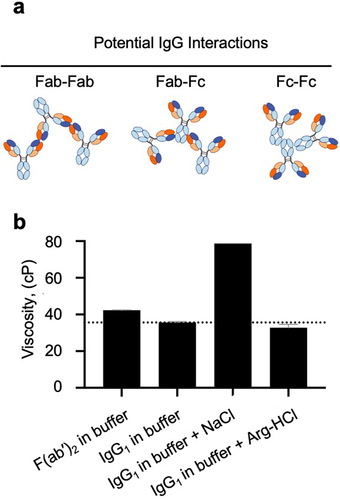
Elevated viscosity in high-concentration protein solutions has been primarily attributed to transient self-interactions.Citation9–12 A priori, self-interactions contributing to the high viscosity of IgG antibodies may include Fab-Fab, Fab-Fc, and Fc-Fc interactions (). However, evidence to date suggests that Fab-Fab and/or Fab-Fc interactions can be important but not, to our knowledge, Fc-Fc interactions.Citation11,Citation13,Citation14 These self-interactions collectively form an intricate network at elevated concentrations, ultimately leading to increased viscosity. The self-interactions responsible for high viscosity manifest as transient, reversible weak interactions among clusters of surface-exposed residues with similar properties, known as patches. Notably, negatively charged patches driving electrostatic interactions and hydrophobic patches driving hydrophobic interactions have been proposed as key risk factors for unfavorable viscosity profiles.Citation15–17
Figure 1. Dominant contribution of Fab-Fab interactions to the high viscosity of an anti-GCGR IgG1 antibody. (a) Cartoon illustrating possible modes of self-interaction involving different regions of IgG. (b) The viscosity of the anti-GCGR IgG1 parent antibody and its corresponding F(ab’)2 fragment was measured at 180 mg/mL in a low-salt buffer: 20 mM histidine acetate, pH 5.5 at 25 °C. The viscosity of the anti-GCGR IgG1 was also determined in the presence of the same buffer supplemented with either 180 mM NaCl or 180 mM arginine-HCl. The dotted line shows the viscosity of the IgG1 antibody in buffer alone as a reference.
Mitigating high viscosity by reducing self-interaction can be approached through two complementary strategies: optimization of formulationCitation6,Citation7 and protein engineering.Citation18–23 Formulation optimization is the preferred strategy to reduce viscosity if selection of the therapeutic antibody candidate has already been finalized. However, changing the formulation may not adequately resolve the challenges associated with high antibody concentration during the manufacturing process or during administration. Optimization of formulation includes adjustment of pH and the addition of excipients to reduce viscosity, such as L-arginine, L-proline, L-lysine, glycine and sodium chloride.Citation6 If the antibody therapeutic candidate is still being optimized, viscosity reduction via protein engineering may be preferred. Engineering strategies typically focus on altering antibody surface properties to improve their physicochemical properties and decrease the propensity for self-interaction. Assessing interaction propensity based on sequences or structures has become feasible with the emergence of numerous computational tools.Citation24 Reduction of viscosity has been achieved by decreasing negatively charged patchesCitation19 and by eliminating solvent-accessible aromatic residues.Citation18–23
We previously reduced the viscosity of an anti-glucagon receptor (GCGR) IgG1 antibody by up to 8-foldCitation21 using alanine-scanning mutagenesisCitation25 of selected aromatic residues in the complementarity-determining regions (CDRs). Here, we have undertaken a much more extensive mutational analysis of this anti-GCGR antibody to gain a deeper understanding of the molecular mechanisms underlying its high viscosity. First, we demonstrated that the high viscosity of the anti-GCGR antibody does not require its Fc region. Next, we solved the X-ray crystallographic structure of the anti-GCGR Fab and used computational approaches to identify surface hydrophobic and charge patches that might contribute to self-interaction. Extensive mutational analysis was performed on putative self-interaction hotspots, generating ~ 200 variants covering a broad range of amino acid replacements. Antibody self-interaction was first evaluated by dynamic light scattering (DLS) at low concentration followed by viscosity measurement at high concentration for selected variants. Our study revealed a negative correlation between the viscosity and the DLS interaction parameter, highlighting the potential of DLS as a predictive assay to complement other activity assays in early-stage drug discovery. This study provides insights into the basis of self-interaction and highlights an approach for improving the design and screening of antibodies with desired viscosity profiles at high concentrations.
Results
High level mapping of interactions contributing to high viscosity of anti-GCGR IgG1
First, we probed the different parts of an anti-GCGR IgG1 antibody contributing to its high viscosity at high concentration. The viscosity of the anti-GCGR IgG1 was found to be similar to its corresponding F(ab’)2 fragment lacking an Fc region (). These data support the notion that Fab-Fab interactions may be the most important contributing interactions for the high viscosity of this anti-GCGR IgG1. Therefore, subsequent investigations focused on probing the key aspects of Fab-Fab interactions. Next, we investigated the addition of some commonly used excipients to probe contributions of hydrophobic and/or electrostatic self-interactions to the high viscosity of the anti-GCGR IgG1. Specifically, we investigated the addition of sodium chloride (NaCl), which may attenuate electrostatic interactions and strengthen hydrophobic interactions,Citation26 or arginine-hydrochloride (Arg-HCl), which may attenuate both electrostatic and hydrophobic interactions.Citation27 The addition of Arg-HCl reduced the viscosity by 8% while the addition of NaCl increased the viscosity by 121% (). These data seem more consistent with the notion of Fab-Fab hydrophobic interactions rather than electrostatic interactions as the major contributors to the high viscosity of the anti-GCGR IgG1.
X-ray crystallographic structure of anti-GCGR Fab
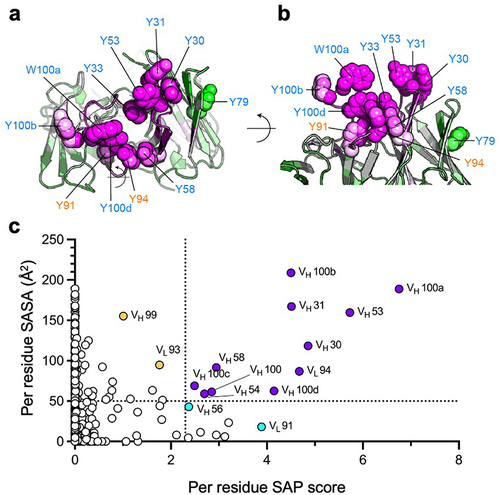
The crystal structure of the anti-GCGR Fab fragment was solved to 2.7 Å resolution (PDB entry 8TJT, , Figure S1 and Table S1) and used for surface property analysis and to probe sites of self-interaction. Four copies of the Fab were found within the crystallographic asymmetric unit. The four Fab structures were highly similar, with slight variations in the structures of the CDR H3 and L1 loops (Figure S2). The backbone conformations of the four copies were mostly well-defined in the H3 and L1 loops, but some side chain conformations remained unresolved due to limited electron density. This suggests static and/or dynamic flexibility of CDR H3 and CDR L1.
Figure 2. Anti-GCGR Fab self-interaction in the X-ray crystallographic structure (PDB entry 8TJT). (a) Head-to-head Fab-Fab interaction is shown, with one interacting Fab depicted in surface representation and the other in ribbon form. The LC and HC are colored orange and blue, respectively. The interaction interface in the CDRs is highlighted: CDR L2 (green), CDR H1 (yellow) and CDR H3 (magenta). (b, c) zoomed-in views of the interacting interface for both Fabs. The interacting residues, shared by both Fabs, are labeled and highlighted in the stick representation (c).
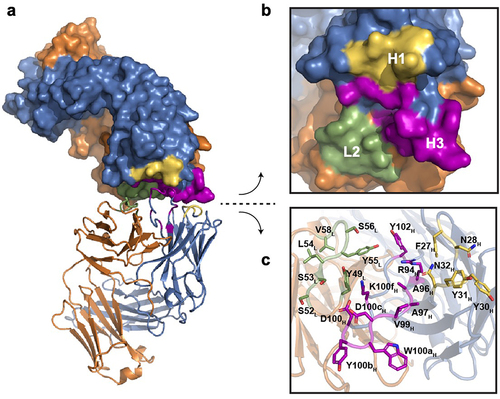
Fab-Fab crystallographic contacts are a solid phase phenomenon related to crystallization conditions. In addition, Fab-Fab contacts might conceivably provide some insights into sites of Fab self-interaction at high concentration in solution. A head-to-head Fab-Fab interaction interface was observed within the crystal lattice involving two copies from separate asymmetric units () analyzed by PISA.Citation28 The two interacting Fab molecules adopt the same sets of residues to interact, predominantly spanning the CDR regions, including L2, H1, and H3 (). The majority of the 22 residues involved in this crystallographic interface are hydrophobic ().
Surface property analysis of anti-GCGR Fab
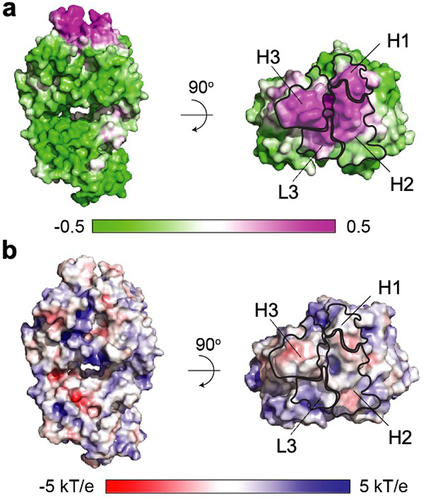
Computational surface profiling of the anti-GCGR Fab was undertaken to gain insights into molecular characteristics that might favor self-interaction at high concentration. Specifically, we focused on identifying hydrophobic and electrostatic patches since they are possible sources of self-interaction. The hydrophobic nature of the anti-GCGR Fab was investigated by calculating the spatial aggregation propensity (SAP)Citation29 (). To capture the influence of dynamic behavior of surface features, the residue-level SAP values were averaged over a conformational ensemble generated using four replicas of 20 ns molecular dynamics (MD) simulation. Each of the four copies within the crystallographic asymmetric unit was analyzed independently to investigate potential variations in surface properties resulting from different conformations in the CDR H3 and CDR L1 regions. Despite the conformational differences, the surface analysis results for all four Fab copies were highly similar (Figure S3 and Table S2). Consequently, the most well-defined Fab copy (namely, light chain (LC) B and heavy chain (HC) E in PDB structure 8TJT) was selected as the representative model for subsequent analysis. The SAP calculation revealed a significant hydrophobic patch spanning four of the six CDR loops, namely, L3, H1, H2, and H3 (). No major high-SAP sites were found in the CL and CH1 constant domains (Figure S4). Next, the electrostatic potential map of the anti-GCGR Fab was calculated at pH 5.5 () using the Adaptive Poisson-Boltzmann Solver (APBS).Citation30 Only small negatively charged patches were observed.
Figure 3. Surface property analysis of anti-GCGR Fab fragment. (a) The surface hydrophobic patch was evaluated using SAP.Citation29 the surface representation is color-coded based on the averaged SAP value calculated for each atom across all representative MD trajectories. The outlines of the four CDRs that overlap with the large hydrophobic patch (magenta) are shown. (b) The surface charge patch was analyzed based on the electrostatic potential map calculated by Adaptive Poisson-Boltzmann Solver (APBS)Citation30 on an averaged structure derived from MD trajectories.
This surface property analyses of the anti-GCGR Fab () in conjunction with the viscosity excipient study () led to the hypothesis that the computationally identified hydrophobic patch dominantly facilitates Fab-Fab self-association at high concentrations, contributing to the elevated viscosity of the anti-GCGR IgG1.
Mutation of aromatic CDRs residues led to varied effects on viscosity
We hypothesized that mutational disruption of the identified hydrophobic patch in the anti-GCGR antibody () would reduce viscosity. Specifically, we sought to reduce the size of the hydrophobic patch or introduce counteracting forces against hydrophobic interactions. We generated a set of single mutants by replacing each aromatic native residue that had a high SAP score (>2.3) with alanine (). LC residue VL Y96 was excluded due to its location at the VH/VL interface and its interaction with framework region (FR) residues. Alanine was chosen as the substitution because it is commonly used for mutational scanning and has extensive prior evidence supporting its ability to maintain the overall folding and integrity of the antibody structure.Citation31
Figure 4. Viscosity analysis of anti-GCGR IgG1 variants targeting aromatic residues with high SAP scores. (a) The per residue SAP score is plotted along the amino acid sequences of the anti-GCGR variable light (VL) and variable heavy (VH) domains. The six CDR regions are highlighted in shaded boxes. (b) Individual alanine mutations were introduced for each of the 10 parent aromatic residues with high SAP scores. The viscosity of these single mutants, together with a negative control mutant (VH Y79A), were measured at a concentration of 180 mg/mL by rheometry at 25.0°C in 20 mM histidine acetate, pH 5.5 (bars, left axis). The per residue SAP score for the selected sites is also shown (magenta symbols, right axis). Additionally, three double mutants combining two viscosity-reducing mutations were tested to evaluate any additive effects. The viscosity of the parent anti-GCGR antibody is shown as a reference with a dotted line.
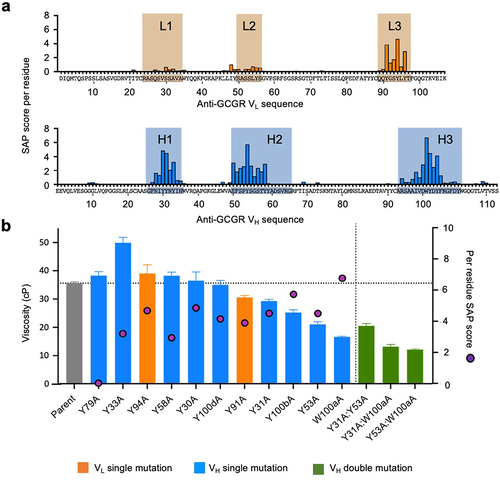
All single alanine variants were expressed, purified, and subjected to cone-and-plate rheometry. Alanine replacements of several aromatic residues with high SAP score and located within the hydrophobic patch reduced viscosity to varying extents, e.g., VL Y91A, VH Y31A, VH Y53A, VH W100aA, and VH Y100bA (). Pairing viscosity-reducing VH mutations can sometimes further reduce viscosity. For example, two different double mutants, VH Y31A:W100aA and VH Y53A:W100aA, reduced the viscosity of the anti-GCGR IgG1 to well below the 20 cP viscosity cutoff for SC delivery (). The VH Y79A variant was generated as a negative control as it has a low SAP score (0.008) and is located outside the hydrophobic patch and showed minimal effect on viscosity.
Although a high SAP score was predicted to contribute to high viscosity, several alanine variants with high SAP scores had minimal effect on viscosity, e.g., VL Y94A, VH Y58A, VH Y30A, and VH Y100dA, or even increased viscosity, e.g., VH Y33A (). Thus, a high SAP score alone is insufficient to consistently identify residues contributing to high viscosity. This finding motivated the search for additional parameters beyond high SAP score for identifying residues contributing to high viscosity.
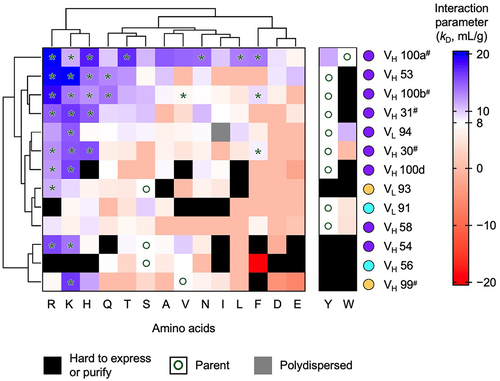
Strategy for deeper variable domain mutational analysis
By annotating all the selected sites in the native Fab structure (), it was apparent that the most significant viscosity-reducing sites (VH 31, VH 53, VH 100a, and VH 100b) protruded prominently from the protein surface (), making them highly accessible for forming interactions. This observation motivated us to evaluate solvent-accessible surface area (SASA)Citation32 in conjunction with SAP score for selecting which residues to mutate. Residues with high SASA (>50Å2 and high SAP score (>2.3) were selected for mutational analysis (). For a more comprehensive survey, additional sites with high SASA (>50Å2 and moderate SAP (1.0–2.3) scores as well as residues with moderate SASA (20–50Å2 and high SAP (>2.3) scores were selected. For each selected site, all possible mutations were introduced except for Gly, Pro, Met, and Cys. Gly and Pro were excluded because they sometimes induce significant structural changes, whereas Met and Cys were not considered because they are sometimes prone to oxidation. In total, ~200 anti-GCGR IgG1 variants were generated and characterized.
Figure 5. Selection of the anti-GCGR viscosity hotspot sites combining high SAP score and high SASA value. (a) The sphere representation provides a visual depiction of the distribution and conformation of the 11 selected sites, viewed from a perspective looking down towards the CDRs. (b) A side view perspective illustrates the position of the selected sites away from the surface. (c) The per residue SAP score and SASA value were calculated and plotted against each other for all variable domain sites within the anti-GCGR Fab fragment. The dotted lines indicate cutoff values used for high SASA value (50Å2 and high SAP score (
2.3). Sites with both high SASA value and high SAP scores (purple symbols) were selected for mutational analysis to evaluate their contribution to high viscosity. Additionally, representative sites in the high SASA value and low SAP region (yellow symbols) as well as in the low SASA value and high SAP region (cyan symbols) were also included to provide a more comprehensive analysis.
Deeper mutational studies enabled by DLS provides potential engineering strategies to mitigate high viscosity
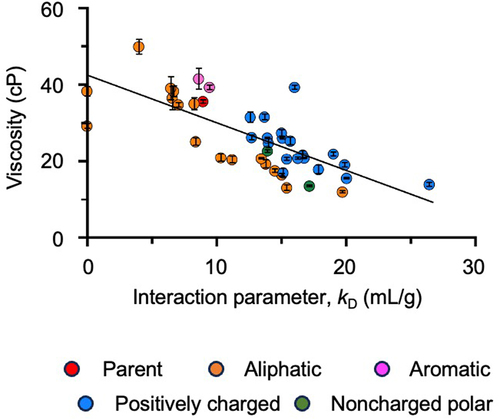
The relatively large amount of protein required to measure viscosity made it impractical to screen all IgG1 variants by rheometry. Instead, DLS was used as an initial screening tool to investigate self-interaction. The DLS interaction parameter was extracted through extrapolation of the linear regression of translational diffusion coefficients at varying concentrations of the antibody (2–10 mg/mL) in the same buffer conditions used for viscosity measurements (i.e., 20 mM histidine acetate, pH 5.5). The measured interaction parameter values were plotted in a heatmap using the parent anti-GCGR IgG1 (8 mL/g) as a baseline for comparison (). The heatmap was clustered in one dimension based upon amino acid residue type and in the second dimension based upon the residue position using Kabat numbering.Citation33,Citation34
Figure 6. Screening of DLS interaction parameters for ~ 200 anti-GCGR IgG1 variants. A heatmap is shown of interaction parameters measured at 25.0°C in 20 mM histidine acetate, pH 5.5. The baseline value of the DLS interaction parameter for the parent antibody (white, 8 mL/g) is compared with variants with higher (blue shades) and lower (red shades) interaction parameters. Variants with exceptionally low diffusion coefficient are highlighted (gray), indicating their polydispersed behavior in solution. The parental residues are labeled with open circles. Mutants with expression or purification issues or exhibited significant aggregation are also highlighted (black). The heatmap with hierarchical clustering based on the replacement amino acids and protein sites, shown as dendrograms displayed on the top and left, respectively. Tyr and Trp mutants were excluded from the clustering analysis due to missing values and their prevalence as native residues. The protein sites are labeled with the color-coded dots defined from the selection criteria in (). Highlighted variants (*) were selected for secondary screening by rheometry. Crystallographic contacts shared by both Fab fragments () are also shown (#).
Positively charged replacement residues (Lys, Arg and to a lesser extent His), commonly increased the interaction parameter, suggesting reduced self-association. In contrast, negatively charged replacement residues (Glu and Asp) decreased the interaction parameter in most cases, suggesting increased self-association. A possible explanation is that these negatively charged replacement residues both disrupt the hydrophobic patch and introduce an attractive electrostatic interaction with the positively charged constant domains. Noncharged polar replacement residues such as Gln, Asn, Ser, Thr, along with the small aliphatic residue Ala, had mixed effects on the interaction parameter, increasing it in a few cases (e.g., VH 100a). Large hydrophobic replacement residues (Phe, Val, Ile, and Leu), commonly decreased the interaction parameter, perhaps by enlarging the hydrophobic patch and favoring self-association. Tyr was the parent residue in many cases (). For the sites with non-Tyr parent residues, replacement by Tyr often leads to precipitation. Trp replacements commonly led to precipitation or a decrease in the DLS interaction parameter, suggesting increased self-association.
Correlation of viscosity with DLS interaction parameter
A subset of anti-GCGR IgG1 variants from the DLS study () were assessed for viscosity at high concentration. Specifically, 31 variants were selected spanning a broad range of interaction parameter values (0–26 mL/g) comparable, above or below that of the parent antibody (8 mL/g). These variants represent diverse replacement amino acid types: aliphatic, aromatic, positively charged and noncharged polar. Variants with a negative DLS interaction parameter were additionally planned for this study, but were lost due to precipitation during the spin concentration process and were therefore excluded from viscosity measurements. A negative correlation (−0.73 Pearson’s correlation coefficient) was observed between viscosity and DLS interaction parameter for the variants tested ().
Figure 7. Correlation between anti-GCGR IgG1 viscosity measured at 180 mg/mL and the DLS interaction parameter (kD) measured at 2–10 mg/mL. Data shown include 31 variants from the DLS study ( plus 10 Ala single mutants (). Data are color-coded based on the residue type of the replacement amino acid. The Pearson’s correlation efficient between the two sets of measurements was calculated as − 0.73. The solid black line represents the Pearson linear regression fit.
Multi-parameter optimization of anti-GCGR variants
Simultaneous optimization of multiple properties is highly desirable in the generation of therapeutic antibody clinical candidates. For example, when overcoming high viscosity, it is desirable to maintain or even improve the antigen-binding affinity and/or biologic functions of the antibodies. This concept was tested here by combining DLS measurement with evaluation of antigen-binding affinity by surface plasmon resonance (SPR) (). Nine antibody single amino acid variants were identified that meet the dual criteria of binding affinities within 5-fold of the parent antibody and an increased interaction parameter of ≥12 mL/g (). Seven of these nine antibody variants (VH W100aL, VH W100aV, VH Y100bK, VH Y100bQ, VH Y100bR, VH Y30H, and VL Y94K) substantially reduced viscosity (17.1–25.4 cP) compared to the parent antibody (35.6 cP) ().
Figure 8. Parallel screening of anti-GCGR IgG1 variants for DLS interaction parameter (kD) and antigen-binding affinity (KD). The binding affinity of the anti-GCGR mutants to the extracellular domain of GCGR was determined by SPR. Variants with an interaction parameter of >12 mL/g and binding affinities within 5-fold of the parent antibody are highlighted (green symbols). The parent antibody is also shown (red symbol).
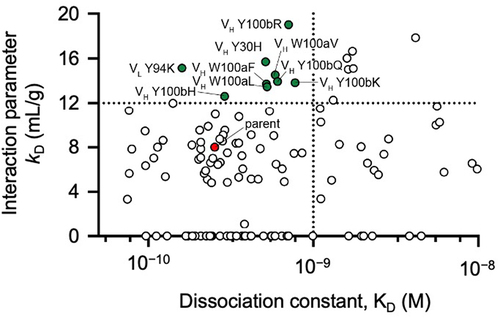
Table 1. Multiparameter optimization for anti-GCGR IgG1 variants. Shown are anti-GCGR variants with increased DLS interaction parameter and reduced viscosity compared to the parent antibody and with antigen-binding affinities within 5-fold. Computational developability analysis was conducted using the therapeutic antibody profiler (TAP).Citation38 The amber TAP flag identified for the VH W100aL variant was for surface hydrophobicity. Also shown are the calculated isoelectric points for the Fv fragment, polyspecificity from the baculovirus ELISACitation35 and predicted immunogenic T cell epitopes using NetMHCIIpan-4.0 EL.Citation36 The humanness score was determined from the OASis percentile.Citation37 for all variants the available experimental and computational data are listed (Table S3) as are the corresponding amino acid sequences (Table S4).
These seven lead variants were further screened for other attributes to assess their potential suitability as therapeutic antibody candidates (). Additional properties evaluated were: 1) polyspecificity using a baculovirus ELISA,Citation35 2) immunogenicity risk as judged by prediction of T cell epitopes using NetMHCIIpan-4.0 EL,Citation36 3) humanness score using OASis,Citation37 4) in silico developability risk flags using the Therapeutic Antibody Profiler (TAP),Citation38 and 5) isoelectric point (pI) using Biopython. For five variants, the baculovirus scores were lower than the parent antibody, consistent with the notion of reduced polyspecificity and low risk for rapid clearance.Citation35 The other two lead variants (VH Y30H and VL Y94K) showed slightly elevated baculovirus ELISA compared to the parent, suggesting similar or slightly increased polyspecificity. The number of predicted T cell epitopes was identical to the parent (n = 12) or slightly lower (n = 11) for all lead variants. The humanness score was unchanged from the parent sequence for all lead variants except for a small decrease for the LC of the VL Y94K variant. The TAP analysis revealed no alert flags for the lead variants with one exception, namely, a single amber alert flag for surface hydrophobicity for the VH W100aL variant ( and Table S3). Calculated Fv pIs were unchanged for four variants, with only minor perturbations (~0.5 unit increase) for three positively-charged variants (VH Y100bR, VH Y100bK and VH Y94K). Thus, compared to the parent antibody, the seven lead variants showed very few differences and no major developability concerns were identified ().
Discussion
Hydrophobic patches in CDRs contribute to high viscosity of anti-GCGR antibody
Understanding and mitigating antibody self-interaction is critical to the development of antibody therapeutics, particularly those requiring high concentration formulation for SC delivery. Antibody self-interactions contributing to high viscosity commonly involve electrostatic and/or hydrophobic interactions, although electrostatic interactions are believed to be key, at least for some antibodies.Citation19 Here we used Fab structure determination, in conjunction with computational modeling of surface properties and extensive mutational analysis, to probe the molecular basis of the high viscosity of an anti-GCGR IgG1 antibody.Citation21
The viscosity of the anti-GCGR IgG1 was found to be independent of the presence of its Fc region, consistent with the variable domains contributing to its high viscosity (). The addition of NaCl as an excipient increased the viscosity of this antibody, suggesting hydrophobic rather than electrostatic interactions being major contributors to viscosity. The X-ray crystallographic structure of the anti-GCGR Fab was determined () and used for a computational analysis of its surface properties (). Strong evidence was found for a large hydrophobic patch involving residues in CDR L3, H1, H2 and H3, whereas little evidence for electrostatic patches (). Alanine replacements of large hydrophobic CDR residues (Trp and Tyr) in the hydrophobic patch were predicted to reduce viscosity, but did so in only some cases (). Thus, hydrophobicity, as evaluated using SAP score,Citation29 was not sufficient to consistently identify residues contributing to high viscosity.
Combined use of SAP and SASA scores to guide mutational analysis
High solvent accessibility (SASA >50Å2 in conjunction with high SAP score (>2.3) were evaluated next as dual criteria for selecting residues for extensive mutational analysis (). Although the SAP modelCitation29 already considers side-chain SASA, incorporating SASA alongside SAP scores improves the residue selection criterion in our mutational analysis. This improvement is likely attributed to the significance of the residue sizes in intermolecular interactions pertinent to viscosity. The SAP method normalizes amino acid side-chain SASA values in the folded structure against their SASA in free solution.Citation29 The intention behind this normalization is to emphasize the hydrophobic impact of smaller residues like Val compared to relatively larger yet less hydrophobic ones like Met, which are crucial for predicting aggregation propensity.Citation29 However, this normalization may underestimate the size factor of surface-exposed hydrophobic amino acids, notably the aromatic residues (Tyr, Phe, Trp), which seem to govern the transient intermolecular interactions affecting viscosity. Therefore, the direct inclusion of residue-level SASA alongside SAP scores in our analysis improves its ability to simultaneously capture the size effect and accessibility of residues and their contribution to hydrophobic patches that facilitate self-interactions.
DLS to assess antibody self-interaction
The relatively large scale of this study with ~ 200 antibody variants necessitated the use of a higher throughput method than rheometry for studying antibody self-interaction. DLS was successfully used by Kingsbury et al. as a tool to survey the self-interaction of a highly diverse panel of IgG antibodies.Citation39 Indeed, DLS was found to be the single most useful molecular descriptor for predicting unfavorable solution behavior including high viscosity.Citation39 Our study extends this prior work by demonstrating that viscosity can negatively correlate with DLS interaction parameter values for a panel of single mutants for a specific antibody. Additionally, DLS in conjunction with rheometry was used to identify antibody variants with reduced viscosity (). Positively charged amino acid replacements were found to be particularly effective in reducing viscosity, perhaps by disrupting the hydrophobic patch and introducing electrostatic repulsion with positively charge constant domains.
One limitation of DLS for studying protein self-interaction is that it requires relatively large amounts of purified protein (≥1 mg per replicate).Citation40 The development of higher throughput protein-interaction assay technologies requiring less protein might broaden the applicability of mutational analysis in studying high viscosity. Promising technologies in this regard include microfluidicsCitation41,Citation42 and different types of self-interaction nanoparticle spectroscopy.Citation43–45
Experimental structures versus models for surface property analysis
The surface property analysis of the anti-GCGR Fab undertaken here to identify hydrophobic and electrostatic patches () utilized an experimentally determined crystallographic structure (). However, experimental Fab structures are not always available, particularly in the early stages of antibody discovery. A structural model for the anti-GCGR Fab was generated using AbodyBuilder2.Citation46 Surface property analysis from the model was then compared with that from the experimental structure (Figure S5 and S6). The surface analysis from the model supported similar conclusions for hydrophobic sites in CDR L3, H1, and H2, but underestimated the significance of hydrophobic sites in CDR H3. Thus, the methods presented here may still be potentially useful using antibody molecular models in the absence of an experimental structure. Improvement in the accuracy of CDR H3 prediction seems likely to improve the reliability of this surface prediction.
Multi-parameter optimization of anti-GCGR variants
Multi-parameter optimization is commonly desirable in generating clinical candidates for antibody therapeutics and may require balancing of conflicting properties. Here we have shown that it is possible to reduce the self-interaction of an anti-GCGR antibody and maintain antigen-binding affinity within a few-fold of the parent antibody (). However, Gupta et al. demonstrated that there are strong trade-offs in co-optimizing antibodies to minimize both nonspecific antibody binding and self-association.Citation47
Seven anti-GCGR variants were identified with increased DLS interaction parameter, and reduced viscosity compared to the parent antibody whilst maintaining antigen-binding affinity within 5-fold (). These lead anti-GCGR variants were screened for additional developability criteria. Fortuitously, the variants were very similar to the parent antibody when assessed for polyspecificity by baculovirus ELISA,Citation35 predicted immunogenic epitopes using NetMHCIIpan-4.0 EL,Citation36 humanness using OASis,Citation37 computational developability using TAP,Citation38 and pI (). A single amber flag for surface hydrophobicity was predicted from TAP analysis of one variant (VH W100aL). Thus, in this study it was readily possible to identify anti-GCGR variants with reduced viscosity with only minor effects on affinity and apparently without adventitiously accruing any major unfavorable properties.
The methods developed here can likely be adapted to help identify other antibodies with low viscosity and additional desirable attributes such as high affinity antigen binding. Antibodies identified in this manner may be suitable for therapeutic administration at high concentration, including by SC delivery. Further development of methods for multi-parameter optimization of antibodies seems desirable, including computational design assisted by machine learning.Citation48
Materials and methods
Plasmid construction and mutagenesis
Mutant plasmids were generated based on previously cloned mammalian expression pRK5 vectors (Genentech) for the HC and LC of the anti-GCGR IgG1 antibody.Citation21 The antibody variable domain sequences were numbered following the numbering scheme of KabatCitation33,Citation34 and the constant domain sequences were numbered using the Eu numbering scheme.Citation49 The mutations were introduced using the Golden Gate cloning technique, following an established protocol.Citation50 Single-stranded DNA primers of 25 to 29 nucleotides in length covering the target mutations were used to generate double-stranded DNA fragments containing the BsaI cutting sites on both ends. PCR reactions were performed using PrimeStar HS DNA polymerase (Takara Bio) under standardized amplification conditions. The PCR products were then purified using the Wizard SV 96 PCR clean-up system (Promega). Purified DNA fragments were digested with BsaI-HFv2 (New England Biolabs) to create compatible overhangs and were ligated using T4 ligase in a one-pot reaction (New England Biolabs). The resulting plasmids were sequenced to confirm the presence of the desired mutations. The amino acid sequences of all anti-GCGR variants are listed in Table S4.
Antibody and antigen expression and purification
All anti-GCGR parent and mutant full-length IgG1 antibodies, as well as anti-GCGR Fab, were transiently expressed in cultures of Chinese hamster ovary (CHO) cells. The purification was carried out using a two-step protocol by protein A affinity chromatography followed by size exclusion chromatography (SEC), as described previously.Citation51 F(ab’)2 fragments were obtained by digestion of IgG1 with IdeS followed by purification using CH1-XL affinity resin as previously described.Citation21 The extracellular domain of GCGR was expressed and purified following a published protocol.Citation52 Briefly, the antigen was expressed in suspension Sf9 cells and initially batch purified using HisPur Ni-NTA resin (Thermo Fisher Scientific). The His-tag was then cleaved using TEV protease and the tag-free protein was collected by flowing through the Ni-NTA column. Further purification was achieved using SEC.
X-ray structure determination of anti-GCGR Fab
Purified anti-GCGR Fab was buffer-exchanged into a low-salt buffer (20 mM histidine acetate, pH 5.5) and concentrated to 20 mg/mL. Crystals were formed by mixing 0.1 µL of the protein with 0.1 µL crystallization buffer (0.2 M sodium citrate, 20% (v/v) polypropylene glycol 3350, 0.1 M lithium chloride) in CrystalQuick 96-well sitting-drop plates (Hampton Research) before incubation over 1–3 weeks at 20 ± 0.5°C. The crystals were harvested in mother liquor supplemented with 20% (v/v) glycerol before being flash frozen in liquid nitrogen. X-ray diffraction data were collected at the Lawrence Berkeley National Laboratory Advanced Light Source Beamline 5.0.2 under cryogenic conditions. X-ray diffraction data were indexed and scaled with XDSCitation53 before merging in AIMLESSCitation54 with an applied resolution cutoff of 2.7 Å based on the half-dataset correlation coefficient CC1/2.Citation55 Phasing was done using molecular replacement with a reported antibody targeting the same antigen (PDB code: 4ERS). The model was iteratively built in COOTCitation56 and refined using PHENIX.refineCitation57,Citation58 with XYZ (reciprocal-space), XYZ (real space), individual B-factors, occupancies, translation/libration/screw (TLS) parameters, stereochemistry, and grouped atomic displacement parameters restraints.
Fab surface property analysis
All the missing amino acid residues in the anti-GCGR Fab structure (PDB 8TJT) were added and minimized using MOE.Citation59 For APBS analysis, the protonation states of residues were determined with the pdb2pqr tool,Citation60 which uses PropKa internally.Citation61,Citation62 Per atom SAP values were calculated using an in-house implementation of a previously published method.Citation29 To obtain per residue SAP scores, the SAP values of individual atoms within a residue were summed (Table S2). Only the positive SAP values of the atoms were considered for the calculation.Citation63
To obtain ensemble-averaged SAP scores and SASA values, MD simulations were performed using the following protocol. The GPU implementation of Amber 2019Citation64 MD software package was used for the MD simulation.Citation65,Citation66 The Fab or Fv structures were parameterized with FF14SB protein force field.Citation67 The assembly was then solvated in a cubic box of TIP3P water modelCitation68 with a minimum 8 Å distance from the edge of the box. The system charge was neutralized with sodium (Na+) and chloride (Cl–) counter ions. Hydrogen mass repartitioning was performed on the solute atoms to enable a simulation time step of 4 fs. The solvated systems were relaxed, heated and equilibrated using the protocols in our previous publication.Citation21 The production stage of the MD simulation was performed for 20 ns using constant-temperature, constant pressure ensemble (NPT) conditions. Default values were used for all other simulation parameters. The protocol described above was repeated to generate 5 independent replicates of 20 ns trajectories, adding up to 100 ns trajectories for each structure. 174 frames were extracted from the combined trajectories that were evenly spaced in time. Average values over all the frames were used to obtain residue-level SAP scores. For each structure extracted from MD trajectories, the SASA for each atom was computed using the MSMS packageCitation32 with a probe radius of 1.4 Å and a triangle density of 3 Å−2. The residue-level SASA values were determined by summing the atom-level SASA within each residue. The final residue-level SASA values were derived by averaging these summed values across all frames (Table S2).
Sample buffer exchange for rheometry and DLS
Dialysis using Slide-A-Lyzer Mini dialysis devices with a 10 kDa molecular weight cutoff was performed to buffer-exchange protein samples larger than 0.5 mL (Thermo Fisher Scientific). Two rounds of buffer exchange were conducted, with each round involving a volume of more than 100 times the sample volume. NAP-5 columns (Cytiva) were used to buffer-exchange small volume protein samples. The buffer-exchanged protein samples were concentrated to the desired working concentrations using 10 kDa MWCO Amicon-Ultra centrifugal tubes (MilliporeSigma).
DLS
All variants used in DLS measurement exhibited a monomer species > 95% as determined by analytical SEC except for 7 variants showing 91–95% monomer species: VH Y100dR (92.5%), VH Y58T (92.1%), VH Y58F (93.6%), VL Y91K (91.0%), VL Y91W (94.9%), VL Y93W (94.1%), VL Y94H (94.2%). Concentrated antibody stocks (>10 mg/mL) in working buffer (20 mM histidine acetate, pH 5.5) were first filtered using a filtering plate (Orochem) to remove any large particles that might interfere with DLS measurements. The filtered antibody solutions were then diluted into a range of concentrations (10, 8.0, 6.0, 4.0, and 2.0 mg/mL) using the same buffer freshly filtered with a 0.2 µm filter. Quadruplicate 30 µL aliquots of each concentration were loaded into a 384-well plate (Aurora Microplates). To ensure accurate measurements, the air bubbles were removed by centrifugation of microtiter plates for 5 min at 1,500 rpm. DLS data was collected using a DynaPro Plate Reader III (Wyatt). Three data sets of 30s each were acquired per sample at 25°C. The autocorrelation curves were fitted with a cumulant fit. Data points with low polydispersity (<10%) and good fitting quality (sum of squares, 0.02) were used for the following analysis. The resulting effective diffusion coefficient (D) measured at different concentrations was then used to extrapolate the diffusion interaction parameter (kD) and diffusion coefficient of the molecule (D0) at an infinitesimally low concentration through linear regression with the concentration (c), following the equation:
For samples that did not show a valid linear correlation (P-value < 0.05) and exhibited an overall standard deviation of D among measurements at different concentrations < 6.5 × 10⁻⁹ cm2 s−1 (approximately 1.3%), the diffusion coefficient was considered to be independent of concentration, and the kD value was assigned to value of 0.
Viscosity measurements
Buffer-exchanged samples were concentrated to a target concentration of 180 mg/mL. The final concentration was determined gravimetrically. Briefly, 3 µL of concentrated antibody solution was diluted in 1,000 µL of the corresponding working buffer. The masses of the solution before and after dilution were measured to calculate the dilution factor. The density of the diluted sample was assumed to be 0.999 g/mL, while the density of the concentrated solution was calculated based on predicted osmolality.Citation69 The concentration of the diluted solution was measured using 8453 spectrometer (Agilent) in a 10 mm quartz absorption cuvette (Hellma). The extinction coefficient for each variant was calculated based on the corresponding amino acid sequences (Table S4). The computed extinction coefficients were used to calculate the concentration from the absorbance at 280 nm (A280). Viscosity measurements were performed on a Discovery HR-30 rheometer (TA Instruments) equipped with a cone-and-plate geometry with 20 mm diameter and 1.01306° angle. Triplicate protein samples (40 µL) were loaded onto the sample plate for each measurement. After incubation at 25°C for 0.5 min, the viscosity was recorded 10 times during a 2 min time frame using a constant sheer rate of 1,000 s−1. The final viscosity was reported as the mean values of the total of 30 reads.
Surface plasmon resonance
The binding affinity of all generated variants was determined by SPR on a Biacore 8K+ (Cytiva). 3 µg/mL of antibody samples were flowed through at a flow rate of 10 µl/min for 1 min to be captured on a series S sensor chip Protein A (Cytiva). Injection of the antigen at a range of concentrations (0.2, 1, 2.5, and 5 nM) in HBS-EP buffer (100 mM HEPES, pH 7.4, 150 mM NaCl, 3 mM EDTA, 0.05% (v/v) polysorbate 20) was then conducted at a flow rate of 100 µL/min at 37°C. The association was monitored for 3 min and the dissociation was monitored for 10 min. The sensorgrams were analyzed by reference and blank subtraction, followed by fitting to a one-to-one Langmuir binding model supplied by the Biacore insight evaluation software (Version 4.0.8) to determine the kinetic constants and dissociation constant.
Baculovirus ELISA
The polyspecificity of lead anti-GCGR variants was assessed using a baculovirus ELISA as previously described.Citation35
Computation of pI and TAP descriptor values and flags
The pI values for all anti-GCGR variants as Fv fragments and also IgG1 were calculated from their amino acid sequencesCitation70,Citation71 using the IsoelectricPoint class from Biopython. The five individual TAP scoresCitation72 were computed for all anti-GCGR variants using a containerized version of the software licensed from OxPig (Table S3).
In silico prediction of immunogenic T cell epitopes
The presence of immunogenic T cell epitopes in the parent and lead anti-GCGR variants was assessed computationally using NetMHCIIpan-4.0 ELCitation36 for nine common HLA-DR alleles (HLA-DRB1 × 01:01, HLA-DRB1 × 03:01, HLA-DRB1 × 04:01, HLA-DRB1 × 07:01, HLA-DRB1 × 08:01, HLA-DRB1 × 09:01, HLA-DRB1 × 11:01, HLA-DRB1 × 13:01, and HLA-DRB1 × 15:01). 12–20-mer peptides were considered to be strongly presented on HLA-DR if the relative HLA-II presentation ranking was within the top 10%. Epitopes predicted to be presented on more than one HLA-DR molecule were defined as potential promiscuous epitopes. To identify potential immunogenic T cell epitopes in the Fab region for each molecule, we searched the natural antibody repertoire (Observed Antibody Space (OAS))Citation73 for similar nine-mer peptides using the BioPhi humanness analysis tool.Citation37 Epitopes found in over 93% of OAS human subjects were removed from further analysis. Epitopes were excluded if their sequence was identically aligned to nine-mer peptides from the human proteome as identified using PEPMatch.Citation74 Of the remaining epitopes, only those predicted to bind to more than one HLA-DR molecule were considered potentially immunogenic T cell epitopes.
Abbreviations
| CDR | = | Complementarity-determining region |
| CHO | = | Chinese hamster ovary |
| cP | = | Centipoise |
| DLS | = | Dynamic light scattering |
| FR | = | Framework region |
| GCGR | = | Glucagon receptor |
| HC | = | Heavy chain |
| IV | = | Intravenous |
| kD | = | Diffusion interaction parameter |
| LC | = | Light chain |
| MD | = | Molecular dynamics |
| pI | = | Isoelectric point |
| SAP | = | Spatial aggregation propensity |
| SASA | = | Solvent accessible surface area |
| SC | = | Subcutaneous |
| SEC | = | Size-exclusion chromatography |
| SPR | = | Surface plasmon resonance |
| TAP | = | Therapeutic antibody profiler |
| TLS | = | Translation/libration/screw |
| VH | = | Heavy chain variable domain |
| VL | = | Light chain variable domain |
Dai SI Table S4.docx
Download MS Word (13.2 KB)Dai Fig S1.jpeg
Download JPEG Image (313.1 KB)
Dai Fig S6.jpeg
Download JPEG Image (127.4 KB)
Dai SI Table S2.docx
Download MS Word (39.6 KB)Dai SI Table S1.docx
Download MS Word (8.3 KB)Dai SI Table S3.docx
Download MS Word (23.2 KB)Dai Fig S2.jpeg
Download JPEG Image (204.5 KB)
Dai Fig S5.jpeg
Download JPEG Image (374.3 KB)
Dai Fig S4.jpeg
Download JPEG Image (138.2 KB)
Dai Fig S3.jpeg
Download JPEG Image (470 KB)
Acknowledgments
We thank the Research Materials group in the Cell Culture Department at Genentech for their valuable assistance in mammalian cell expression. Additionally, we thank the protein purification team in the Protein Chemistry Department at Genentech for antibody purification and characterization. We acknowledge Daniel Kovner for providing support and guidance with the DLS and rheometry experiments. We are grateful to Claudio Ciferri for insightful discussions on strategies for obtaining the free Fab structures. We thank Jawahar Sudhamsu and Jennifer Kung for their guidance in data analysis for the anti-GCGR Fab crystal structure determination. We thank Sam Burns and Alexander Dimmling for creating the automation scripts for conducting bulk buffer exchange. We thank Greg Martyn and Makaeel Sheikh for baculovirus assay data and Jack Bevers III for help with SPR. We gratefully acknowledge the Advanced Light Source, a national user facility operated by Lawrence Berkeley National Laboratory on behalf of the Department of Energy, for providing access to their X-ray diffraction data collection infrastructure.
Disclosure statement
All authors are current or former employees of Genentech, Inc, which develops and commercializes therapeutics, including antibodies.
Supplementary material
Supplemental data for this article can be accessed online at https://doi.org/10.1080/19420862.2024.2304282.
Additional information
Funding
References
- Mullard A. FDA approves 100th monoclonal antibody product. Nat Rev Drug Discov. 2021;20(7):491–14. doi:10.1038/d41573-021-00079-7.
- Kaplon H, Crescioli S, Chenoweth A, Visweswaraiah J, Reichert JM. Antibodies to watch in 2023. MAbs. 2023;15(1):2153410. doi:10.1080/19420862.2022.2153410.
- Carter PJ, Rajpal A. Designing antibodies as therapeutics. Cell. 2022;185(15):2789–805. doi:10.1016/j.cell.2022.05.029.
- Viola M, Sequeira J, Seica R, Veiga F, Serra J, Santos AC, Ribeiro AJ. Subcutaneous delivery of monoclonal antibodies: How do we get there? J Control Release. 2018;286:301–314. doi:10.1016/j.jconrel.2018.08.001.
- Pitiot A, Heuze-Vourc’h N, Secher T. Alternative Routes of Administration for Therapeutic Antibodies—state of the art. Antibodies (Basel). 2022;11(3):56. doi:10.3390/antib11030056.
- Ghosh I, Gutka H, Krause ME, Clemens R, Kashi RS. A systematic review of commercial high concentration antibody drug products approved in the US: formulation composition, dosage form design and primary packaging considerations. MAbs. 2023;15(1):2205540. doi:10.1080/19420862.2023.2205540.
- Strickley RG, Lambert WJ. A review of formulations of commercially available antibodies. J Pharm Sci. 2021;110(7):2590–608 e2556. doi:10.1016/j.xphs.2021.03.017.
- Deokar V, Sharma A, Mody R, Volety SM. Comparison of strategies in development and manufacturing of low viscosity, ultra-high concentration formulation for IgG1 antibody. J Pharm Sci. 2020;109:3579–89. doi:10.1016/j.xphs.2020.09.014.
- Chari R, Jerath K, Badkar AV, Kalonia DS. Long- and short-range electrostatic interactions affect the rheology of highly concentrated antibody solutions. Pharm Res. 2009;26(12):2607–18. doi:10.1007/s11095-009-9975-2.
- Tomar DS, Kumar S, Singh SK, Goswami S, Li L. Molecular basis of high viscosity in concentrated antibody solutions: strategies for high concentration drug product development. MAbs. 2016;8(2):216–28. doi:10.1080/19420862.2015.1128606.
- Lilyestrom WG, Yadav S, Shire SJ, Scherer TM. Monoclonal antibody self-association, cluster formation, and rheology at high concentrations. J Phys Chem B. 2013;117(21):6373–84. doi:10.1021/jp4008152.
- Liu J, Nguyen MD, Andya JD, Shire SJ. Reversible self-association increases the viscosity of a concentrated monoclonal antibody in aqueous solution. J Pharm Sci. 2005;94:1928–40. doi:10.1002/jps.20347.
- Arora J, Hu Y, Esfandiary R, Sathish HA, Bishop SM, Joshi SB, Middaugh CR, Volkin DB, Weis DD. Charge-mediated Fab-Fc interactions in an IgG1 antibody induce reversible self-association, cluster formation, and elevated viscosity. MAbs. 2016;8(8):1561–74. doi:10.1080/19420862.2016.1222342.
- Kanai S, Liu J, Patapoff TW, Shire SJ. Reversible self-association of a concentrated monoclonal antibody solution mediated by Fab–Fab interaction that impacts solution viscosity. J Pharm Sci. 2008;97(10):4219–27. doi:10.1002/jps.21322.
- Yadav S, Laue TM, Kalonia DS, Singh SN, Shire SJ. The influence of charge distribution on self-association and viscosity behavior of monoclonal antibody solutions. Mol Pharm. 2012;9:791–802. doi:10.1021/mp200566k.
- Bethea D, Wu SJ, Luo J, Hyun L, Lacy ER, Teplyakov A, Jacobs SA, O’Neil KT, Gilliland GL, Feng Y. Mechanisms of self-association of a human monoclonal antibody CNTO607. Protein Eng Des Sel. 2012;25(10):531–37. doi:10.1093/protein/gzs047.
- Esfandiary R, Parupudi A, Casas-Finet J, Gadre D, Sathish H. Mechanism of reversible self-association of a monoclonal antibody: role of electrostatic and hydrophobic interactions. J Pharm Sci. 2015;104:577–86. doi:10.1002/jps.24237.
- Geoghegan JC, Fleming R, Damschroder M, Bishop SM, Sathish HA, Esfandiary R. Mitigation of reversible self-association and viscosity in a human IgG1 monoclonal antibody by rational, structure-guided Fv engineering. MAbs. 2016;8(5):941–50. doi:10.1080/19420862.2016.1171444.
- Apgar JR, Tam ASP, Sorm R, Moesta S, King AC, Yang H, Kelleher K, Murphy D, D’Antona AM, Yan G. et al. Modeling and mitigation of high-concentration antibody viscosity through structure-based computer-aided protein design. PloS One. 2020;15(5):e0232713. doi:10.1371/journal.pone.0232713.
- Chow CK, Allan BW, Chai Q, Atwell S, Lu J. Therapeutic antibody engineering to improve viscosity and phase separation guided by crystal structure. Mol Pharm. 2016;13:915–23. doi:10.1021/acs.molpharmaceut.5b00817.
- Tilegenova C, Izadi S, Yin J, Huang CS, Wu J, Ellerman D, Hymowitz SG, Walters B, Salisbury C, Carter PJ. Dissecting the molecular basis of high viscosity of monospecific and bispecific IgG antibodies. MAbs. 2020;12(1):1692764. doi:10.1080/19420862.2019.1692764.
- Domnowski M, Lo Presti K, Binder J, Reindl J, Lehmann L, Kummer F, Wolber M, Satzger M, Dehling M, Jaehrling J. et al. Generation of mAb variants with less attractive self-interaction but preserved target binding by well-directed mutation. Mol Pharm. 2021;18:236–45. doi:10.1021/acs.molpharmaceut.0c00848.
- Shan L, Mody N, Sormani P, Rosenthal KL, Damschroder MM, Esfandiary R. Developability Assessment of Engineered Monoclonal Antibody Variants with a Complex Self-Association Behavior Using Complementary Analytical and in silico tools. Mol Pharm. 2018;15:5697–710. doi:10.1021/acs.molpharmaceut.8b00867.
- Wolf Perez AM, Lorenzen N, Vendruscolo M, Sormanni P. Assessment of therapeutic antibody developability by combinations of in vitro and in silico methods. Methods Mol Biol. 2022;2313:57–113. doi:10.1007/978-1-0716-1450-1_4.
- Cunningham BC, Wells JA. High-resolution epitope mapping of hGH-receptor interactions by alanine-scanning mutagenesis. Sci. 1989;244(4908):1081–85. doi:10.1126/science.2471267.
- Cloutier TK, Sudrik C, Mody N, Sathish HA, Trout BL. Machine Learning Models of Antibody–excipient preferential interactions for use in computational formulation design. Mol Pharm. 2020;17(9):3589–99. doi:10.1021/acs.molpharmaceut.0c00629.
- Cloutier TK, Sudrik C, Mody N, Hasige SA, Trout BL. Molecular computations of preferential interactions of proline, arginine.HCl, and NaCl with IgG1 antibodies and their impact on aggregation and viscosity. MAbs. 2020;12(1):1816312. doi:10.1080/19420862.2020.1816312.
- Krissinel E, Henrick K. Inference of macromolecular assemblies from crystalline state. J Mol Biol. 2007;372:774–97. doi:10.1016/j.jmb.2007.05.022.
- Chennamsetty N, Voynov V, Kayser V, Helk B, Trout BL. Design of therapeutic proteins with enhanced stability. Proc Natl Acad Sci U S A. 2009;106:11937–42. doi:10.1073/pnas.0904191106.
- Baker NA. Poisson-Boltzmann methods for biomolecular electrostatics. Methods Enzymol. 2004;383:94–118. doi:10.1016/S0076-6879(04)83005-2.
- Morrison KL, Weiss GA. Combinatorial alanine-scanning. Curr Opin Chem Biol. 2001;5:302–07. doi:10.1016/s1367-5931(00)00206-4.
- Sanner MF, Olson AJ, Spehner JC. Reduced surface: an efficient way to compute molecular surfaces. Biopolymers. 1996;38(3):305–20. doi:10.1002/(SICI)1097-0282(199603)38:3<305:AID-BIP4>3.0.CO;2-Y.
- Johnson G, Wu TT. Kabat database and its applications: 30 years after the first variability plot. Nucleic Acids Res. 2000;28(1):214–18. doi:10.1093/nar/28.1.214.
- Kabat EA, Wu TT, Perry HM, Gottesman KS, Foeller C. Sequences of proteins of immunological interest. Bethesda, MD: NIH; 1991.
- Hötzel I, Theil F-P, Bernstein LJ, Prabhu S, Deng R, Quintana L, Lutman J, Sibia R, Chan P, Bumbaca D. et al. A strategy for risk mitigation of antibodies with fast clearance. MAbs. 2012;4:753–60. doi:10.4161/mabs.22189.
- Reynisson B, Alvarez B, Paul S, Peters B, Nielsen M. NetMHCpan-4.1 and NetMHCIIpan-4.0: improved predictions of MHC antigen presentation by concurrent motif deconvolution and integration of MS MHC eluted ligand data. Nucl Acids Res. 2020;48(W1):W449–54. doi:10.1093/nar/gkaa379.
- Prihoda D, Maamary J, Waight A, Juan V, Fayadat-Dilman L, Svozil D, Bitton DA. BioPhi: a platform for antibody design, humanization, and humanness evaluation based on natural antibody repertoires and deep learning. MAbs. 2022;14(1):2020203. doi:10.1080/19420862.2021.2020203.
- Raybould MIJ, Marks C, Krawczyk K, Taddese B, Nowak J, Lewis AP, Bujotzek A, Shi J, Deane CM. Five computational developability guidelines for therapeutic antibody profiling. Proc Natl Acad Sci U S A. 2019;116:4025–30. doi:10.1073/pnas.1810576116.
- Kingsbury JS, Saini A, Auclair SM, Fu L, Lantz MM, Halloran KT, Calero-Rubio C, Schwenger W, Airiau CY, Zhang J. et al. A single molecular descriptor to predict solution behavior of therapeutic antibodies. Sci Adv. 2020;6(32):eabb0372. doi:10.1126/sciadv.abb0372.
- Dingfelder F, Henriksen A, Wahlund PO, Arosio P, Lorenzen N. Measuring self-association of antibody lead candidates with dynamic light scattering. Methods Mol Biol. 2022;2313:241–58. doi:10.1007/978-1-0716-1450-1_14.
- Arosio P, Muller T, Rajah L, Yates EV, Aprile FA, Zhang Y, Cohen SI, White DA, Herling TW, De Genst EJ. et al. Microfluidic diffusion analysis of the sizes and interactions of proteins under native solution conditions. Acs Nano. 2016;10(1):333–41. doi:10.1021/acsnano.5b04713.
- Kopp MRG, Arosio P. Microfluidic approaches for the characterization of therapeutic proteins. J Pharm Sci. 2018;107:1228–36. doi:10.1016/j.xphs.2018.01.001.
- Starr CG, Makowski EK, Wu L, Berg B, Kingsbury JS, Gokarn YR, Tessier PM. Ultradilute measurements of self-association for the identification of antibodies with favorable high-concentration solution properties. Mol Pharm. 2021;18:2744–53. doi:10.1021/acs.molpharmaceut.1c00280.
- Sule SV, Dickinson CD, Lu J, Chow CK, Tessier PM. Rapid analysis of antibody self-association in complex mixtures using immunogold conjugates. Mol Pharm. 2013;10:1322–31. doi:10.1021/mp300524x.
- Phan S, Walmer A, Shaw EW, Chai Q. High-throughput profiling of antibody self-association in multiple formulation conditions by PEG stabilized self-interaction nanoparticle spectroscopy. MAbs. 2022;14(1):2094750. doi:10.1080/19420862.2022.2094750.
- Leem J, Dunbar J, Georges G, Shi J, Deane CM. ABodyBuilder: automated antibody structure prediction with data–driven accuracy estimation. MAbs. 2016;8(7):1259–68. doi:10.1080/19420862.2016.1205773.
- Gupta P, Makowski EK, Kumar S, Zhang Y, Scheer JM, Tessier PM. Antibodies with weakly basic isoelectric points minimize trade-offs between formulation and physiological colloidal properties. Mol Pharm. 2022;19:775–87. doi:10.1021/acs.molpharmaceut.1c00373.
- Kuroda D, Tsumoto K. Engineering stability, viscosity, and immunogenicity of antibodies by computational design. J Pharm Sci. 2020;109:1631–51. doi:10.1016/j.xphs.2020.01.011.
- Edelman GM, Cunningham BA, Gall WE, Gottlieb PD, Rutishauser U, Waxdal MJ. The covalent structure of an entire γg immunoglobulin molecule. Proc Natl Acad Sci U S A. 1969;63(1):78–85. doi:10.1073/pnas.63.1.78.
- Pullmann P, Ulpinnis C, Marillonnet S, Gruetzner R, Neumann S, Weissenborn MJ. Golden mutagenesis: an efficient multi-site-saturation mutagenesis approach by golden Gate cloning with automated primer design. Sci Rep. 2019;9(1):10932. doi:10.1038/s41598-019-47376-1.
- Bos AB, Luan P, Duque JN, Reilly D, Harms PD, Wong AW. Optimization and automation of an end-to-end high throughput microscale transient protein production process. Biotechnol Bioeng. 2015;112:1832–42. doi:10.1002/bit.25601.
- Koth CM, Murray JM, Mukund S, Madjidi A, Minn A, Clarke HJ, Wong T, Chiang V, Luis E, Estevez A. et al. Molecular basis for negative regulation of the glucagon receptor. Proc Natl Acad Sci U S A. 2012;109:14393–98. doi:10.1073/pnas.1206734109.
- Kabsch W. Xds. Acta Crystallogr D Biol Crystallogr. 2010;66(2):125–32. doi:10.1107/S0907444909047337.
- Evans PR, Murshudov GN. How good are my data and what is the resolution? Acta Crystallogr D Biol Crystallogr. 2013;69(7):1204–14. doi:10.1107/S0907444913000061.
- Karplus PA, Diederichs K. Linking crystallographic model and data quality. Sci. 2012;336(6084):1030–33. doi:10.1126/science.1218231.
- Emsley P, Lohkamp B, Scott WG, Cowtan K. Features and development of coot. Acta Crystallogr D Biol Crystallogr. 2010;66(4):486–501. doi:10.1107/S0907444910007493.
- Liebschner D, Afonine PV, Baker ML, Bunkoczi G, Chen VB, Croll TI, Hintze B, Hung LW, Jain S, McCoy AJ. et al. Macromolecular structure determination using X-rays, neutrons and electrons: recent developments in Phenix. Acta Crystallogr D Struct Biol. 2019;75(10):861–77. doi:10.1107/S2059798319011471.
- Afonine PV, Grosse-Kunstleve RW, Echols N, Headd JJ, Moriarty NW, Mustyakimov M, Terwilliger TC, Urzhumtsev A, Zwart PH, Adams PD. Towards automated crystallographic structure refinement with phenix.Refine. Acta Crystallogr D Biol Crystallogr. 2012;68(4):352–67. doi:10.1107/S0907444912001308.
- Molecular Operating Environment (MOE). 2022. 02 Chemical Computing Group ULC, 910-1010 Sherbrooke St. W., Montreal, QC H3A 2R7, Canada, 2023.
- Dolinsky TJ, Nielsen JE, McCammon JA, Baker NA. PDB2PQR: an automated pipeline for the setup of poisson-boltzmann electrostatics calculations. Nucleic Acids Res. 2004;32(Web Server):W665–667. doi:10.1093/nar/gkh381.
- Sondergaard CR, Olsson MH, Rostkowski M, Jensen JH. Improved treatment of ligands and coupling effects in empirical calculation and rationalization of pKa values. J Chem Theory Comput. 2011;7:2284–95. doi:10.1021/ct200133y.
- Olsson MH, Sondergaard CR, Rostkowski M, Jensen JH. PROPKA3: consistent treatment of internal and surface residues in empirical pKa predictions. J Chem Theory Comput. 2011;7:525–37. doi:10.1021/ct100578z.
- Lauer TM, Agrawal NJ, Chennamsetty N, Egodage K, Helk B, Trout BL. Developability index: a rapid in silico tool for the screening of antibody aggregation propensity. J Pharm Sci. 2012;101:102–15. doi:10.1002/jps.22758.
- Case DA, Ben-Shalom IY, Brozell SR, Cerutti DS, Cheatham I, Cruzeiro VWD, Darden TA, Duke RE, Ghoreishi D, Giambasu G. et al. AMBER 2019. San Francisco: University of California; 2019
- Salomon-Ferrer R, Case DA, Walker RC. An overview of the amber biomolecular simulation package. Wiley Interdiscip Rev Comput Mol Sci. 2013;3:198–210. doi:10.1002/wcms.1121.
- Salomon-Ferrer R, Gotz AW, Poole D, Le Grand S, Walker RC. Routine microsecond molecular dynamics simulations with AMBER on GPUs. 2. Explicit solvent particle mesh ewald. J Chem Theory Comput. 2013;9:3878–88. doi:10.1021/ct400314y.
- Maier JA, Martinez C, Kasavajhala K, Wickstrom L, Hauser KE, Simmerling C. ff14SB: improving the accuracy of protein side chain and backbone parameters from ff99SB. J Chem Theory Comput. 2015;11(8):3696–713. doi:10.1021/acs.jctc.5b00255.
- Jorgensen WL, Chandreasekhar J, Madura JD, I RW, Klein ML. Comparison of simple potential functions for simulating liquid water. J Chem Phys. 1983;79(2):926–35. doi:10.1063/1.445869.
- Rasouli M. Basic concepts and practical equations on osmolality: biochemical approach. Clin Biochem. 2016;49:936–41. doi:10.1016/j.clinbiochem.2016.06.001.
- Bjellqvist B, Hughes GJ, Pasquali C, Paquet N, Ravier F, Sanchez JC, Frutiger S, Hochstrasser D. The focusing positions of polypeptides in immobilized pH gradients can be predicted from their amino acid sequences. Electrophoresis. 1993;14(1):1023–31. doi:10.1002/elps.11501401163.
- Bjellqvist B, Basse B, Olsen E, Celis JE. Reference points for comparisons of two-dimensional maps of proteins from different human cell types defined in a pH scale where isoelectric points correlate with polypeptide compositions. Electrophoresis. 1994;15(1):529–39. doi:10.1002/elps.1150150171.
- Raybould MIJ, Deane CM. The therapeutic antibody profiler for computational developability assessment. Methods Mol Biol. 2022;2313:115–25. doi:10.1007/978-1-0716-1450-1_5.
- Olsen TH, Boyles F, Deane CM. Observed antibody space: a diverse database of cleaned, annotated, and translated unpaired and paired antibody sequences. Protein Sci. 2022;31:141–46. doi:10.1002/pro.4205.
- Marrama D, Chronister WD, Westernberg L, Vita R, Kosaloglu-Yalcin Z, Sette A, Nielsen M, Greenbaum JA, Peters B. Pepmatch: a tool to identify short peptide sequence matches in large sets of proteins. BMC Bioinform. 2023;24(1):485. doi:10.1186/s12859-023-05606-4.